1. 32/54/2011-12/PVSE
Ministry of New and Renewable Energy
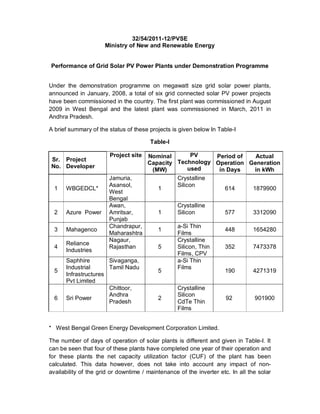
Performance of Grid Solar PV Power Plants under Demonstration Programme
Under the demonstration programme on megawatt size grid solar power plants,
announced in January, 2008, a total of six grid connected solar PV power projects
have been commissioned in the country. The first plant was commissioned in August
2009 in West Bengal and the latest plant was commissioned in March, 2011 in
Andhra Pradesh.
A brief summary of the status of these projects is given below In Table-I
Table-I
Project site Nominal PV Period of Actual
Sr. Project
Capacity Technology Operation Generation
No. Developer used
(MW) in Days in kWh
Jamuria, Crystalline
Asansol, Silicon
1 WBGEDCL* 1 614 1879900
West
Bengal
Awan, Crystalline
2 Azure Power Amritsar, 1 Silicon 577 3312090
Punjab
Chandrapur, a-Si Thin
3 Mahagenco 1 448 1654280
Maharashtra Films
Nagaur, Crystalline
Reliance
4 Rajasthan 5 Silicon, Thin 352 7473378
Industries
Films, CPV
Saphhire Sivaganga, a-Si Thin
Industrial Tamil Nadu Films
5 5 190 4271319
Infrastructures
Pvt Limited
Chittoor, Crystalline
Andhra Silicon
6 Sri Power 2 92 901900
Pradesh CdTe Thin
Films
* West Bengal Green Energy Development Corporation Limited.
The number of days of operation of solar plants is different and given in Table-I. It
can be seen that four of these plants have completed one year of their operation and
for these plants the net capacity utilization factor (CUF) of the plant has been
calculated. This data however, does not take into account any impact of non-
availability of the grid or downtime / maintenance of the inverter etc. In all the solar
2. plants installed under the demonstration programme of the Ministry, the PV capacity
is reported as the net sum of PV module capacity installed. This capacity is not at the
AC side.
The CUF of these four plants is in the range of 12.29% to 18.8%. The plant wise
capacity, actual generation over the given period of plant operation and the plant
CUF are given in Table-II.
Table-II
Actual
Nominal Generation
Sr. Days Actual
Project Developer Capacity in units
No. CUF %
(MW) during the
period
1 WBGEDCL (Sept 09 Aug 10) 365 1 1130700 12.29
2 WBGEDCL 2(Sept 10 April 11) 242 1 730500
3 Azure (Dec 09 Nov 10) 365 1 1571610 16.92
4 Azure 2 (Dec 10 Jun 11) 212 2* 1740480
5 Mahagenco (May 10- April 11) 365 1 1347840 15.39
6 Mahagenco (May 11 June11) 61 1 273640
7 Reliance (July 10 June 11) 352 5 7473378 18.80
8 Saphhire (Dec 10 June 11) 190 5 4271319
9 Sri Power (March 11 May 11) 92 2 901900
* The 2nd MW capacity was added in the month of November, 2010.
From the above Table it is seen that so far the overall performance of the plant in
Rajasthan is best at present. Except for the plant in West Bengal, which was the first
plant and a part of the initial learning curve, the average CUF of all other plants is in
the range of 15% to 19%.
The highest CUF achieved, in any month of a year, for each solar plant is as given
below in Table-III. It can be seen from the Table that all the solar plants have
reported highest CUF during March-May period. Except for WBGEDCL project
where the highest CUF was 14.93%, all other plants have achieved highest CUF in
the range of 20.21% to 23.63%.
3. Table-III
Actual Highest
Sr. Month of
Project Developer Generation CUF %
No. Highest in units so far
CUF
1 WBGEDCL I March 2010 116600 14.93
2 WBGEDCL II March 2011 113600 14.54
3 Azure I April 2010 149265 20.73
4 Azure II April 2011 300900 20.90
5 Mahagenco I April 2011 145520 20.21
6 Mahagenco II May 2011 156560 21.04
7 Reliance Ind. March 2011 879104 23.63
8 Saphhire May 2011 733286 20.37
9 Sri Power March 2011 334440 22.48
The lowest CUF in any month for each solar plant, where 12 months of operation
have been completed is as given below in Table-IV.
Table-IV
Actual Lowest
Sr. Month of Generation CUF %
Project Developer
No. Lowest in kWh in reported
CUF the month so far
1 WBGEDCL Dec 2009 82200 10.52
2 Azure Power Jan 2010 60795 8.17
3 Mahagenco May 2010 73620 9.9
4 Reliance Ind. August 2010 363300 10.17
In all cases, except WBGEDCL project, the lowest performance reported so far was
within the first two months of the synchronization of the solar plant with the grid.
The specific month-wise performance details of each of the six solar plants, including
the choice of technology and the grid connectivity voltage are given in Table V to
Table X.
4. Table -V
Project Developer : West Bengal Green Energy Development Corporation Limited
Location :Seebpore Power Station of DPSC Ltd., Block Jamuria, Asansol, West Bengal
Plant Capacity :1 MW, Crystalline Silicon Modules
Grid Connectivity :11 kV
Month-wise Generation Details