Investment Analysis Fge Mrs. Nicki Titze
•
3 likes•705 views

Purchase of Home for Lifestyle and Investment Purposes

Recommended
Recommended
More Related Content
What's hot
What's hot (18)
Viewers also liked
Viewers also liked (8)
Similar to Investment Analysis Fge Mrs. Nicki Titze
Similar to Investment Analysis Fge Mrs. Nicki Titze (20)
Investment Analysis Fge Mrs. Nicki Titze
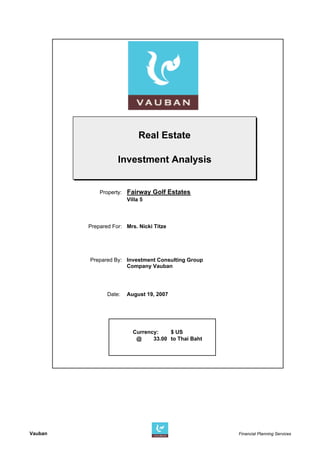
- 1. Real Estate Investment Analysis Property: Fairway Golf Estates Villa 5 Prepared For: Mrs. Nicki Titze Prepared By: Investment Consulting Group Company Vauban Date: August 19, 2007 Currency: $ US @ 33.00 to Thai Baht Dep Vauban Financial Planning Services
- 2. Income-Property Investment Analysis Property Location: Zephyr Valley Hua Hin, Thailand Type of Property: Single-Family 505 m2 total living area Date of this Analysis: August 19, 2007 Purpose: The purpose of this analysis is to project and demonstrate the future economic benefits to be derived from this property over a 10-year period. For the sake of the analysis, certain assump- tions have been made concerning future revenue, expenses, and financing implications related to the ownership and operation of the property. Those assumptions, as well as projections about income or loss, cash flow and profit from resale are presented on the following pages. Property purchased at $1,200.48 per square foot. Analysis Mos. in 1st Year of Analysis: 3 Year this Analysis Begins: 2009 Anticipated Year of Resale: 2018 Investor Name: Marginal Tax Bracket: 0.00 % preciation Type: 27.5-Year Straight Line Depreciable Basis: $6,062 Vauban Financial Planning Services
- 3. Basic Information Property Description 3 bedroom, 3 bath private villa with separate maid's room and bath. Total land size area is 1,589 square meters and the total home size is 505 square meters. The home includes a private pool and direct views of the new Black Mountain Golf Course. This private community will have complete 5-star facilities. Purchase Payment Schedule (Please see Contract for payment terms) $ US Reservation Fee: (Thai Baht) 100,000 3,030 1st Payment (less Res. Fee) 30% 178,843 2nd Payment: 10% 60,624 3rd Payment: 5% 30,312 4th Payment: 5% 30,312 Furnishings Package 3% 24,250 Closing Costs 1% 6,062 Developer Financing 50% 303,122 636,557 Acquisition Sources of Funds Cash Investment 333,435 Developer Financing 303,122 Total: 636,557 Uses of Funds Purchase Price 606,245 20,006,080 thb Furnishings Package 24,250 39,616 /m2 Closing Costs 6,062 Points 0 1st Year Capital ImprovemeTotal: 636,557 Deferred Payments Terms 303,122 principal 8 year term 6.50 % 0.00 points 4,058 per month Placed 10/2008 Vauban Financial Planning Services
- 4. Analysis Summary Assumptions Annual Price Appreciation Rate 9% Annual Rental Growth Rate 6% Annual Op. Exp. Growth Rate 4% First Year, Average $ US Nightly Rental Rate: 450 14,850 Average Occupancy Rate: 2009 10% 2010 35% 2011 40% 2012 45% 2013 50% 2014 50% 2015 55% 2016 55% 2017 60% 2018 60% Cash Flow Totals (10 years) Rental Income 949,166 100% Less; Operating Expenses (350,064) -37% Deferred Payments (389,536) -41% Equals: Net Cash Flow 209,566 22% Plus: Increase in Value 655,894 Compare this return to 458,414 which is the before-tax return (including principal) on the same amount invested in a Treasury Bill earning an effective annual yield of 3.50%. Vauban Financial Planning Services
- 5. Cash Flow Projections Operating and Net Income $ US Gross Operating Deferred Cash Cumulative Income Expenses Payments Flow Cash Flow 2009 3,791 (711) (12,173) (9,093) (9,093) 2010 56,262 (21,299) (48,692) (13,729) (22,822) 2011 68,158 (25,559) (48,692) (6,094) (28,915) 2012 81,278 (30,253) (48,692) 2,332 (26,583) 2013 95,727 (35,419) (48,692) 11,616 (14,967) 2014 101,471 (37,544) (48,692) 15,235 268 2015 118,315 (43,561) (48,692) 26,062 26,330 2016 125,414 (46,175) (48,692) 30,547 56,876 2017 145,024 (53,176) (36,519) 55,330 112,206 2018 153,726 (56,366) 0 97,360 209,566 949,166 (350,064) (389,536) 209,566 160,000 Gross Inc. 140,000 After Op. Exp. After Def. Pmts. 120,000 100,000 80,000 60,000 40,000 20,000 0 -20,000 2009 2010 2011 2012 2013 2014 2015 2016 2017 2018 Year Vauban Financial Planning Services
- 6. Resale Resale at End of 2018 $ US Projected Selling Price: 1,347,000 Cost of Sale: 6% 80,820 Net Proceeds After Sale 1,266,180 After-Tax Sale Proceeds: 1,266,180 Capital Gain 655,894 1,600,000 1,400,000 Debt Equity 1,200,000 Debt and Equity 1,000,000 800,000 600,000 400,000 200,000 0 2009 2010 2011 2012 2013 2014 2015 2016 2017 2018 Year Vauban Financial Planning Services
- 7. Investment Cash Flow Overview $ US Initial Net Cash Annual Proceeds Year Invested Income Cash Flow Yield from Sale 2009 333,435 0 (9,093) -3% 2010 6,389 (13,729) -4% 2011 21,480 (6,094) -2% 2012 33,206 2,332 1% 2013 44,805 11,616 3% 2014 50,893 15,235 5% 2015 66,722 26,062 8% 2016 75,115 30,547 9% 2017 90,659 55,330 17% 2018 97,139 97,360 29% 1,266,180 Totals: 333,435 #DIV/0! 209,566 #DIV/0! 1,266,180 Investment Results Total Annual Rate of Return 15.22% Total Return on Investment 1,475,746 = 209,566 + 1,266,180 1,475,746 is the projected total cash return on an initial cash investment of 333,435. 342.59% is the estimated tota al return on investment over the holding period. 1,400,000 Proj. Selling Price Selling Price / Outstanding Debt / Equity 1,200,000 Outstanding Debt Equity 1,000,000 800,000 600,000 400,000 200,000 0 2009 2010 2011 2012 2013 2014 2015 2016 2017 2018 Year Vauban Financial Planning Services
- 8. Disclaimer The information and calculations presented in this analysis are believed to be accurate, but are not guaranteed. They are intended for the purposes of projection and analysis, and should not be used for preparation of income tax returns. The user of this report should consult a tax specialist concerning his/her particular circumstances before making any investment decision. rulings, regulations and technical corrections. For purposes of presentation we are using the most current currency exchange rate. *Note especially that a taxpayer’s ability to use losses generated by this investment to offset income generated by this investment is likely to be affected by the taxpayer’s particular circumstances, including Adjusted Gross Income, and passive and investment income or loss 120,000 20% Cash Flow 100,000 Annual ROR 15% 10% Annual Rate of Return 80,000 5% Cash Flow 60,000 0% 40,000 -5% 20,000 -10% 0 -15% 2009 2010 2011 2012 2013 2014 2015 2016 2017 2018 © 1982-2005, RealData® Inc., Southport, CT All Rights Reserved -20,000 -20% http://www.realdata.com Year Vauban Financial Planning Services