More Related Content
Similar to Fis strategic insights vol 6 march 2012 (20)
More from Paul McAdam (20)
Fis strategic insights vol 6 march 2012
- 1. VOLUME 6 • MARCH 2012
Marketing IN THIS ISSUE
Efficiency Matters • Marketing
Efficiency Matters
• Calming the EMV Storm
By Fred Brothers
EXECUTIVE VICE PRESIDENT, STRATEGIC INNOVATION • Dissecting the Credit
Union Member Base
Recently, I’ve discussed several ways of improving • Attracting and Retaining
operational efficiency at financial institutions – Gen Y and Gen X
leveraging customer data to improve the top line and
outsourcing to improve the bottom line. Given a host
of recent industry headwinds, financial institutions have
had limited ways to drive revenue
to improve their efficiency ratios.
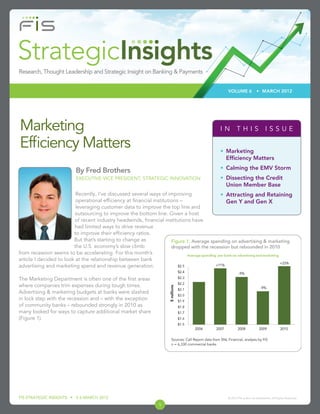
But that’s starting to change as Figure 1: Average spending on advertising & marketing
the U.S. economy’s slow climb dropped with the recession but rebounded in 2010
from recession seems to be accelerating. For this month’s
article I decided to look at the relationship between bank
advertising and marketing spend and revenue generation.
The Marketing Department is often one of the first areas
where companies trim expenses during tough times.
Advertising & marketing budgets at banks were slashed
in lock step with the recession and – with the exception
of community banks – rebounded strongly in 2010 as
many looked for ways to capture additional market share
(Figure 1).
Sources: Call Report data from SNL Financial, analysis by FIS
n = 6,330 commercial banks
FIS STRATEGIC INSIGHTS • V 6 MARCH 2012 © 2012 FIS and/or its subsidiaries. All Rights Reserved.
1
- 2. Advertising & marketing expense represented about 3
percent of 2010 total operating expense spending, up Another factor that confounds measurement of the return
from 2.7 percent in 2009. The spending range varies on marketing expense is the rising impact of unpaid
by asset size; banks below $250 million in assets spent social media on market share. An extreme example of
2.2 percent while banks with more than $100 billion in the impact of social media is Bank Transfer Day spawned
assets devoted 3.4 percent of total operating expense to by Kristen Christian, who initially complained about
marketing. But overall, industry spending on marketing is Bank of America’s $5.00 per month debit card fees to
friends and family on Facebook. The viral spreading of
a small percentage compared with salaries & benefits (48
her complaints ultimately resulted in 85,000 “attendees”
percent) and occupancy & fixed assets (11 percent). So
to join the “cause” via Facebook, 60,000 Facebook
how much effect can a small part of operating expense
“likes” for the event and 5,100 Bank Transfer Day posts
have on FI performance? Does cutting advertising &
between last October and the end of the year.2 And of
marketing, as was done by 77 percent of banks in 2009,
course, Bank Transfer Day ended up receiving significant
negatively affect performance? mainstream media coverage.
Research using commercial bank Call Reports prior to the According to FIS’ tracking of financial institution
Great Recession showed that bank profits and market checking account openings, credit union volume
share did in fact increase with increased spending on soared by 115 percent year-to-year on Bank Transfer
advertising & promotion.1 But in today’s environment Day (Figure 2). The Credit Union National Association
the relationship between spending on marketing and estimated that 40,000 new members joined credit
performance is not as easy to prove, especially the unions on Nov. 5 – Bank Transfer Day – thereby
profitability part. increasing the market share of credit unions. These new
account openings will be reflected in regulatory reports,
To answer some of our questions, we looked at the but will not be captured in marketing metrics since they
relationship between advertising & marketing spending were driven by unpaid media.
and revenue (net-interest income + non-interest income)
for a sample 2,292 banks. We assembled the data
Figure 2: Credit union volume skyrocketed on Bank
from Call Reports to exclude banks with incomplete
Transfer Day
information, de novos, special-purpose banks, and
banks with anomalous loan-to-deposit ratios, net-interest
margins and efficiency ratios.
The resulting analysis of the two metrics displayed
in the scatterplot below (Figure 3) shows the
relationship between:
• Incremental revenue gained in 2010 per advertising &
marketing dollar spent in 2009 (vertical axis).
• Advertising & marketing spending (2009)
as a percentage of total non-interest expense
Sources: FIS tracking of financial institution checking account openings,
(horizontal axis). November 2011
• The dashed lines in the scatterplot represent the
industry averages for both metrics ($1.63 for incremental
revenue gain, 2.7 percent for marketing spend)
FIS STRATEGIC INSIGHTS • V 6 MARCH 2012 © 2012 FIS and/or its subsidiaries. All Rights Reserved.
2
- 3. The results show the greatest dispersion
of incremental revenue among banks Figure 3: Lower percentages spent on advertising & marketing in 2009
resulted in more dispersion of incremental revenue per dollar spent
that spend the least. It seems that very
limited spending on marketing can
be a risky strategy − either producing
big returns or big losses. Remember,
more than three-quarters of banks
cut their marketing budgets in 2009.
Some experienced healthy incremental
revenue growth despite the cuts, but
others may have suffered as a result of
cutting marketing budgets.
We segmented the banks into four
groups based on their placement within
the marketing performance scatterplot
(Aggressive, Efficient, Cautious and
Inefficient). While the level of marketing
spending is only one of several factors
that can drive incremental revenue gains
or losses (particularly in challenging
years like 2009 – 2010), some interesting
patterns emerged as we analyzed the Sources: SNL Call Reports 2010, analysis by FIS
n = 2,292 commercial banks
financial results of banks in the four
segments (see Figure 4).
Only 27 percent of banks attained However, the similarities between Efficient and Cautious
above-average performance in incremental revenue banks end there. Efficient banks performed strongly (on
gained per dollar of marketing spending during the return on marketing) while Cautious banks struggled.
period (Aggressive and Efficient banks). And as one would Even though the Cautious banks invested a little more
expect, these banks obtained ROAA and efficiency ratio in marketing, Efficient banks grew loans and deposits,
performance far exceeding that of the lower performing had net-interest margin 12 basis points higher and had
Inefficient and Cautious banks. efficiency ratios 8 percentage points lower on average.
It’s no wonder Efficient banks generated incremental
A significant size difference exists among the four revenue of $19.60 per dollar spent on marketing while
segments. Efficient and Cautious banks are much Cautious banks experienced an incremental revenue
smaller than banks in the other two segments and spend decline of $2.78.
roughly half of the percentage of operating expense on
marketing. A far higher percentage of their operating Efficient banks are managed conservatively and execute
expense is composed of salaries & benefits and the their community bank business models very effectively.
proportion of their spending on occupancy & fixed assets They had the lowest loan-to-deposits ratio, were less
(branches) is higher as well. This of course, makes sense as reliant on fee income and made the most of the meager
smaller banks rely much more on their staff, branches and dollars they spent on marketing, staffing and branches.
community presence than extensive marketing campaigns Cautious banks had the lowest ROAA of the four
to drive revenue growth. On average, Efficient banks segments, which most likely factored into their decision to
are relatively smaller (only $295 million in assets with six allocate lower resources to marketing.
branches) while Cautious banks are more than double that
size ($796 million in assets with 12 branches), but are still
solidly community banking organizations.
FIS STRATEGIC INSIGHTS • V 6 MARCH 2012 © 2012 FIS and/or its subsidiaries. All Rights Reserved.
3
- 4. Figure 4: Average financial results for banks in each quadrant
Sources: Call Report data from SNL Financial and FIS (2009 – 2010), analysis by FIS
n = 2,292 commercial banks
As a rule of thumb, large banks benefit from economies Efficient or Cautious banks but only about half as much as
of scale that drive more favorable efficiency ratios. But, as Inefficient banks. They also spend relatively less per branch
we see in Figure 4, Aggressive banks, which are smaller than Inefficient banks on salary & benefits and occupancy
than Inefficient banks, generated better efficiency ratios – & fixed assets. Thus, Aggressive banks offset above-
62 percent vs. 68 percent respectively – and realized average spending on marketing by spending relatively less
higher ROAA. in other areas.
Similar patterns emerged among Aggressive and So did the banks that invested more in marketing during
Inefficient banks as did with the banks that spend less on this period spend their money unwisely? It’s not possible
marketing. Aggressive banks performed strongly while to unequivocally conclude as our analysis only examines
Inefficient banks performed well, but not in a superior the impact of marketing spend at the highest level, but
manner. Even though the Inefficient banks invested a consider the following:
little more in marketing, Aggressive banks grew loans
and deposits during the tough time period, had net- • Among all banks that spent less than the industry
interest margin 8 basis points higher and had an efficiency average on marketing, 67 percent had lower-than-
ratio 6 percentage points lower on average. As a result, average incremental revenue growth (an unsurprising
Aggressive banks generated incremental revenue of result). However, 33 percent realized higher-than-
$17.26 per dollar spent on marketing while Inefficient average revenue growth (certainly a positive, and likely
banks only generated $0.53. an unanticipated, result for many).
• Among all banks that spent more than the industry
The overriding theme of our analysis is banks that manage average on marketing, 83 percent had lower-than-
their marketing dollars efficiently also manage other parts average incremental revenue growth. But only 17
of their businesses well. For example, Efficient banks not percent realized higher than average revenue growth.
only spend the least amount per branch on marketing Ouch! Eight in 10 of these marketing directors had to tell
but also spend the least amount per branch on salaries & their bosses they spent more aggressively on marketing,
benefits and occupancy & fixed assets. Aggressive banks but underperformed industry revenue growth.
spend significantly more per branch on marketing than
FIS STRATEGIC INSIGHTS • V 6 MARCH 2012 © 2012 FIS and/or its subsidiaries. All Rights Reserved.
4
- 5. The bottom line is that during 2009 – 2010 only one in six banks realized significant upside to higher-than-average levels
of marketing spend. Certainly the tough economy contributed to the overall poor performance of marketing dollars
during the time period, but also the legacy of “marketing to the masses” produces waste in marketing dollars, which
is hard to hide during downturns. While the prospects for growth in the U.S. economy and the banking industry are
certainly better in 2012, I believe the industry still faces a relatively moderate-growth scenario. Practicality and specificity
are the best policies for 2012 budgeting and forecasting in this environment. Some products, channels and segments
warrant increased marketing investment while others don’t. In any event, financial institutions will need to employ
analytics to improve targeting and, in turn, marketing efficiency.
The economy, the banking industry – and marketing itself – are undergoing a tremendous evolution. More than
ever, bank marketing professionals must focus on a comprehensive set of performance measures to understand the
efficiency and ROI of marketing programs and investments. Best practices organizations utilize dozens (if not hundreds)
of marketing metrics, but I believe there are about a dozen core metrics that rise above the rest and must be in every
marketing executive’s toolkit (see Figure 5).
Figure 5: Essential marketing metrics
Source: FIS, Forrester Research, Mark Jeffrey at Kellogg School of Management
New constraints, changed market conditions and a new media environment are affecting the performance of marketing
dollars. This analysis shows that the effectiveness of marketing dollars during the economic downturn was related to
how banks managed their overall expenses and resources, including marketing, more than the amount they spent on
marketing. As 2011 data becomes available, we will continue to analyze the impact of change and share our insights with
you. We look forward to your input.
1
Donald J. Mullineaux and Mark K. Pyles. “Bank Marketing Investments and Bank Performance.” Journal of Financial Economic Policy.
Vol. 2 No. 4, 2010
2
NM Incite (formerly Nielsen BuzzMetrics) October – December 2011
FIS STRATEGIC INSIGHTS • V 6 MARCH 2012 © 2012 FIS and/or its subsidiaries. All Rights Reserved.
5
- 6. Calming the EMV Storm
Interview with Bastian Knoppers
SENIOR VICE PRESIDENT, CARD PERSONALIZATION
What created the “EMV storm?”
Visa and MasterCard’s recent announcements about EMV cards and terminals include initiatives to:
1. Expand the Technology Innovation Program (TIP) to the U.S., which will eliminate
the requirement for eligible merchants to validate compliance with the Payment Card
Industry (PCI) Data Security Standard (DSS) for any year in which 75 percent or more of
the merchants’ Visa transactions are made at EMV-enabled terminals (terminals must
allow for contact and contactless payments),
2. Build processing infrastructure for EMV acceptance by April 1,
What is EMV?
2013, and
3. Shift counterfeit and fraud liability for EMV chip cards presented EMV is an open-standard set of specifications
to merchants without EMV terminals to the merchant’s acquirer by for smart card payments and acceptance
Oct. 1, 2015 (except for fuel sellers, which must meet requirements devices. The EMV specifications were
by Oct. 1, 2017). developed as requirements to ensure
interoperability between chip-based payment
cards and terminals. EMV chip cards contain
Because the business case, to date, hasn’t been strong enough to justify
embedded microprocessors that provide
its deployment, EMV adoption has been slow. However U.S. travelers
strong transaction security features and other
abroad have been inconvenienced − according to a study by Aite, nearly
application capabilities not possible with
half of U.S. cardholders have experienced problems with using their
traditional magnetic stripe cards. EMV stands
cards abroad.1 And, with more than one-third of the U.S. population for Europay, MasterCard, Visa, some of the
holding passports (37 percent according to the State Department), principal owners of EMVCo.
that amounts to plenty of inconvenience and potential lost revenue.
But the Aite study also points out that the issue of denied transactions What are the benefits of EMV?
overseas is very complicated and just adding a chip to the card will not
The biggest benefit of EMV for U.S. issuers
completely solve the problem.
is the potential reduction in card fraud
resulting from counterfeit, lost or stolen
Some believed that the Durbin Amendment would mandate EMV fraud cards. EMV also provides interoperability
protection in the U.S., but that requirement was absent from the final with the global payments infrastructure –
rules. While a few merchants − most notably Walmart − have started consumers with EMV chip payment cards
the roll-out of EMV terminals at POS to prepare to accept chip-and-PIN can use their cards on any EMV-compatible
cards, most retailers are reluctant to adopt new technologies that don’t payment terminal. EMV technology supports
show a quick payback on investment. enhanced cardholder verification methods
and, unlike magnetic stripe cards, EMV
But nothing stays the same. For a number of reasons, ranging from payment cards can also be used to secure
growing need for EMV to lay the groundwork for secure mobile payment online payment transactions.
to growing concern about more fraudsters taking up residence in the
U.S., EMV deployment is on the horizon. We discussed what EMV
deployment means for banks and credit unions with Bastian Knoppers.
The following provides a realistic view of what we can expect short- and
long-term and how financial institutions should prepare for EMV.
FIS STRATEGIC INSIGHTS • V 6 MARCH 2012 © 2012 FIS and/or its subsidiaries. All Rights Reserved.
6
- 7. Where has EMV been adopted? In August 2011, Visa announced Why has the rest of the world
Eighty countries are in various stages plans to accelerate chip migration adopted EMV and not the U.S.?
of EMV chip migration, including and adoption of mobile payments in Issuers outside of the U.S. are
Canada and countries in Europe, the U.S., through retailer incentives, including chips in bank cards and
Latin America and Asia. According processing infrastructure acceptance merchants are moving to EMV-
to EMVCo, approximately 1.3 billion requirements and counterfeit card compliant terminals to increase
EMV cards have been issued and 20.7 liability shift. security and reduce fraud resulting
million POS terminals accept EMV from counterfeit, lost or stolen cards.
cards as of Q3 2011. This represents In January 2012, MasterCard The rest of the world adopted a
42.4 percent of the total payment announced its U.S. road map to decentralized approach to combating
cards in circulation and 75.9 percent enable the next generation of card counterfeit and skimming fraud
of all POS terminals installed. electronic payments, with EMV the by adding security features to the
foundational technology. card and terminals so that transactions
The U.S. is one of the last countries could be approved off-line. The U.S.
to migrate to EMV. Both MasterCard Within the U.S., the contactless credit adopted a more centralized and
and Visa have announced their and debit (e.g. MasterCard/PayPass online approach to combating fraud,
plans for moving to an EMV-based and Visa/payWave) cards already so that adding chips to cards and
payments infrastructure in the U.S. being issued include some EMV terminals was not necessary.
security features.
Calming the storm around EMV
Why is there such a frenzy associated with EMV?
Bastian Knoppers: There is no reason to panic about EMV. The ‘tyranny of the urgent’ certainly is an appropriate way to
describe the EMV frenzy, and everyone just needs to take a deep breath and look at the facts. The reality is that there is
no mandate, such as exists in other countries such as Australia and to a certain extent in Canada. Visa and MasterCard’s
announcement is an incentive, not a mandate. Until issuers are convinced that EMV terminals will be deployed in significant
numbers, why start issuing EMV cards? The capability to process those transactions doesn’t yet exist, and the business case
justifying the issuance of EMV cards needs to be made.
We ought to pay close attention to the adoption period for EMV in Canada and Europe. The transition to EMV could easily
take seven, if not 10, years to occur. This has been the case in Canada (see Figure 1). Each country’s need for EMV differs.
The business case for adoption in the U.S. is very different from what it has been for France, Germany, Latin American or
even Canada.
Figure 1: Canadian EMV Migration Milestones
Source: The National Club, Toronto. “Mobile, Debit, and Coming Crisis.” December 16, 2010
FIS STRATEGIC INSIGHTS • V 6 MARCH 2012 © 2012 FIS and/or its subsidiaries. All Rights Reserved.
7
- 8. Another myth is that EMV is easy and quick – we just grab As demand increases for mobile payment in the U.S.,
a card off the shelf and away we go. EMV represents a more pressure will be brought to bear on deploying
fundamental change in both technology and in payment EMV to boost security around mobile payments. In
processing in terms of how PINs are used. It also has the Visa’s announcement they clearly link EMV with NFC-
potential to allow for off-line transactions. Whatever its enabled terminals. At FIS, we are looking at over-the-air
form, future deployment of EMV will require significant personalization for smartphones so the same data that’s on
analysis and planning. the EMV card in the chip would be replicated in the chip on
the smartphone. The data needs to be transferred securely
Planning for EMV Deployment and quickly.
What will ultimately drive EMV issuance in the U.S.? Another factor that will impact the rate of EMV deployment
Bastian Knoppers: There is a long- and short-term answer. is clarity around technology solutions. For example, Visa
has announced that its U.S. interface will be both contact
Long Term: Terminals and cards are akin to chickens and and contactless technologies. That’s very different from
eggs – both are necessary to make EMV work, but which the European technology, which is a contact only card
comes first? The issuance of cards needs to be aligned with that’s inserted into a terminal and held there during the
terminal deployment. transaction. The Visa dual interface card is more expensive.
Ultimately EMV deployment will be driven not by the
Merchants will have a large impact on EMV deployment. It’s technology, but by the business cases among various
important to watch Walmart and listen to what the National stakeholders, including merchants and issuers.
Retail Federation is saying about EMV. Both are on record
as being strong proponents of EMV. I think Walmart is a Short term?
proponent of chip-and-PIN EMV because of the impact Bastian Knoppers: The most immediate concern is for
of what Walmart would pay the issuer for that type of financial institutions to be able to serve their customers
transaction. Their terminals are EMV-enabled, but not yet traveling outside the U.S. Some specific financial
deployed for EMV transactions. institutions, such as credit unions that serve the military or
airlines have the most immediate need for EMV.
We will be examining how serious the movement is toward
EMV. One way to determine conversion and movement is Although some travelers’ transactions are being denied,
to track statistics on EMV terminal shipments. You would you need to look at the circumstances around why their
want to know if there will be enough demand for EMV in cards aren’t working and determine whether an EMV card
2015 to begin planning cardholder migration to chip for will solve the problem. For example, the inability to make
the next 2 – 3 years. If there is, then you will need to work off-line transactions at places such as transit stations,
EMV into your card re-issuing plans. You need to build the parking lots and vending machines is a common problem in
business case for EMV and then put together a timeline, some countries. Those terminals are set up to accept only
which aligns with terminal deployment. chip-and-PIN enabled EMV cards.
Another key driver in deployment will be fraud Short term, you need to do the business case around
consideration. FIs need to build a business case around your traveling customers. You need to find out how bad
EMV as a fraud reduction technology. FIs need to weigh the problem is for them and determine the financial
the cost of adopting EMV against the potential reduction implications of providing solutions to them.
in fraud. Confounding that comparison is the likelihood
of more fraud moving to the U.S. as the weakest link for The good news is that if an FI wants or needs an immediate
fraudsters due to the vulnerability of the magnetic stripe vs. solution, our Prepaid team offers an EMV Travel card today.
EMV. As I’ve talked with Canadian issuers of EMV, they’ve
told me that they are seeing a reduction in fraud but until
the magnetic stripe technology is eliminated from cards,
the full benefit of fraud reduction cannot be realized.
FIS STRATEGIC INSIGHTS • V 6 MARCH 2012 © 2012 FIS and/or its subsidiaries. All Rights Reserved.
8
- 9. What are the cost implications for banks and credit unions?
Bastian Knoppers: Frankly, the investment and budgetary impact will be significant. If you look at what the small Canadian
FIs have spent, it amounted to a sizeable budgetary item, in some cases, hundreds of thousands of dollars. Most people
only think about the cost difference between the EMV card and the magnetic stripe card, but the cost per card is only a
fraction of the total expense. The fixed costs can be quite high. There are upfront costs for development, platform costs
and costs associated with educating your customers, as well as your employees. At FIS, we’re working on solutions to make
those costs more affordable for our clients, but EMV is going to be an expensive proposition for which FIs need to budget.
EMV Opportunities
What are the opportunities for banks?
Bastian Knoppers: Besides the potential for reducing fraud, EMV has other possibilities that could be very beneficial. Being
able to conduct off-line transactions at terminals, which historically have accepted cash payment, could benefit issuers. Also,
EMV is becoming the transaction technology of choice for mobile payments. That’s why Visa is linking EMV and NFC. It’s a
more secure technology. Finally, there are many possibilities to tie the card into loyalty, and multiple applications to make it
more useful to the consumer, thereby improving cardholder retention.
Where do we go from here?
Bastian Knoppers: There is a tremendous amount of EMV planning and work going on behind the scenes at FIS on an
enterprise-wide level. FIS is well-prepared and positioned to help our clients do the analysis and planning needed to make
the right decisions for EMV deployment. We are fully leveraging our international experience with EMV in both Europe and
Canada to help us in this planning.
FIS’ Everlink Payment Services in Canada has been involved with EMV for more than seven years and has advised many
credit union and banking clients in various stages of EMV chip migration. They have assisted in scheduling, planning and
implementing chip migration programs. We have leveraged their expertise and experience for our U.S. clients and will
continue to do so.
Both InfoShare 2012 and FIS Client Conference 2012 this year will include a lot of updates and Buzz Sessions regarding
EMV. Those will be followed by EMV webinars and EMV updates on the FIS web site.
1
Aite. “The Broken Promise of Pay Anywhere, Anytime: The Experience of the U.S. Cardholder Abroad.” October 2009
FIS STRATEGIC INSIGHTS • V 6 MARCH 2012 © 2012 FIS and/or its subsidiaries. All Rights Reserved.
9
- 10. Dissecting the Credit Union Member Base
By Paul McAdam
SENIOR VICE PRESIDENT, RESEARCH AND THOUGHT LEADERSHIP
In my January 2012 article, I talked about how community banks face challenges in their retail
banking franchises mostly because the community bank customer base is older and has less
income and future earning potential. The affluence gap between the community bank customer
and the average bank customer results in community bank customers holding lower-than-
average investable assets and loans overall, with correspondingly less opportunity. This month’s
article applies the same analysis to credit unions to examine the influence of demographics
on both the composition and the financial behaviors of credit union members. In particular, I’ll
explore the distinctions between credit union members and community bank customers. All
analysis cited in this article is generated from primary research of 3,345 consumers conducted
by FIS in August 2011.
There are several significant differences in the clientele of credit unions and community banks. The first lies in the
geographic concentration of customers. My last article highlighted that within rural and small towns (population less than
50,000) consumers are three times more likely to identify a community bank as their primary checking account provider.
This level of small town concentration does not exist within the credit union member base (see Figure 1). Whereas
community banks’ customers are more likely to reside in rural/small towns and less likely to reside in midsized/large
metro markets, the distribution of credit union members is relatively proportionate across all three markets. Thus, credit
unions are less likely to face the challenges associated with customer bases disproportionately drawn from smaller, low-
growth markets.
In terms of demographics, my last article
described how community bank customers Figure 1: Relative to credit union members, community bank customers
are more concentrated in rural and smaller towns
tend to be older, are less likely to be employed
(i.e., a higher portion are retired), and have
less education on average. The credit union
industry benefits from a member base that is
demographically broader and much more likely to
look like the typical U.S. resident in terms of age,
employment status and education.
In terms of customer age, credit unions
attract somewhat lower percentages of Gen
Y consumers, but all other generations’
proportions are consistent with national averages
(see Figure 2). Conversely, our prior analysis
*Read as: Within rural and small towns consumers are 3 times more likely to bank with a community bank
demonstrated a clear trend of community (index = 319).
banks being underrepresented in younger and Source: FIS primary consumer research, August 2011; n = 3,345
overrepresented in older consumer segments.
FIS STRATEGIC INSIGHTS • V 6 MARCH 2012 © 2012 FIS and/or its subsidiaries. All Rights Reserved.
10
- 11. These patterns in the geographic and Figure 2: The credit union member base is underrepresented in GenY,
generational differences of consumers who but is otherwise consistent with national norms
bank with a community bank vs. a credit union
influence other notable observations. Credit union
members are:
• Just as likely as the national average to be
employed while community bank customers
are 46 percent more likely than credit union
members to be either retired or not working;
• Sixteen percent more likely than community
bank customers to have a college or post
graduate degree;
• Twenty-three percent less likely than
community bank customers to possess only a *Read as: Community bank customers are 21% less likely to be members of Generation Y (index score = 79).
high school degree or less; Source: FIS primary consumer research, August 2011; n = 3,345
• Fourteen percent more likely than community
bank customers to be single;
• Fifty-six percent more likely than community
bank customers to be students Figure 3: Credit unions capture lower deposit, investment and loan
balances than community and large banks
As a result of credit union members resembling
national norms in terms of geographic location
and key demographic characteristics, they
reported average household income that was
statistically equivalent to the norm of a little more
than $60,000 in our research. Community bank
customers reported average household incomes
about 15 percent ($9,000) lower.
But despite their advantage of having clientele
with higher incomes, credit unions capture lower
deposit and loan balances from their members
than community banks capture from their *Read as: Consumers who identified a community bank as their primary checking account provider hold an
customers (see Figure 3). Among members who average of $32,240 in deposit and investment balances with the bank.
Source: FIS primary consumer research, August 2011; n = 3,345
have their primary checking account relationship
with a credit union, they hold an average of
$30,300 in deposit and investment balances and
$13,400 in loan balances with the institution. Community The lower loan balances captured by credit unions are
banks capture an average of $32,200 in deposit and the result of them having a higher proportion of total
investment balances and $16,300 in loan balances with loan balances in auto loans and credit cards. Community
their primary checking account provider. banks lag credit unions in these two types of lending, but
do a better job of capturing higher balance residential
Community banks top credit unions in deposit and mortgage and home equity loans.
investment balances primarily because community banks
have an older customer base on average (older customers
tend to hold greater deposit balances). Community banks
also capture a larger share of investment products and
balances from their customers relative to credit unions.
FIS STRATEGIC INSIGHTS • V 6 MARCH 2012 © 2012 FIS and/or its subsidiaries. All Rights Reserved.
11
- 12. Of significant note, community banks perform
Figure 4: Credit unions and community banks experience higher levels
better than credit unions in capturing small of customer loyalty
business relationships. In our survey, 9.1 percent
of consumers who held their primary checking
relationship with a community bank identified
themselves as self-employed or a small business
owner. Only 5.7 percent of consumers who held
their primary checking relationship with a credit
union identified themselves as such. There are a
couple reasons for this. Credit union members are
younger than community bank customers (younger
people are less likely to own a small business).
In addition, many credit union members belong
to company-sponsored credit unions. Thus a
large portion of the credit union member base is
naturally less likely to be self-employed. *Read as: 55% of credit union members are loyal to the institution
Source: FIS primary consumer research, August 2011; n = 3,345
Higher small business penetration is a key
advantage to community banks as small business
owners generally intermingle their personal and business banking accounts. And according to a national survey of more
than 2,200 small businesses that FIS conducted in November 2010, the typical small business with $5 million in annual
revenue utilizes 1.9 deposit services, 3.4 payment and cash management services, and 3.5 secured and unsecured credit
services. Credit unions will surely continue to attack this bank advantage over time through greater outreach to small
businesses and industry lobbying efforts to raise their regulatory cap on business lending above the current threshold of
12.25 percent of total assets.
Finally, both credit unions and community banks benefit from considerably higher customer loyalty than larger banking
institutions. Our research scored consumers’ loyalty to their primary checking account provider based on several factors
including trust in the institution, willingness to recommend, willingness to repeat purchase, wallet share, willingness to
switch and identification with the institution’s brand values. Fifty-five percent of credit union members are loyal compared
to 54 percent of community bank customers (dead even given our survey’s margin of error). Both have significantly more
loyalty customers than the 47 percent noted for regional banks and 39 percent for large banks.
While credit unions and community banks have unique legacies and certainly distinct operating models, both types of
institutions benefit from high customer loyalty and this bodes well for their ability to gain additional customer wallet share.
In next month’s article I will round out this series by examining the customer bases of large banks. I’ll continue to explore
themes of community bank and credit union competitiveness in future newsletter editions. In the meantime, feel free to
contact me at paul.mcadam@fisglobal.com with your questions or comments.
This article is derived from recent research with 3,000 FI customers on elements that drive customer loyalty. Achieving Profitable Customer Loyalty, a
research brief based on findings from this research can be accessed through http://www.fisglobal.com/solutions-insights.
FIS STRATEGIC INSIGHTS • V 6 MARCH 2012 © 2012 FIS and/or its subsidiaries. All Rights Reserved.
12
- 13. Attracting and Retaining Gen Y and Gen X
By Mandy Putnam
DIRECTOR, RESEARCH AND THOUGHT LEADERSHIP
Generations often hold common values shaped by shared experiences during their key
developmental years. Social media allows experiences and attitudes to be widely, and nearly
instantly, shared. The collective discontent with the status quo among youth – spawned by
the Great Recession and manifested in movements such Occupy Wall Street, Occupy spinoffs
and Bank Transfer Day – could change how and where up-and-coming generations handle
their finances.
Our research with 3,000 consumers with primary checking accounts shows that the least loyal
generations are Gen Y and Gen X – the latter of which is entering peak spending years and is
a prime target for loans. Given younger generations’ current low levels of loyalty and discontent with the status quo,
traditional financial institutions will be challenged to attract and retain these customers.
Electronic Access Is Cost of Entry Figure 1: Younger generations tend to bank with large
national institutions
The type of financial institution where customers
have their primary checking accounts differs among
generations (Figure 1). Younger generations are more
likely to patronize large national banks or savings
institutions instead of regional and community banks.
Geography accounts for some of the difference in
where younger generations bank but, as discussed
in “Overcoming the Demographic Disadvantages of
Community Banking” (January 2012), residence doesn’t
tell the whole story.
One reason younger generations patronize large
national FIs is that they offer more sophisticated
online and mobile banking services. Another is more
convenient access to ATMs. In looking at the factors Source: FIS primary consumer research, August 2011. n = 3,000
that drive bank choice across generations, there are Gen Y = born 1980 – 1993; Gen X = born 1965 – 1979; Younger Boomers = born
1946 – 1954; Older Boomers = 1946 – 1954; Mature = born prior to 1946
only a few differences in how each generation ranks
various factors. For example, free services and branches
at convenient locations are first- and second- ranked respectively by all generations as being most influential in FI
choice. However, the third-ranked choice differs between younger and older generations. Online or mobile banking
is an influential factor for about a quarter of younger generations, but only 18 percent of Older Boomers or Matures.
Conveniently-located ATMs also are less important to older customers. Among Gen Y customers, word-of-mouth
recommendations are fifth-ranked while other segments place more importance on the reputation of the institution. Gen
Y is more likely to pay attention to what their friends are saying, texting or perhaps entering on their Facebook page
about the financial institution than what the FI is saying about itself.
Gen Y differs from other segments in the way they want to find out about new products and services. Unlike Boomers
and Mature generation members, Gen Y prefers to receive communications via the bank’s online banking site (after
login), e-mail to their computers or the bank’s web site more than by “snail mail.” Gen Y also is more receptive than
others to communications via the bank’s ATM machines or their mobile phones.
FIS STRATEGIC INSIGHTS • V 6 MARCH 2012 © 2012 FIS and/or its subsidiaries. All Rights Reserved.
13
- 14. Figure 2: Younger generations have few asset accounts Four out of 10 Gen Y Members Have
beyond their DDA and savings account Student Loan Debt
On the asset side of their ledgers, Gen Y and Gen X
are more likely to have savings accounts than older
generations but only because they are less likely to have
money market accounts and certificates of deposit (Figure
2). As consumers shift into their nesting lifestage (Gen
X), the percentages of 401(k) and educational savings
increase but the penetrations of other investments do
not rise significantly until later (Younger Boomer or Older
Boomer) lifestages.
The effect of not having very many deposit and
investment accounts is that Gen Y members’ accounts are
more likely concentrated with their primary providers. This
concentration of assets could offer the primary providers
Source: FIS primary research, August 2011. n = 3,000 an opportunity to build a “stickier” relationship with
Gen Y members as they evolve into their nest-building
lifestage when they will need additional credit to finance
Figure 3: Younger generations have loans and credit card debt houses, cars and babies.
Loans among Gen Y are most commonly student loans
and credit card debit (Figure 3). While an above-average
percentage of Gen X members (28 percent) still has
student loans, Gen X is taking on more debt in the form
of credit card debt balances, mortgages and auto loans.
Home equity loan/line of credit penetration increases
with age while most other debt declines. The exception
is the increase in credit card balances among the Mature
generation compared with Boomer generations, which
could reflect the impact of tough economic times
upon retirees.
Source: FIS primary research, August 2011. n = 3,000
Young Generations Are Likely to Switch
Gen Y and Gen X are not as loyal to their primary FIs
Figure 4: Younger generations are not as loyal to their primary
DDA FI as Boomer or Mature generations (Figure 4). Attitudes
about switching financial institutions reveal that Gen Y is
particularly vulnerable to changing their FIs especially if
they feel they’ve been overcharged. They also are more
receptive to switching if incentivized by better interest
rates, appealing loyalty programs or better online and
mobile banking services. Gen Y and Gen X may have
a legitimate reason for lack of loyalty considering that
larger percentages of them (32 percent and 27 percent
respectively) pay fees than other generations. With age,
consumers are less likely to pay fees. Only 14 percent of
the Mature generation pays fees.
Source: FIS primary research, August 2011. n = 3,000
FIS STRATEGIC INSIGHTS • V 6 MARCH 2012 © 2012 FIS and/or its subsidiaries. All Rights Reserved.
14
- 15. Younger Generations Expect Rewards
What attracts and potentially retains younger generations differs from what motivates older generations. The greatest
difference in attitudes occurs between the younger two generations (Gen Y and Gen X) and the Boomer generations
(Younger Boomers and Older Boomers). Another significant shift in attitudes occurs between the Boomer and the
Mature generations:
• Younger generations are much less likely to view switching their primary checking account provider as a hassle. If an
alternative financial service offers a valuable benefit, they will likely switch.
• One reason why younger generations are more prone to switching is that fewer of them view their primary
DDA providers as trustworthy. The majority of consumers still trust their banks, but the majority for Gen Y only equals
61 percent vs. the majority of 85 percent for the Mature segment.
• Younger generations are much more willing to trade in-person service for saving money. This reinforces the rationale
for “self-service banking” packages.
• Younger generations place more value on
rewards programs than older generations.
Figure 5: Younger generations participate in rewards programs
Loyalty rewards are part of the currency used
by younger generations to obtain things they
want. Having grown up with a plethora of
retailers using loyalty programs to gain entree
into their wallets, young people expect rewards.
Participation rates in loyalty programs offered
by their primary DDA FIs are highest among the
youngest generations and drop off significantly
with age (Figure 5). When asked which types of
rewards they value most, all generations rated
cash-back rewards at the top of the list followed
by points to redeem for gift cards. Four out of
five Gen Y and Gen X members vs. three out of
four members of Boomer generations and six
out of 10 Mature generation members expressed
interest in rewards. Source: FIS primary research, August 2011. n = 3,000
Final Thought
Although many young people are struggling financially and don’t fit the definition of the “ideal” target customer today,
the scales tip in their favor long term. The cost of switching financial institutions – or even opting out of banking with
a traditional financial institution – is relatively low for younger generations, especially Gen Y. In contrast, the cost to FIs
of not engaging customers early in their lifestages could be high in the long run as alternatives to traditional financial
institutions are increasingly accessed by mainstream consumers and disenchanted youth.
This article is derived from recent research with 3,000 FI customers on elements that drive customer loyalty. Achieving Profitable Customer Loyalty, a
research brief based on findings from this research can be accessed through http://www.fisglobal.com/solutions-insights.
FIS STRATEGIC INSIGHTS • V 6 MARCH 2012 © 2012 FIS and/or its subsidiaries. All Rights Reserved.
15
- 16. Strategic Insights is a newsletter that provides research, thought leadership and strategic commentary on recent events in
banking and payments. The newsletter is produced by the Global Marketing and Communications team at FIS. FIS is one
of the world’s top-ranked technology providers to the banking industry. With more than 30,000 experts in 100 countries,
FIS delivers the most comprehensive range of solutions for the broadest range of financial markets, all with a singular focus:
helping you succeed.
If you have questions or comments regarding Strategic Insights, please contact Paul McAdam, SVP, Research & Thought
Leadership at 708.449.7743 or paul.mcadam@fisglobal.com.
FIS STRATEGIC INSIGHTS • V 6 MARCH 2012 © 2012 FIS and/or its subsidiaries. All Rights Reserved.
16