Glimpse of clinical radiobiology course
•
86 likes•5,486 views

This contains some of the slides of the clinical radiobiology course conducted in Shimla

Recommended
More Related Content
What's hot
What's hot (20)
Viewers also liked
Viewers also liked (20)
Similar to Glimpse of clinical radiobiology course
Similar to Glimpse of clinical radiobiology course (20)
Recently uploaded
Recently uploaded (20)
Glimpse of clinical radiobiology course
- 1. Glimpse of Clinical Radiobiology Teaching Course Prof Manoj Gupta Indira Gandhi Medical College, Shimla
- 2. Ionizing Radiation • Ionizing Radiation is capable of producing ion pairs by interaction with matter. • Two Types. –Electromagnetic Radiation eg. X-rays and g-rays –Particulate Radiation eg. Electron, Proton, Neutron, charged Nuclei, a-particles. • Important biologically since ionization is the property which bring death to a cell.
- 3. Incidence Beam Exit Beam Radiation and Matter •When Radiation passes through matter, the exit beam has lower intensity than the incident beam. Scattering Absorption Attenuation Detector
- 4. Attenuation • Depends upon: – Thickness of the Material a T – a Atomic Number of the material through which it passes – a Density of the material – Inversely proportional to the energy of the photons (1/E) Attenuation is an EXPONENTIAL function of the thickness of the matter.
- 5. 1 cm 1 cm 1 cm 1 cm 100 -10 = 90 rad 90-09=81rad 81-8.1=72.9rad 72.9-10% Exponential Attenuation Addition of the same thickness of the material will reduce the intensity by same fraction and not by same number. This is called exponential relationship. 10% 10% 10% 10% 100 Rad
- 7. Photoelectric absorption Occurs with bound electrons Photon disappear completely and part of its energy is utilized to dislodge the bound electron and rest is given to dislodged electron as kinetic energy. Photon Energy = Binding energy + KE Eg. 100kv = 40 kv + 60kv Bound Electron
- 8. Differential absorption in body • a Z3 (Atomic Number) • Bones are more likely to absorb radiation – This is why they appear white on the film • Soft tissue absorbs less than bone – These structures will appear gray on the film • Air-containing structures such as lungs absorbs least. – These structures will appear black on the film Diagnostic Radiology a 1/E3 ( Energy of the photon) Low Energy X-rays are used in Diagnostic Radiology (KEV)
- 9. Therapeutic Radiology • This interaction is unsuitable for radiotherapy as differential absorption will results into more radiation dose to bones as compare to other tissues and bone exert a shielding effect which will results into more osteo-necrosis and less dose to tumor present behind the bone because of shielding effect.
- 10. Pteris longifolia (fern spore) – Raymond E. Zircle Eccentric nucleus Cytoplasm Germination Aluminum foil Polonium α -particle WITH SMALL DOSES OF RADIATION TO THE NUCLEUS •Inhibition of germination •Chlorophyll development •Cracking of spore coats Journal of Cellular and Comparative Physiology Volume 2, Issue 3, pages 251–274, December 1932 Aluminum Foil
- 11. Repair How Radiation Injury is manifested No effect Lethal Damage Cell Death Few days to wks Few cells killed : Organism will heal & survives More cells killed: Organism may be survived with prolonged symptoms Large no. cells killed: Organism will perish Mis-Repair Mutation Somatic Cancer Few Years Germ cell Genetic defect Generation
- 12. What is a cell survival curve? • A cell survival curve is a graphical representation of the fraction of cells surviving a given dose of radiation • This graph is obtained by plotting the dose along the linear x-axis and the surviving fraction along the logarithmic y-axis Linear X-Axis Logarithmic Y-Axis
- 13. Steeper the slope, higher the sensitivity and vice versa Do Remember:- 2. Slope of the curve represent the radiation sensitivity .20 .70 .05 .30
- 14. D10 is the dose required to reduce the survival fraction to 10% = e-1 D0 is the dose required to reduce the survival fraction to 37% = e-1 2D0 is the dose required to reduce the survival fraction to two exponential reduction i.e. 2D0 = e-2 (37% x 37%) =(.37 x .37) 3D0 = e-3 (.37 x .37 x .37) SF = e-D/D0 Total dose of Radiation dose which reduces the survival fraction to 37% The D0 Dose
- 15. SF = e-D/D0 If D = D0 SF = e-D0/D0 = e-1 If D = 2D0 SF = e-2D0/D0 = e-2 If D = 3D0 SF = e-3D0/D0 = e-3 The D0 Dose Total dose of Radiation dose which reduces the survival fraction to 37%
- 16. Dose SF 1 .1 .01 .001 .0001 D 10 D 10 D 10 D 10 D 10 D 10 D 10 D 10 D 10 D 10 Graphical Representation showing SF is an exponential function of the Dose of Radiation e-1 e-2 e-3 e-4 Remember “If cell survival curve is a straight line on semi-log graph, then it represent a exponential relationship. A Curvy cell survival curve reflects that it is not a exponential relationship”
- 17. Dose SF B Initial portion is continuously bending at low dose region till it reaches at point B. Mammalian Cell Survival Curve1 .1 .01 .001 .0001 At higher dose region the curve becomes a straight line. Not Exponential Exponential
- 18. • Each cell contain more than one target (may be assumed n number of target and n may be any number more than one) • In order to bring cell death by radiation, all the target should be deactivated. • If n-1 targets are hit then cell survives. • There are two type of cell killing taking place simultaneously to inactivate n target resulting into cell death. – Cell kill by single hit event (SHE) – Cell kill by multiple hit event (MHE) Low Dose Region High Dose Region Multi Target Model
- 19. SF Dose Multi Target Model As dose increases the probability of deactivation of n target by MHE also increases and MHE also start contributing in total cell kill. The curve keeps bending with increasing dose as contribution in cell kill by MHE keeps increasing Low Dose High Dose
- 20. Dose(GY) SF 1 .1 .01 .001 .0001 Single hit kill or Linear Cell kill or Alpha cell kill seen in low dose region Effect = aD SF = e - aD 1 2 3 4 5 6 7 8 9 10 11 12 13 14 Shoulder Effect a D This term represent the probability of inactivating two strands of DNA by single radiation event. Linear Quadratic model (LQ Model) Linear Kill
- 21. Less curvy or small shoulder or less repair capacity More curvy or Broad shoulder or large repair capacity Early Reacting Tissue or Tumor Late Reacting Tissue or Tumor Cell Survival Curve of Early and Late Reacting Tissues SF Dose
- 22. • Fraction size (Dose per fraction) • Turnover (proliferative status) • Overall treatment time. • Organization of functional subunit in the organ.
- 23. Recovery from Radiation Injury in Spinal Cord • Spinal Cord remember the irradiated dose. • With time cord start forgetting the irradiated dose. How much dose is remembered, depends upon the RT Dose delivered to spinal cord during first treatment. Time of Re-irradiation
- 25. Concomitant boost: 30 x 1.8Gy in 6 weeks, 5 days per week Total dose = 54Gy 12 x 1.5 Gy in 2 and ½ week Total dose = 18Gy Total Dose to the tumor will be 54 + 18 = 72 Gy in 6 weeks.
- 26. Increase in cell cycle time Less proliferation Less repopulation
- 27. No difference 10% difference Chemo-Radiation Conventional RT British Columbia Study DHANCA Trial 10-12% difference IAEA Trial 12% difference 12% difference Hypothesis
- 28. Radiobiology of SRS/SBRTNon Fractionated RT 20 Gy to 60 Gy given in single fraction or 2-5 fractions Benign and Malignant Diseases
- 29. PTV CTV GTV Normal Tissue Red Shell Serial critical structures Inner Red shell Outer Red shell Dip because of careful planning bulge
- 30. New Biology of High dose RT • Vascular/ Stromal damage at high dose. • Stem Cell death at high dose.
- 31. “Double Trouble” Prescribed Dose to spinal cord 25 fractions of 2Gy = 50Gy Hot spot: 110% Physical dose: 55Gy Dose per fx = 2.2 Gy Biological dose: 60.5Gy
- 32. Factors affecting the cell survival curves • Fractionation • Oxygen • Cell Cycle • Type of Radiation (high LET or Low LET) • Type of cells • Type of species
- 33. 100 cells 100 cells 100 cells 10 Colonies 12 Colonies 14 Colonies 200 cGy 100 cGy 100 cGy 66.6 cGy 66.6 cGy 66.6cGy Total Dose = Same Interval between fraction = Same No of fraction = different As the no of fraction is increased the colony counted also increases Repair of sub-lethal damage takes place between fractions Had there been no repair of damage, the total dose would have resulted into same cell kill irrespective of fractions Repair of sub lethal damages
- 34. Fractionated RT Single Fx Multiple Fx Shallower Less Sensitivity Radiation less effective SLDR
- 35. 10 Fx 20 Fx 30 Fx Therapeutic Advantage Low a/b (Spinal Cord) Low a/b (Spinal Cord) Low a/b (Spinal Cord) High a/b (Tumor) High a/b (Tumor) High a/b (Tumor) As number of fraction increases, the gap between two curve also increases. So total dose of radiation will be more damaging to the tumor than to the normal tissues Fractionation is the most effective measures to increase the therapeutic ratio.
- 36. Dose Rate Effect SF Dose As No of Fraction Increases, Dose per Fc decreases SHE(a) MHE(b) SHE(a) increases MHE(b) decreases All cell Kill SHE(a) No contribution by MHE(b)
- 37. The effect of oxygen is seen more in terminal portion of the curve and less in shoulder region. Or we can say that oxygen effect is seen more in high dose region than low dose region. Effect of Oxygen on cell survival curve SF Dose Oxic hypoxic Low Dose Region High Dose Region Why ??
- 38. Mechanism of Reoxygenation 1. Reduction in ratio of total tumor cells to the surface area of blood vessels. for example if there are 10 capillaries supplying to 100 tumor cells the ratio of tumor cells to capillary is 10 which mean one capillary supplying 10 cells. After RT, 80 cells survived then ratio becomes 8 so now one capillary supplying to 8 cells
- 39. Intrinsic Radiation Sensitivity • Can be determined by SF2(survival fraction at 2 Gy). • SF2 is defined as the probability of cells surviving to single dose of 2 Gy, commonly used fraction size in clinical practice. • Typically for carcinoma the SF2 is 50% (0.5).
- 40. 4 Rs of Radiobiology 1. Re-oxygenation 2. Redistribution or Re-assortment 3. Repopulation Or Regeneration 4. Repair of Sub-lethal damage 5. Repair of Potential Lethal Damage Therapeutic Gain = Outcome of treatment(Tumor cell Kill) Toxicity of treatment Forms the basis of fractionated radiotherapy
- 41. Therapeutic Ratio Tumor Control Probability (TCP) Normal Tissue Complication Probability (NTCP)
- 42. Question • A patient has 1 cm3 tumor on his right tonsil. How much dose of radiation in 2 Gy per fraction is to be delivered to achieve a 90% tumor control probability(TCP)?
- 43. Microscopic Disease in Nodes • How much dose to be given to clinically negative neck nodes in head and neck cancer patients to achieve a 90% TCP in neck?
- 44. TCP for micros-metastasis in nodes Common clinical Situation eg. Head and neck ca 100 patients of head and neck cancer with clinical negative neck but high probability of microscopic disease in neck nodes because of high risk featured primary disease treated with radiation. 15% fails in neck. Why??
- 45. 50 Gy 60 Gy Radiation Dose to Different zones Why?
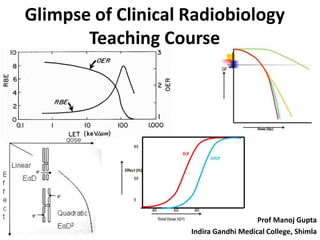
- 46. Linear Energy Transfer (LET) Relative-biological Effectiveness (RBE)
- 47. Relative Biological Effectiveness (RBE) • The National Bureau of Standards in 1954 defined relative biologic effectiveness (RBE) as follows: RBE D250 Dr = Dose of X-rays Dose of test radiation Required to achieve the same biological effect
- 48. Relation between RBE and LET RBE 5 10 100 LET(kev/mm) Slow increase in RBE This kind of relationship can be explained by over kill effect.
- 49. Introduction of the course • This course is divided into 5 modules. • Specially designed for post graduate students of Radiation Oncology and young radiation oncologists. • It is an one day (8 hours) program. • All the important principles of radiobiology with their clinical applications are covered
- 50. Introduction of the course • “How a radiation oncologist looks at radiobiology and how the principles can be applied in day to day clinical practice” is mainly emphasized. • Lot of animations and special effects have been created to make the subject simple. • Some of the slides from different modules have been uploaded to give the readers an idea.
- 51. Introduction of the course • All the five modules are taught by me only. • Conduct this course once a year in my center. • Also conducting at various other parts of the country as and when invited. • Address – Dr Manoj Gupta, Professor, Radiation Oncology Regional Cancer Center, Indira Gandhi Medical College, Shimla 9HP)-171001 India – Mob: +91-9418470607, 9816137344 – Email: mkgupta62@yahoo.co.in
Editor's Notes
- The difference in cell survival curve for two type of tissue is mainly due to difference in shape of shoulder seen in low dose region
- PTV is for various uncertainities and consist of normal tissues only so uncertainities are minimized by IGRT and 4D treatment planning as in ca lung. All the normal tissues around the tumor receiving rad dose higher than the tolerance limit is called red shell. The outer red shell thickness is kept min by rapid fall off doses outside the target by careful planning
- Loss of Autocrine Paracrine Growth factor as a result of massive destruction of the tumor cells by high dose of RT. Bystander effect result into death of un irradiated cells through signaling from irradiated cells Autocrin-paracrine loop has been established with NSCLC Loss of this factor deny the remaining cell to grow and they are killed Bystander effect seen upto few mm away from tumor, for microscopic disease