CIO Economic Cycle

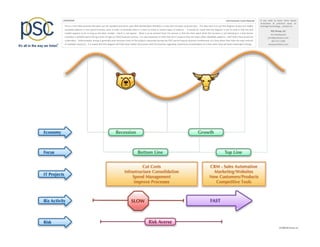
This is a nice little pictorial that plots out the standard economic cycle (Bull Market/Bear Market) in a way that has been received well. The idea here is to use this diagram to plot out readily accepted patterns in the typical business cycle in order to illustrate when it is best to invest in certain types of projects. It should be noted that the diagram Is not to scale in that the Bull market appears to be as long as the Bear market – which is not typical. What is to be learned from this picture is that the time spent while the business is not behaving in a Risk Averse mentality is ALWAYS spent during a time of high (or FAST) business activity. It is also important to note that the IT projects that are listed reflect DEMAND patterns – NOT when they should be undertaken. Unfortunately, timing is generally poor because many of the projects requested during the FAST period require business involvement at a time when they have the least amount of available resources. It is hoped that this diagram will help foster better discussions with the business regarding investment considerations at a time when they will yield meaningful change.

Recommended
More Related Content
More from Jim Vaselopulos
More from Jim Vaselopulos (9)
Recently uploaded
Recently uploaded (20)
CIO Economic Cycle
- 1. OVERVIEW CIO Economic Cycle Pictorial If you wish to learn more about innovaDve & pracDcal ways to This is a nice li+le pictorial that plots out the standard economic cycle (Bull Market/Bear Market) in a way that has been received well. The idea here is to use this diagram to plot out readily leverage technology -‐ contact us: accepted pa+erns in the typical business cycle in order to illustrate when it is best to invest in certain types of projects. It should be noted that the diagram Is not to scale in that the Bull PSC Group, LLC market appears to be as long as the Bear market – which is not typical. What is to be learned from this picture is that the Dme spent while the business is not behaving in a Risk Averse Jim Vaselopulos mentality is ALWAYS spent during a Dme of high (or FAST) business acDvity. It is also important to note that the IT projects that are listed reflect DEMAND pa+erns – NOT when they should be jimv@psclistens.com undertaken. Unfortunately, Dming is generally poor because many of the projects requested during the FAST period require business involvement at a Dme when they have the least amount 847.517.7200 of available resources. It is hoped that this diagram will help foster be+er discussions with the business regarding investment consideraDons at a Dme when they will yield meaningful change. www.psclistens.com © 2009 PSC Group, LLC