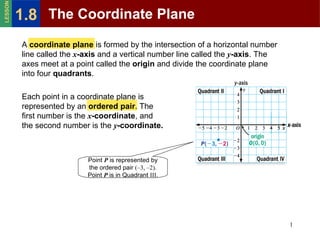
1. A coordinate plane is formed by the intersection of a horizontal number line called the x -axis and a vertical number line called the y -axis . The axes meet at a point called the origin and divide the coordinate plane into four quadrants . Each point in a coordinate plane is represented by an ordered pair . The first number is the x -coordinate , and the second number is the y -coordinate. Point P is represented by the ordered pair (–3, –2) . Point P is in Quadrant III . The Coordinate Plane 1.8 LESSON
2. Naming Points in a Coordinate Plane SOLUTION Give the coordinates of the point. A Point A is 2 units to the right of the origin and 4 units down. The x -coordinate is 2 , and the y -coordinate is –4 . The coordinates are (2, –4) . EXAMPLE 1 The Coordinate Plane 1.8 LESSON
3. Naming Points in a Coordinate Plane SOLUTION Give the coordinates of the point. A B Point A is 2 units to the right of the origin and 4 units down. The x -coordinate is 2 , and the y -coordinate is –4 . The coordinates are (2, –4) . Point B is 3 units to the left of the origin and 2 units up. The x -coordinate is –3 , and the y -coordinate is 2 . The coordinates are (–3, 2) . EXAMPLE 1 The Coordinate Plane 1.8 LESSON
4. Plotting Points in a Coordinate Plane SOLUTION A (4, 1) Begin at the origin and move 4 units to the right, then 1 unit up. Point A is in Quadrant I . Plot the point in a coordinate plane. Describe the location of the point. EXAMPLE 2 The Coordinate Plane 1.8 LESSON
5. Plotting Points in a Coordinate Plane SOLUTION A (4, 1) Begin at the origin and move 4 units to the right, then 1 unit up. Point A is in Quadrant I . Plot the point in a coordinate plane. Describe the location of the point. B (0, –3) Begin at the origin and move 3 units down. Point B is on the y -axis. EXAMPLE 2 The Coordinate Plane 1.8 LESSON
6. Plotting Points in a Coordinate Plane SOLUTION A (4, 1) Begin at the origin and move 4 units to the right, then 1 unit up. Point A is in Quadrant I . Plot the point in a coordinate plane. Describe the location of the point. B (0, –3) Begin at the origin and move 3 units down. Point B is on the y -axis. C (–2, –5) Begin at the origin and move 2 units to the left, then 5 units down. Point C is in Quadrant III . EXAMPLE 2 The Coordinate Plane 1.8 LESSON
7. Scatter Plots A scatter plot uses a coordinate plane to display paired data. Each data pair is plotted as a point. A scatter plot may suggest whether a relationship exists between two sets of data. The Coordinate Plane 1.8 LESSON
8. Making a Scatter Plot Fish A biologist measured the lengths and masses of eight rainbow trout. Make a scatter plot of the data shown in the table and describe any relationship you see. SOLUTION Write the data as ordered pairs. Let the x -coordinate represent the length, and let the y -coordinate represent the mass: (405, 715), (360, 557), (413, 754), (395, 584), (247, 184), (280, 248), (265, 223), (351, 506) Plot the ordered pairs in a coordinate plane. You need only the first quadrant. Notice that the points rise from left to right. You can conclude that as the lengths of the rainbow trout increase, their masses tend to increase. EXAMPLE 3 506 223 248 184 584 754 557 715 Mass (grams) 351 265 280 247 395 413 360 405 Length (millimeters) 1 2 The Coordinate Plane 1.8 LESSON