Powerful Google developer tools for immediate impact! (2023-24 C)
Earth resistivity logger (john becker)
1. Constructional Project
EARTH
RESISTIVITY
LOGGER
JOHN BECKER Part One
Help your local archaeological society to PROBES
locate and reveal the hidden mysteries of
GROUND
LEVEL
our ancestors.
SECTION
ANUARY and February 1997 saw the connected across them, current will flow
J
THROUGH
publication in EPE of Robert Beck’s between them, just as it does through an SOIL
Earth Resistivity Meter, an electronic ordinary resistor.
tool to assist amateur archaeological soci- The amount of current that flows
eties “see beneath the soil” in their search depends on how much resistance the soil
for ruins and other hidden features. interposes between the two electrodes. The
The design presented here is based upon value depends on several factors, the soil’s
the same concept as used in Robert’s cir- water content and chemical make-up (i.e.
cuit, but it has been considerably simpli- the impurities the water contains), and the
fied in terms of the components count and presence (or absence) of non-conductive
their ready-availability. Significantly, it objects. The relationship is complex, and
PLAN VIEW
has also been put under the command of a will not be discussed in detail here,
PIC microcontroller and provided with although some experiments which should
data logging facilities. The principal fea- give an insight into it are suggested in the Fig.1. Current paths set up by probe
tures of this design are outlined in Table 1. text file supplied with the software. It is array.
discussed more fully by Anthony Clark in
DOWN TO EARTH his book. main field, as you will see presently from
Before going any further, though, the The current flow through soil is also Fig.2.
author wishes to “put his cards on the sur- complicated by the fact that it is not flow- The overall current flow between the
vey grid”. He is not an archaeologist and ing in a straight line, as it does (in effect) probes is thus not just governed by the
has approached this design purely as an through an ordinary resistor. The current resistance of one direct horizontal path, but
electronic problem to be solved – transmit can simultaneously flow through a multi- by the total resistance of innumerable
a signal, retrieve it at a distance and store tude of paths, not only horizontally, but paths effectively in parallel within a given
it for later analysis. three-dimensionally, as illustrated in volume of soil, and each experiencing dif-
Along the path to this end, he has Fig.1. It also radiates outwards beyond the ferent values of resistance. Despite the
researched a fair bit, chatted with a local complexity, though, as far as the reading
archaeological society and with EPE read- on a current meter is concerned, the
ers who have knowledge in this field. Most answer is a single value, and from it an
importantly, Nick Tile, EPE reader and assessment of the soil’s relative
friend of the author, has spent several density can be made.
months successfully using the prototype for
active archaeological survey work. More on
this in Part 2. Further reference to Nick’s
surveying will be made during this article.
A list of useful references is quoted at
the end of Part 2, to which readers are
referred for more information on survey-
ing techniques. The main reference source
used by the author has been Anthony
Clark’s Seeing Beneath the Soil.
BASIC PRINCIPLES
For the sake of readers who have not yet
been enticed into joining their local
archaeological society in search of knowl-
edge about our ancestors and how they
lived, it is appropriate to outline how elec-
tronics can help us see subterranean fea-
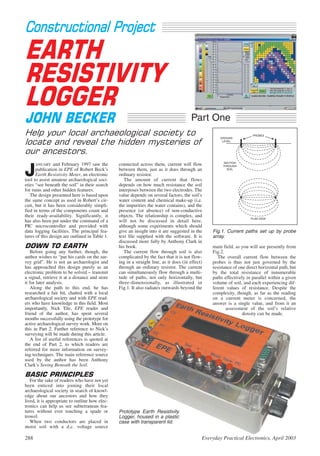
tures without ever touching a spade or Prototype Earth Resistivity
trowel. Logger, housed in a plastic
When two conductors are placed in case with transparent lid.
moist soil with a d.c. voltage source
288 Everyday Practical Electronics, April 2003
2. What is being looked for in an electron-
ic survey is reliably monitored variations in TABLE 1. WHAT IT DOES
readings across a site, the pattern of which The PIC microcontroller performs the following functions:
indicates where different sub-soil features *Generates 137Hz square wave ground-penetrating transmission signal
exist. *Converts the received and amplified analogue signal to a 10-bit digital value
*Stores each converted value to user-specified non-volatile (EEPROM) memory
UNIFORMITY PROBLEM address representing specific site plotting coordinates
A problem arises, however, in that not *Continually displays immediate real-time data and coordinates on alphanumeric
only does the soil have resistance, but it liquid crystal display (l.c.d.)
also has capacitance and additionally *On request, outputs stored data via serial link to Windows 95/98/ME PC for storage
exhibits various electrolysis effects as the to disk and subsequent analysis
d.c. current continues to flow, and most
significantly, a polarization process takes Other features of the logger include:
place, resulting in progressively changing *Switchable output resistance to vary transmission current
values on the meter. *Switchable amplifier gain, x1, x10, x100
To be able to take meaningful readings it *Pushswitch selection of survey site row and column coordinates allocation in memory
is necessary to counteract the polarization *Memory capacity for 16384 10-bit samples, representing a survey site grid of
effect. This can be done by passing an 128 x 128 squares
alternating current through the soil instead *Data storage action under complete user control
of a direct one. With each of the a.c. cur- *Data locations may be overwritten with fresh data if required
rent’s phases, the polarizing effects of the *Sampled data stays in memory indefinitely, even after power switch-off
preceding phase are reversed, thus causing *Recall of last used survey coordinate when next switched on, allowing survey to be
a more consistent current flow to occur in spread over several days or weeks
both directions. *Individually stepped push-button recall and display of recorded samples and their
Whilst the soil’s electrolysis process will coordinates
not be reversed, its effect is likely to be so *Total clearance of memory to zero value upon request, with security feature to help
minute in relation to the polarization effect, prevent erroneous use
that it can be ignored during the relatively *Operable from any d.c. supply between about 9V and 15V, consuming about 25mA.
brief time during which current flow read- It is equally suited for use with a 9V PP9-size battery (rechargeable types are
ings are taken. available), or a 12V car battery (see later)
The capacitance effects are also largely
overcome by using an alternating current at Software features for the downloaded memory samples include:
a suitable frequency. *Program written in Visual Basic 6 (VB6)
*Disk storage under unique dated and timed file name
PROBING FREQUENCY *Graphical display of data on PC screen as waveform graphs and value-related
The question then arises: at what fre- coloured or grey-scale grid squares
quency should the current direction be *Four screen slider controls allow data to be processed for best visual contrast
repeatedly reversed? Too high a frequency to aid analysis
will cause the soil’s capacitance effects to *Facility to invert data values for viewing as “valleys” or “peaks”
“mop-up” and attenuate the alternating sig- *Main screen display as 20 x 20 samples block, with vertical and horizontal panning
nal’s amplitude. Too low a frequency will across full 128 x 128 grid
again cause variation in the monitored *Secondary screen displays of separate grid or graph data for full 128 x 128 samples
readings, albeit smaller than would occur block
through using a d.c. signal. *Zoom facility for closer examination of separate graph and grid data
It appears that the optimum rate at which *Reloading of previous survey files via dedicated file selection screen
the signal phases must be changed has *Downloaded files stored in format suited for analysis and graphical display via
been established at around 137Hz Microsoft Excel (found on most PCs)
(Anthony Clark quotes 137·5Hz but also *Data may be downloaded to PC as often as required without disrupting its existing
says that 67Hz is used in some equipment). on-board storage (allowing on-going visual display of site progress across long
These frequencies assist in not only the periods)
elimination of the polarizing effects, but *Suited to survey monitoring using any of the standard probing techniques (Wenner,
also in reducing the affect of other alternat- Schlumberger, Twin-Probe, etc).
ing electrical fields which might be present
in the site being surveyed, such as a 50Hz
mains frequency, for instance. EPE contributor Aubrey Scoon has
researched into this latter aspect and has
reported the presence of many other fre-
quencies in some locations he has exam-
ined, some emanating from a nearby
“supercomputer” in one instance.
The frequencies of 67Hz and 137Hz (the
latter is used in this Logger), are not a multi-
ple of 50Hz, nor of the 60Hz mains cycle
used in some countries, such as the USA.
Thus, by performing rectification or
sampling that is synchronised with the trans-
mission signal, the effects of these extrane-
ous fields can be reduced. They are also min-
imised by the use of a differential amplifier,
which will be discussed presently.
It is worth pointing out, however, that in
the suburban garden where the author’s tri-
als with this Logger were performed in
conjunction with an oscilloscope, residual
50Hz mains currents were not evident.
MULTIPLE PROBES
The discussion so far has been in rela-
Typical example of one of the three analysis screens used by the Earth Resistivity tion to the current flowing between two
Logger’s PC software. The other two show full-screen displays of grid or graph data probes in series with a meter. Over the
for a 128 x 128 samples survey site, with zoom facilities. many years that geophysicists have been
Everyday Practical Electronics, April 2003 289
3. electrically probing the soil in their
search for minerals and oil deposits IN
IC1 OUT
+5V
78L05
(since 1946 says Robert Beck), it has R6
COM
been found that there are better probing D1
k 10k
* OUTPUT
C2 C3
techniques than just using two probes. 1N4001
a 100n 100n R1
R5
RESISTANCE
100k
Some of these have been adopted by C1
+ 1k
archaeologists. 22µ
R4 S2
Most of the favoured ones all use four ON/OFF 100Ω TO SK2
probes – two for transmission (TX), and S1
(C1, WHITE)
(FREQUENCY)
R3
two for reception (RX). The righthand sec- 8 7 10Ω
C4
tion of Fig.2 shows one way in which the 22µ +VE 2
+
second pair of probes can be used. Anthony 2
C+ OSC
7
N.C. IC3 6
6 TL071
Clark says that there are also some tech- 4
C IC2 LV N.C.
3 +
1 7660 5
niques that use five probes – with push-pull *B1 N.C. N.C. OUT 4
TX across two and the fifth becoming a 9V
GND TO RA2
grounded reference perhaps? 3
C5
TWIN PROBES
22µ + SK1
*SEE TEXT R2 (C2, BLACK)
There are several ways in which four 100k
probes are used in relation to each other, 0V
and each with its own merits. Their use is 5V
outlined later, but no quality judgement is
offered here on their appropriateness to Fig.3. Power supply and transmission interface circuit for the Earth Resistivity Logger.
mA a wire attached will the other TX probe is connected to the 0V
CURRENT V
MEASURED do. The probes don’t power line. IC3 is configured as a compara-
SOURCE
POTENTIAL even need to be tor whose inverting input (pin 2) is tied to
inserted very far, just the potential divider chain formed by equal-
enough to penetrate value resistors R1 and R2. The resistors are
the soil to make connected across the +5V and 0V lines and
electrical contact the voltage at their junction is thus 2·5V.
with its moistness. The non-inverting input (pin 3) of IC3 is
It will be obvious, connected to one of the PIC microcon-
of course, that dry troller’s output pins (RA2) and is fed with
LINES OF
EQUAL POTENTIAL soil will be less a 137Hz square wave, generated by the
capable of passing a software, and which alternates between
CURRENT FLOW
LINES
current than moist +5V and 0V. As this square wave repeated-
soil. Keep in mind ly crosses above and below the 2·5V refer-
A) B)
that the surface of ence voltage, IC3’s comparator action
the soil can dry out takes place and its output (pin 6) alternates
Fig.2. How current flowing between two probes is detected by faster than that between the device’s upper and lower volt-
a second pair. below it, and so a age limits, i.e. swinging between about
reasonable amount +4V and –4V.
various survey situations – but it is worth of penetration should be allowed. Robert Note that the op.amp to which the TX
noting that Clark considers the Twin-Probe Beck allows 200mm with his probe struc- probes are connected (IC3) is short-circuit
technique to be the most favoured for tures discussed in Part 2. protected internally and is unlikely to suf-
archaeological surveying, although the With some sites it may be necessary to fer if the probes accidentally come into
Wenner technique is said to provide more evenly damp the soil with water before contact with each other while the power is
detailed results. Nick in his extensive use adequate probing can begin. switched on. However, do not sustain such
of the prototype adopted the Twin-Probe contact since it could cause regulator IC1
technique. POWER SUPPLY to get hot, and it will shorten the battery
The Twin-Probe and Wenner techniques The PIC-controlled processing circuit is charge life.
were outlined in Robert Beck’s article and almost irrelevant to the main aspects of soil
were used in the author’s garden tests with monitoring! So first let’s look at the power OUTPUT RESISTANCE
this Logger. They will be discussed in Part supply requirements, and the simple trans- Depending on the probing technique
2 in a bit more detail. Suffice to say for the mission circuit, both illustrated in Fig.3. used, experienced geophysicists can deter-
moment, both involve placing in the soil a As said in Table 1, the power can origi- mine not only the subterranean density, but
reference probe that is connected to the cir- nate from any d.c. source (e.g. battery) also its possible composition. This is
cuit’s 0V line (common ground). This is ranging between about 9V and 15V. This is apparently achieved by pre-setting the cur-
regarded as one half of the TX probes pair. input via diode D1 to the +5V voltage reg- rent which flows between the two TX
To the other TX probe is fed the alter- ulator IC1. The diode prevents distress to probes.
nating voltage or current, evenly swinging the circuit in the event of the battery being Robert discussed this in the ’97 text,
as a square wave above and below the 0V connected with the wrong polarity. referring to the technique as providing a
reference value. The function of the TX The regulated +5V output from IC1 “constant current”. It would appear,
probes is to set up a field of potential gra- powers the main PIC-controlled circuit, though, that his circuit did not provide a
dient in the soil, which is then sampled by which must not receive a supply signifi- constant current in the literal sense – same
the RX probes. cantly greater than +5V. It also provides current flowing irrespective of resistive
The RX probes are positioned at dis- the positive power to the TX and RX cir- conditions – but rather it provided a current
tances away from the TX probes as dictat- cuits. Both of these circuits additionally limit. It is the same limiting approach that
ed by the probing technique being used. need an equivalent negative supply. This is has been taken in this Logger design.
They are connected to the twin inputs of a generated from the +5V line by the voltage The output from IC3 can be switched by
differential amplifier, whose output signal inverting chip IC2, which outputs a voltage S2 to the active TX probe via one of five
amplitude is determined by the difference of close to –5V. paths. These comprise a direct unlimited
in the two input levels. It is this signal path, and four limiting paths via resistors
which is then monitored by the control TRANSMISSION R3 to R6, in order of 109, 1009, 1k9 and
circuit. OUTPUT 10k9.
It is not even necessary to use special Op.amp IC3 is the device which feeds the Readers are referred to the publications
probes, any metal object that does not cor- 137Hz alternating signal to one TX probe listed in Part 2 for information on resis-
rode and can be inserted into the soil with (the “active” TX probe). As previously said, tive path use. The field tests performed by
290 Everyday Practical Electronics, April 2003
4. +5V
R21
R7 1M
1k 4 k
5 D4
+ GAIN 1N4148
TO SK3 IC4a 7 a
R20
(P1, YELLOW) TL074 S3
6 100k
R9 R12 R13 R22
100k 100k 100k R19 100k
10k
C6 R18
R10 2
22µ 10k
100k R11 R14 C7
+
100k 100k IC4c 1 13
470n
3 TL074 14
+ IC4d
12 TL074
+
VOUT
R16 R17 R15 TO RA3
9 10k 10k 100k R23
100k
R8
1k IC4b 8
TO RA0
10 TL074
+ TO RA1 k
k k D5
TO SK4 11 D2 D3 1N4148
(P2, GREEN) a
1N4148 1N4148
a a
0V 0V
5V
Fig.4. Differential amplifier that receives, amplifies and conditions the RX probes signal prior to sending to the ADC input of the
PIC microcontroller.
the author and Nick Tile were carried out C6 to the amplifying stage around IC4d. R17 plus diodes D2 and D3. These are not
via the direct TX path (Nick says he has Here the gain can be switched by S3 part of the required analogue processing
not found the switchable resistance facil- between ×1, ×10 and ×100. In the proto- circuit but were included for use during
ity to be useful). In this role, the signal type’s garden tests, the ×1 gain was software development. Their function will
amplitude across the TX probes is picked satisfactory across the maximum probe be described presently.
up by the RX probes simply as an alter- separation distance that the dense garden
nating signal whose amplitude varies flower beds would allow (11 metres)! Nick CONTROLLER CIRCUIT
according to the soil density it has to pass says he prefers the ×10 setting. The PIC-controlled processing circuit is
through. At this stage the signal is swinging shown in Fig.5. At its heart is a PIC16F876
above and below 0V. It has to be shifted so microcontroller, IC5, manufactured by
RECEIVING CIRCUIT that it only swings between 0V and +5V at Microchip. It is run at 3·6864MHz, as set
The receiving circuit is shown in Fig.4. the maximum extremes, to suit the PIC by crystal X1. The frequency may seem
The twin RX probes and their received d.c. microcontroller’s limits. This is achieved unusual, but crystals tuned to it are stan-
coupled signals are connected via buffering by a.c. coupling the signal via capacitor C7 dard products. Its choice provides greater
resistors R7 and R8 to the respective inputs to the level-shifting potential divider accuracy of the baud rate at which the
of the differential amplifier, formed initial- formed by resistors R22 and R23. Diodes logged data is output to the computer.
ly around op.amps IC4a and IC4b and hav- D4 and D5 limit the maximum voltage The software-generated 137Hz square
ing a gain of three. The outputs from these swing then fed to the PIC, preventing it wave pulse train is output via pin RA2, and
op.amps are summed, still as d.c. signals, from swinging above or below the PIC’s fed to the TX op.amp IC3 in Fig.3.
by op.amp IC4c, which provides unity gain. limits of acceptance. Pin RA3 is the pin to which the level-
The resulting signal represents the It will be seen that two additional signal shifted signal output from IC4d is input.
difference between the two input signal paths are provided from the output of The pin is configured by the software as an
levels. It is now a.c. coupled via capacitor IC4a/b and consist of resistors R16 and analogue-to-digital converter (ADC).
TEST SAVE UP DOWN MODE DOWNLOAD 2
+5V 7 +VE
N.C. D0
S9 S8 8
S4 S5 S6 S7 N.C. D1
20 TB1 9
N.C. D2
+VE +VE 10
N.C. D3
2 21 D4 11
TO R16
3
RA0/AN0 INT/RB0
22 D5 12
D4 X2
T0 R17 RA1/AN1 RB1 D5 L.C.D.
4 23 D6 13 MODULE
F OUT RA2/AN2/VREF- RB2 D6
5 24 D7 14
TO D4/D5 RA3/AN3/VREF+ PGM/RB3 D7
6 25 RS 4
RA4/TOCK1 RB4 RS
7 26 E 6
RA5/AN4/SS RB5 E
27 0V 5 3
C8 IC5 PGCLK/RB6
28 0V
R/W
GND
CX
10p PIC16F876 RS232
9 PGDA/RB7
OSC1/CLKIN TO IC7 PIN 11 CX 1
a 11
X1 D6 T1OSO/T1CKI/RC0 R31
3.6864MHz 1N4148 12
T1OSI/CCP2/RC1 10k
C9 k
13
10p CCP1/RC2
10 14
OSC2/CLKOUT SCK/SCL/RC3
15
SDI/SDA/RC4
R25 16 8
SDO/RC5 CONTRAST
1k 17
TX/CK/RC6 +V
1 7
R26 1 18 R29 R24 N.C. A0 WP
MCLR RX/DT/RC7 N.C.
10k
GND GND
10k 10k VR1
N.C.
2
A1 IC6 SCL
6
10k 3 24LC256 5
R27 8 19 R28 R30 N.C. A2 SDA
10k 10k 10k GND
0V 4
TB2 *PROGRAMMER
0V VPP DATA CLK
Fig.5. PIC-controlled processing, display and data storage circuit.
Everyday Practical Electronics, April 2003 291
5. The PIC repeatedly converts the input
COMPONENTS
Approx. Cost
signal to a 10-bit binary value which it out-
puts for display on the 2-line × 16-charac- Guidance Only £45
ter l.c.d. X2, as a decimal number. As usual excl. batts case
with the author’s designs, the l.c.d. is con- IC6 24LC256 256 kilobit
trolled in 4-bit mode (and its pinouts on the
Resistors See serial EEPROM
R1, R2, R9
printed circuit board are in his standard to R15, R20, SHOP IC7 MAX232 RS-232
order). Its screen contrast is adjustable by R22, R23 100k (12 off) interface driver
preset VR1. R3 10W TALK
R4 100W page Miscellaneous
Pressing switch S8 causes the PIC to S1, S9 s.p.s.t. min. toggle switch
R5, R7, R8,
store (Save) the ADC’s 10-bit binary out- R25 1k (4 off) (2 off)
put value to the 32 kilobyte (32768 bytes) R6, R16 to S2 2-pole 6-way rotary
serial EEPROM chip, IC6, at the address R19, R24, switch
set by the user via switches S4 to S6. This R26 to R31 10k (12 off) S3 4-pole 3-way rotary
R21 1M switch
chip is another Microchip device, and was S4 to S8 min. push-to-make
All 0·25W 5% carbon film or better
first demonstrated by the author in his switch (5 off)
PIC16F87x Data Logger of Aug/Sep ’99. Potentiometer SK1 to SK4 4mm single-socket,
Its device number, 24LC256, indicates that VR1 10k min. preset, round 1 each black, white,
it has 256K single-bit memory locations. yellow, green (see
These are accessed as 8-bit bytes. Capacitors text)
C1, C4 to SK5 9-pin D-type serial
In other applications, the 24LC256 is C6 22m radial elect. 25V (4 off) connector, female,
capable of being multiplexed with seven C2, C3 100n ceramic, 5mm chassis mounting
others of its type, using its A0 to A2 inputs pitch (2 off) TB1, TB2 pin-header strips to suit, or
to set each device’s multiplexed address. In C7 470n ceramic, 5mm pitch 1mm terminal pins (2 off)
this application they are left unconnected, C8, C9 10p ceramic, 5mm pitch X1 3·2768MHz crystal
(2 off) X2 2-line, 16-character
leaving them biased internally. Resistor (per line) alpha-
C10, C11 1m radial elect. 16V (2 off)
R31 is essential to the correct reading of C12 to C14 10m radial elect 16V (3 off) numeric l.c.d. module
the device’s retrieved data output value.
The 24LC256 data sheet can be down- Semiconductors Printed circuit board, available from the
loaded from Microchip’s web site D1 1N4001 rectifier diode EPE PCB Service, code 388; plastic case
D2 to D6 1N4148 signal diode with see-through lid, 190mm x 110mm x
(www.microchip.com). 90mm (see text); 8-pin d.i.l. socket (3 off);
(5 off)
Data stored in the 24LC256 can be IC1 78L05 +5V 100mA 14-pin d.i.l. socket; 28-pin d.i.l. socket;
retrieved and downloaded serially to a PC voltage regulator knobs (2 off); 4mm plugs, colours to match
via the RS-232 interface device (IC7) and IC2 ICL7660 voltage inverter 4mm sockets (4 off); heavy-duty crocodile
socket SK5, in Fig.6. Transfer is initiated IC3 TL071 f.e.t. op.amp clips, with coloured covers to match 4mm
by pressing switch S7. Once started, all IC4 TL074 quad f.e.t. op.amp sockets (4 off); robust cable for probes
IC5 PIC16F876 (see text); 9V PP3 battery and clip (see
32K bytes are sent to the PC in consecutive microcontroller, text); p.c.b. supports (4 off); nuts and bolts
address order. preprogrammed (see to suit l.c.d. mounting style (4 off each);
text) internal connecting wire; solder, etc.
DATA SAMPLING
The software controls the output of a
train of square wave pulses at the 137Hz
rate. Data sampling takes place on each
TEST VALUE DISPLAY Software, including source code files,
for the PIC unit and PC interface is avail-
Resistors R16 and R17, mentioned pre-
phase of the output pulse (high and low). viously, allow the PIC to monitor the volt- able on 3·5-inch disk from the Editorial
On each complete cycle, the minimum age on the outputs of IC4a/IC4b for test office (a small handling charge applies –
value received is subtracted from the max- purposes, via its ADC inputs RA0/RA1. see EPE PCB Service page) or it can be
imum (to establish the received signal’s Diodes D2 and D3 prevent the PIC from downloaded free from the EPE FTP site.
amplitude) and the result stored to a 32- receiving damaging negative voltages. The latter is accessible via the top of the
byte temporary memory block. So that Originally, these outputs were intended home page of the main EPE web site at
maximum peak-to-peak values of the purely for development use. However, their www.epemag.wimborne.co.uk. Click on
received square wave have stabilised, the use has also proved beneficial in the out- “FTP Site (downloads)”, then in turn on
synchronous sampling takes place at the door monitoring environment and has been PUB and PICS, in which page the files are
end of each peak. retained. The monitored values are dis- in the folder named EarthRes.
About once a second, the pulse train played in decimal on the l.c.d. and provide This month’s ShopTalk page provides
stops while the 32 sample values are aver- indication of relative probe signal information about obtaining pre-pro-
aged, and the l.c.d. display updated. The strengths, and of the loss of connection to grammed PICs.
pulse train then recommences for another one or more probes. The PIC program (ASM) was written in
second. This gives the soil time to respond In relation to this test-motivated option, TASM, although the run-time assembly is
to the re-application of the a.c. waveform, a second signal strength display option has supplied as an MPASM HEX file, which has
and for the effects of any d.c. currents to be been included via the software. The second configuration values embedded in it (crystal
over-ridden. mode displays the XT, WDT off, POR on, all other values off).
upper and lower Regarding the PC interface, if you have
peak values of the Visual Basic 6 already installed on your
+5V
16 signal applied to the machine, you only need to use files
+VE C12 SERIAL
PIC’s RA3 input. EarthRes.exe and INPOUT.DLL. Copy
10µ OUTPUT
1 2
+
The two modes are them into a new folder named C:EARTH
+ C1+ V+ + SK5 RES, or any other of your choosing on
C10 C14
SERIAL
selected by toggle
1µ 3 10µ
OUTPUT switch S9. Drive C (the usual hard drive letter).
C1-
4
5
9
The ability to install to another drive let-
+ C2+
C11
1µ 5
IC7
MAX232
V-
6
SOFTWARE ter, e.g. Drive E on a partitioned drive, has
not been provided with this program.
C2- In common with
11 14 many other PIC de- Although the author has previously offered
FROM IC5 PIN 17 T1 IN T1 OUT
10
T2 IN T2 OUT
7
N.C. signs, the facility has the option with other VB6 programs, feed-
N.C.
12
R1 OUT R1 IN
13
1
6
been provided to pro- back from readers has indicated that the
N.C.
9
R2 OUT R2 IN
8
C13 gram the PIC in situ, option is not always reliable with some
GND
10µ +
via connector TB2. systems. Consequently, it has been
15
Diode D6 and resis- dropped from this program. Readers who
0V
tor R25 prevent dis- know how this option can be reliably
tress to the +5V line implemented with VB6 are invited to tell
Fig.6. RS-232 interface circuit. during programming. the author at EPE!
292 Everyday Practical Electronics, April 2003
6. TO PROGRAMMER (SEE TEXT)
TO SK2 S2
5
A DATA CLK
4 MCLR RB7 RB6 0V
OUTPUT 1
RESISTANCE 2 3
SERIAL
VR4 OUTPUT
TB2
R1 + SK5
TB1
R R R R
3 4 5 6
C4 IC2 CX 3
k IC3 R25 +5V 2
+ 0V 1
C12
5
D4 C5
k
D6
a
0V(R/W) 5
+ + + 9
a R2
C10 C14
REAR VIEW
OF PINS
S3
R22 S9 +
E 6 IC7 6
C7 S8 RS 4 C11 OUT
k 1
R D7 14
3 a a
R21 D5 23
D3
R26 IC5 D6 13
A 2 R20 a D2 R27
IN OUT D5 12 C13
1 R19 k k
D4 11 + 0V
COM C
R18 T.P. T.P.
C6 3 +5V
R R IC1
GAIN
13 + 15 R28 R R
R R R R29 24 31
12 IC4 17 16 +
C1
R30
R9 R R R11
C2 IC6
7 8 k C9
D1 X1
R14 a
R10 C8
TO SK3
TO SK4
TO SK1
TO RA5
0V TO
+9V BATTERY
TO RA4
S1 S4 S5 S6 S7 S8 S9
ON/OFF UP DOWN MODE DOWNLOAD SAVE TEST
4.3in (109.2mm)
388 2.8in (71.1mm)
Fig.7. Printed circuit board component layout and full-size copper foil master track pattern for the Earth Resistivity Logger.
If you do not have VB6, you need three are shown in Fig.7. This board is available Double-check the perfection of your
other files, comdlg32.ocx, Mscomctl.ocx from the EPE PCB Service, code 388. soldering and component positioning
and Msvbm60.dll, held on our 3.5-inch Assemble in any preferred order, ensur- before applying power. Do not insert any
disk named Interface Disk 1, and in the ing that all the on-board link wires are of the d.i.l. i.c.s until the correctness of the
Interface folder on the FTP site (they are included, and that all polarity-conscious +5V output from regulator IC1 has been
also included with the Toolkit TK3 soft- components are the correct way round. proved.
ware). These files must be copied into the The use of sockets for all the dual-in-line To provide a degree of waterproofness,
same folder as the other Earth Resistivity (d.i.l.) i.c.s is recommended; it is essential the prototype was mounted in a robust
files. to use one for the PIC, IC5. Treat all i.c.s plastic box with a see-through lid. The
as static sensitive and discharge static elec- l.c.d. was mounted below the lid on the
CONSTRUCTION tricity from yourself before handling them, inside. If a metal box with a see-through
Details of the component and track lay- by touching the bare grounded metal of an lid can be found, it would provide even
outs for the printed circuit board (p.c.b.) item of earthed equipment, for example. greater durability.
Everyday Practical Electronics, April 2003 293
7. pinouts for the latter are shown in Fig.8. It
will probably be necessary to adjust its
contrast using VR1 before a display will be
seen.
With power switched on again, check
that +5V and –5V are still present where
they should be. Switch off immediately if
they are not, and correct the cause of
malfunction.
On line 1 of the l.c.d., the message
“SOIL RESISTIVITY” will be displayed
briefly before being replaced by some
numerical values, with more on line 2.
L.C.D. display following switch-on.
The final prototype board prior to installation.
It is recommended that a case of at least differing lengths and cores. Obviously the
50 per cent larger than used in the proto- thicker it is, the lower the loss over long
type should be employed to allow a large lengths, but 50m (say) of such cable is Example display when carrying out soil
9V to 12V battery to be adequately housed. expensive, and heavy to drag about. monitoring with S9 switched on to test
Probe sockets were 2mm types on the Details of constructing customised mode.
prototype, simply because the author had probes are given in Part 2, but in simple
them in stock. It is recommended that 4mm applications four thin metal rods of the With Test switch S9 switched on, the first
types should be used. These provide type used in gardens as flower supports can two values on line 1 show the monitored val-
greater robustness of the plugged connec- be used. ues present at the outputs of IC4a/IC4b, as
tions and allow them to be removed readi- detected by the PIC’s ADC conversions.
ly. Nick recommends the use of restraints TESTING Respectively, they are suffixed by the letters
near the sockets to prevent the connections Having established that +5V is present B and A, indicating the op.amp to which they
pulling out during a survey. on the output of regulator IC1, plug in the refer (as given in the circuit diagram Fig.4).
The probe sockets should be colour voltage inverter chip, IC6, and check that With S9 off, the values are the upper and
coded, as should their respective plugs. around –5V is present on its output. lower peak values resulting from the ADC
Colour suggestions are shown in the circuit Naturally, always disconnect power before conversion of the output of IC4d. They are
diagrams of Fig.3 and Fig.4, but may be making component changes. suffixed by the letters H and L (High and
changed to suit availability. It is important If all is well, the remaining i.c.s can be Low). Any value between 0 and 1023 could
NOT to duplicate the colours – doing so inserted and the l.c.d. connected. Typical appear at this time for all four readings.
could result in leads being incorrectly
allocated to probes.
The use of crocodile clips with colour-
coded plastic covers was found to facilitate
the connection of leads to the probes them-
selves. Heavy-duty crocodile clips are rec-
ommended for ease of use (especially in
cooler or wet weather!).
When testing the prototype, it did not
appear to matter whether the probe leads
were screened or not. Consequently, stan-
dard lighting or low current cable could be
used. Twin-core mains cable was used by
the author and Nick, but in long term sur-
veys it might prove more convenient to
have a mix of cable arrangements, of
Interior of the case showing the relative positioning of the components. The p.c.b.
is the first prototype which did not include the RS-232 device, IC7. The latter can
Fig.8. The two “standard” l.c.d. module be seen on its own sub-board to the left of the push-switches. It is recommended
pinout arrangements. that a larger case is used to allow a heavier-duty battery to be inserted.
294 Everyday Practical Electronics, April 2003
8. At the top right of line 1 is another incrementing beyond 127, or rolling over ability to display values as different inten-
number, suffixed by a hash symbol (#). to 127 after decrementing below 0. sity grey-scales was found to be too limit-
This is the processed value that, when Pressing Mode switch S6 changes the ed to justify the extra expense (at least
Save switch S8 is pressed, is stored to the position of the asterisk, thus allocating the another £30) and so the facility was
serial memory as a grid value for the +/– switches to that aspect of the grid, i.e. dropped.
coordinates on line 2. Switching between vertical (column) or horizontal (row). Had the result been acceptable, a
gain settings using S3, the value will PIC16F877 would have been used with the
change. (During a survey always keep S3 DATA TRANSFER screen, in a manner similar to the author’s
at the same setting.) SWITCH Using Graphics L.C.D.s with PICs article
Note that if too strong an input signal is Pressing Download switch S7 causes the of Jan ’01.
amplified, the op.amp’s output may satu- PIC to send the contents of the serial mem-
rate (reach its maximum obtainable level). ory to the PC at a rate of 9600 baud. As EEPROM RESETTING
In practice, keep the value at the right of previously said, the values for each of the The contents of the serial EEPROM
line 1 well below about 500. A value of 16384 possible grid coordinates are stored can be reset to zero when required. As a
1023 is the maximum that can result from as two bytes – the MSB and LSB of the 10- security measure (to avoid resetting inap-
an ADC conversion, indicating that the bit ADC values. propriately!), the reset routine can only
ADC has received an input voltage equal to No attempt has been made to be selec- be called at the moment that the power is
the power line voltage of +5V. This is an tive about which set of values is sent to the being switched on. With the power off,
improbable event as the op.amp output is PC. All 32768 values are sent on each press and hold down Save switch S8,
unlikely to swing that high. occasion that S7 is pressed. The transfer then switch on the power. When the mes-
takes about 30 seconds. sage CLEARING EEPROM is seen,
L.C.D. LINE 2 During transfer, the top l.c.d. line shows release S8.
At the left of line 2 are shown the col- the message “SENDING TO PC”, with
umn and row values which represent the line 2 blank. Upon completion of the trans-
survey grid coordinates, and thus the loca- fer, line 2 shows “SENDING FINISHED”,
tion in the serial memory at which the and line 1 briefly displays the “SOIL
processed IC4 value is stored. They are RESISTIVITY” message again, before
suffixed C and R respectively. An asterisk clearing to once more show the values
symbol (*) will be seen to the right of one being sampled.
or the other of these coordinate values Line 2 remains with its last message Example display during serial memory
(more on setting coordinates in a moment). shown until the asterisk (Mode) switch S6 resetting.
At the right of line 2 is shown the value is again pressed, to once more show the
that is currently stored at the specified coordinate values.
memory address. During the survey it will On line 2 will be a progress count dis-
normally show 0 as each new coordinate is play as the software writes zeros to all
selected. When the Save switch S8 is 32768 EEPROM data locations. It is a
pressed the display will change to repeat somewhat lengthy process, taking about
the number that has just been saved to the three and half minutes. This is due to
memory as a 2-byte value. At any time dur- numerous essential delays that are built
ing the survey, the coordinate switches into the writing procedure.
may be used to recall the values that are Example display when downloading The software for the EEPROM writing
stored for each grid location. stored data to a PC-compatible and reading was originally downloaded
There are three switches for coordinate computer has been completed. from Microchip’s CD-ROM for use in the
setting. Two of them, S4 and S5, respec- PIC16F877 Data Logger referred to earli-
tively increment or decrement the value Check that all the switches perform as er. It is recommended that you do not
beside which is shown the asterisk. The intended. It is not necessary to have probes attempt to modify Microchip’s coding to
range is 0 to 127, rolling over to 0 after connected at this time, and it does not mat- speed the resetting process!
ter that the serial download will not be des- On completion of the resetting, which
tined anywhere – the PC’s data reception also resets the column and row values, the
side of things will be covered in Part 2. screen briefly shows the SOIL RESISTIV-
ITY message and proceeds in the normal
PROGRAMMED ASIDE way as described earlier.
Incidentally, experiments were made
using a graphics l.c.d. instead of an NEXT MONTH
Example of display when Save switch alphanumeric one, to see if survey data In the final part next month, the PC-
S8 is pressed. In this case saving 28 to could be illustrated by the unit as an in- compatible Windows software is described
EEPROM location 41. built 20 × 20 grid display. However, the and probing methods discussed.
NEWSAGENTS ORDER FORM
Please reserve/deliver a copy of Everyday
Practical Electronics for me each month
Signed .......................................................................................................................................................................................
Name and Address ...................................................................................................................................................................
...................................................................................................................................................................................................
................................................................................................................................ Post Code ................................................
Everyday Practical Electronics is published on the second Thursday of each month and distributed S.O.R. by COMAG
Make sure of your copy of EPE each month – cut out or photostat this form, fill it in and hand it to your newsagent.
Everyday Practical Electronics, April 2003 295