Applied Psych Test Design: Part F--Psychometric/technical statistical analysis: Internal
•Download as PPT, PDF•
1 like•1,158 views

The Art and Science of Applied Test Development. This is the fifth in a series of PPT modules explicating the development of psychological tests in the domain of cognitive ability using contemporary methods (e.g., theory-driven test specification; IRT-Rasch scaling; etc.). The presentations are intended to be conceptual and not statistical in nature. Feedback is appreciated.

Recommended
Recommended
More Related Content
Similar to Applied Psych Test Design: Part F--Psychometric/technical statistical analysis: Internal
Similar to Applied Psych Test Design: Part F--Psychometric/technical statistical analysis: Internal (20)
More from Kevin McGrew
More from Kevin McGrew (20)
Recently uploaded
Recently uploaded (20)
Applied Psych Test Design: Part F--Psychometric/technical statistical analysis: Internal
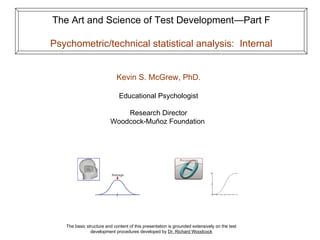
- 1. The Art and Science of Test Development—Part F Psychometric/technical statistical analysis: Internal Kevin S. McGrew, PhD. Educational Psychologist Research Director Woodcock-Muñoz Foundation The basic structure and content of this presentation is grounded extensively on the test development procedures developed by Dr. Richard Woodcock
- 2. “In god we trust….all others must show data” (unknown source) Test authors and publishers have standards-based responsibility to provide supporting psychometric technical information re: tests and battery Typically in the form of a series of technical chapters in manual or a separate technical manual
- 3. Calculate psychometric/measurement statistics for technical manual/chapters Use Joint Test Standards as a guide
- 4. Calculate summary statistics (n, means, SDs, SEM) and reliabilities for all tests and clusters by technical age groups etc… etc…
- 5. Special reliability analyses required for speeded tests Traditional test-retest reliability analysis
- 6. Special reliability analyses for all tests More complex repeated measures reliability analysis (McArdle and Woodcock, 1989—see WJ-R Technical Manual)
- 7. Provide evidence based on internal structure (internal validity)
- 8. Structural (Internal) Stage of Test Development Purpose Examine the internal relations among the measures used to operationalize the theoretical construct domain (i.e., intelligence or cognitive abilities) Questions asked Do the observed measures “behave” in a manner consistent with the theoretical domain definition of intelligence? Method and concepts • Internal domain studies • Item/subscale intercorrelations • Exploratory/confirmatory factor analysis Characteristics of • Measures co-vary in a manner consistent with the intended strong test validity theoretical structure program • Factors reflect trait rather than method variance • Items/measures are representative of the empirical domain
- 9. Structural/internal validity evidence: Test and cluster inter-correlation matrices by technical age groups etc… etc…
- 10. Structural/internal validity Confirmatory factor analysis by major age groups (exploratory factor analysis if not theory-driven test blueprint)
- 11. Structural/internal validity Confirmatory factor analysis by major age groups (exploratory factor analysis if not theory-driven test blueprint) .53 .67 .40 .42 .43
- 13. Structural (Internal) Stage of Test Development Purpose Examine the internal relations among the measures used to operationalize the theoretical construct domain (i.e., intelligence or cognitive abilities) Questions asked Do the observed measures “behave” in a manner consistent with the theoretical domain definition of intelligence? Method and concepts • Exploratory/confirmatory factor analysis Characteristics of • The theoretical/empirical model is deemed plausible strong test validity (especially when compared against other competing models) program based on substantive and statistical criteria
- 14. Structural/internal validity: Confirmatory factor analysis model comparisons by major age groups The WJ III factor structure model provided the best fit to the data when compared to six alternative models Fit Statistics Models Chi-square df AIC RMSEA WJ III CHC 7-factor 13189.16 536 13377.16 0.056 (0.055-0.057) Gc/Gsm/Gs/Gv+Gf (WAIS 4-factor) 15113.99 537 15301.00 0.060 (0.059-0.061) Gc/Gsm/Gq/Gv+Gf (SB IV 4-factor) 20379.58 537 20565.58 0.070 (0.069-0.071) Gf-Gc Dichotomous (KAIT) 23145.12 549 23307.12 0.074 (0.073-0.075) PASS 4-factor * 25198.46 542 25374.46 0.077 (0.078-0.079) g single factor 65314.78 1170 65524.78 0.086 (0.085-0.086) Null model 215827.54 1219 215939.54 0.153 (0.153-0.154) The conclusion was the same across 5 age-differentiated samples
- 15. Internal validity evidence example: g-loadings for differentially weighted General Intellectual Ability cluster
- 16. Provide evidence based on internal structure: Developmental evidence?
- 17. Developmental evidence in the form of differential growth curves of measures
- 18. Provide Test Fairness Evidence
- 19. Structural/internal validity Evaluating structural invariance with Multiple Group CFA = White Non-White
- 20. Structural/internal validity Evaluating structural invariance with Multiple Group CFA = Male Female
- 21. Structural/internal validity Evaluating structural invariance with Multiple Group CFA = Hispanic Non-Hispanic
- 22. Test fairness evidence: Item Level Analyses: Differential Item Functioning (DIF) •Male/Female •White/Non-White •Hispanic/Non- Hispanic
- 23. Test fairness evidence: Item Level Analyses: Differential Item Functioning (DIF) •Male/Female •White/Non- White •Hispanic/Non- Hispanic Results combined with results from Bias Sensitivity Review Panels
- 24. Lack of rigor and quality control in all prior/earlier stages will “rattle through the data” and rear its ugly head when performing the final statistical analysis Shorts cuts in prior stages will “bite you in in the ____” as you attempt to perform final statistical analysis Data screening, data screening, data screening!!!!……. prior to do performing final statistical analysis • Compute extensive descriptive statistical analysis for all variables (e.g., histograms, scatterplots, box-whisker plots, etc.) • More than means and SD’s. Also calculate median, skew, kurtosis, n-tiles, etc. Deliberately planned and sophisticated “front end” data collection short-cuts (e.g., matrix sampling) introduce an extreme level of “back end” complexity to routine statistical/psychometric analysis Know your limits, level of expertise, and skills. Even those with extensive test development experience often need access to trusted measurement/statistical consultants (cont. next slide)
- 25. Don’t be seduced and completely reliant on factor analysis as the primary internal/structural validity tool • An example: Inability of CFA to differentiate closely related latent constructs (e.g., Gc and Reading/Writing—Grw) doesn’t prove they are the same. Need to examine other evidence (e.g., very different developmental growth curves for Gc and Grw) Published statistics/psychometric information needs to be based on final publication length tests • Often need to use test-length correction formula’s (e.g., KR-21) for test reliabilities • Correlations between short /and or long norming versions of a test, that differ in test length (number of items) from publication length test, may need special adjustments/corrections. Back up, back up, back up!!!!!!!!!! Don’t let a dead hard drive or computer destroy your work and progress. Do it constantly. Build redundancy into your files and people skill sets Sad fact: Majority of test users do NOT pay attention to the fancy and special psychometric/statistical analysis you report in technical chapters or manuals. Be prepared for post-publication education via other methods. Post-manual publication technical reports of special/sophisticated analyses are good when publication time-line pressures dictate making difficult decisions.
- 26. Exploratory-driven confirmatory factor analysis is often used by test developers to explore unexpected characteristics of tests (often called “model generation modeling” in SEM/CFA literature) Different approaches to DIF (differential item functioning) Multiple group CFA to test invariance (by age, by gender, by……..) • Different degrees of measurement invariance can be tested Traditional definition of psychometric bias and appropriate/inappropriate statistical methods Equating (e.g., Form A/B) methods and evidence Methods for calculating prediction models that account for regression to the mean and that are sensitive to developmental (age) X content interactions Complex repeated measures reliability analyses to tease out test stability, internal consistency, and trait stability sources of score variance (see WJ-R Technical Manual)
- 27. End of Part F Additional steps in test development process will be presented in subsequent modules as they are developed