1. 1
QUALITY OF LIFE AND OUR NATIONAL WATER WEALTH
Dr. S. P. Chakrabarti*
1. Introduction
The last century of the bygone millennium, especially its later half, has seen unbelievable
scientific and technological developments in improving the quality of life of mankind.
The innovations in the field of electronic media in particular have done wonders to make
our life run faster than ever before. The world has become too small with the growth of
the information technology. What was difficult to achieve even a decade ago has now
become easily accessible. With the blessings of the modern technology informatics the
living has become not-so-hard as it was before. Consumerism induced by the mass media
has changed the style of living at all walks of life. People are looking for the state-of-the-
art equipment and accessories, which are available in urban centres, to have comfort in
day-to day life. As a consequence, there is a tremendous stress in urban infrastructure
services, be it housing, water supply, waste management, transportation, power
generation, telecommunication or any other system. The more the stress, the more is the
failure rate in the provision of these services, The ill effects of such fall-outs then
boomerang on the management of the services adversely affecting the various
components of environment out of the ‘uncared for’ residues which reach the natural
water bodies through direct and indirect routes polluting them.
2. Water Resources of India
The annual rainfall over India, based on the daily data from more than 3,000 rainfall
recording stations for a period of 50 years (1901-1950), is computed as 105 centimetres.
It is the largest anywhere in the world for a country of a comparable size. From
precipitation alone, India receives 4,000 km3
, including snowfall. Of this, 75 percent
…………………………………………………………………………………………….
* Dr. S. P. Chakrabarti, former Member Secretary, Central Pollution Control Board, Ministry of Env. &
Forests, Govt. of India, Delhi - 110 032, is presently employed as Water Quality Expert in the Hydrology
Project of the Ministry of Water Resources, CSMRS Building , Olof Palme Marg, New Delhi – 110 016.
2. 2
occurs only during three monsoon months. A good part of it is lost through the process
of evaporation and plant transpiration, leaving only half of it on the land for use. After
allowing for evapo-transpiration losses, the country's surface flow is estimated as 1,880
km3
. Due to topographical, hydrological and other constraints, it is assessed that only
about 700 km3
of surface water can be put to beneficial use by conventional methods of
development. The annual replenishable groundwater resource is assessed to be about
600 km3
, of which the annual usable resource is estimated at 420 km3
. The distribution
of water resources in various compartments is shown in Table 1.
Table 1 Estimated distribution of fresh water resources of India
Compartment Quantity (km3
)
Total precipitation
• Immediate evaporation
• Percolation in soil
- Soil moisture
- Groundwater
Surface water
4,000
700
2,150
1,650
500
1,150
Our country is rich in water wealth in terms of rivers. There are fourteen major river
basins in the country, which occupy 83 percent of total drainage basins, contribute 85
percent of the total surface flow and house eighty percent of the country's population.
They are Brahmaputra, Ganga, Indus, Godavari, Krishna, Mahanadi, Narmada,
Cauvery, Brahmani, Tapi, Mahi, Subarnarekha, Pennar and Sabarmati rivers. Besides,
there are 44 medium rivers and 55 minor rivers. There are also several non-basin coastal
rivers, the lengths of which are small, besides a few rivers, which originate and get lost
in the deserts after traversing some distance. These rivers have been grouped into three
3. 3
categories based on drainage basin area as shown in Table 2. However, most of these
rivers are seasonal and do not carry any water during almost nine non-monsoon months.
Slide 1 Table 2 River basins of India
Category Basin
Area
(km2
)
Number
of Basins
Percentage
of Total
Drainage
Area
Percentage
of Flow
Contribution
Percentage
of
Population
living in
the Basin
Major More
than
20,000
14 83 85 80
Medium Between
2,000
and
20,000
44 8 7
Minor Less
than
2,000
55 9 8
20
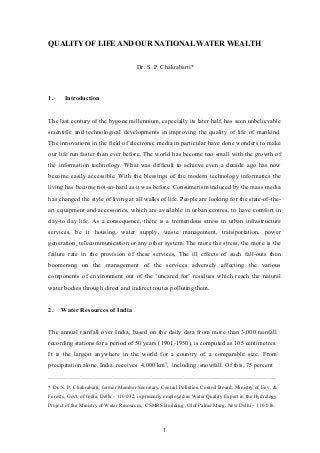
On the contrary, precipitation during monsoon months are too heavy to be stored because
of lack of storage facilities. As a result, we bank too much upon groundwater reserves to
tide over dry season for all developmental activities besides agriculture. Because of over-
exploitation of groundwater, there is a negative water balance between groundwater
withdrawal and recharging of aquifer and the water table is depleting every year due to
over exploitation in most part of the country as depicted schematically in Fig. 1.
To make the situation worse, the wastewaters generated out of domestic and industrial
usages are being discharged into natural water bodies with partial/no treatment causing
concern for availability of potable water. Polluted river water not only contaminates
groundwater by leaching, it also contaminates soil if used for irrigation. Thus the country
is faced with the twin problems arising out of the quest for a better quality of life and the
backlashes of development by not caring for its residues before indiscriminate disposal.
3. Growth of Urbanisation and its Impact
4. 4
The economic growth in the country being city-centric, the country is faced with the
Groundwater River water
abstraction abstraction
for for
drinking, RAINFALL drinking,
industrial & industrial &
irrigation use irrigation use
Wastewater
Surface
Land Refuse dump run-off To sea
River To Sea
GL
Leachate
GWT----------------------------------------------------------------------------------------------------------------------
GW-Recharge Percolation
Pollutants contaminating GW
through leachate GW-
Recharge
Depleting GWT due to
over-exploitation
…………. ……………………………………………………………………………………………..
Abbreviation : GL - Ground level
GW - Groundwater
GWT - Groundwater Table
FIG. 1 SCHEMATIC DIAGRAM SHOWING CONTAMINATION OF
WATER RESOURCES
5. 5
problem of unbridled growth of population in urban centres, specially in the metro cities
for employment opportunities and better living conditions. The urban scenario in terms of
population, water requirement and wastewater generation & treatment, which can be
indirectly correlated with the sanitation status of the inhabitants and also the health of the
natural water bodies, is presented in Table 3. The contents of the Table provide several
interesting revelations as discussed in the following paragraphs.
4.1 Population increase
The decadal growth of population in Class I cities during 1978-79 and1989-90 was 49.3
percent whereas the five yearly increase during 1989-90 and 1994-95 had reached 41
percent and overall growth in 15 years is 111 percent. The trend shows more exodus from
other categories of cities and towns to floc around Class I cities began in early nineties
and the decadal growth in the penultimate ten years of the past millennium would far
exceed the growth rate in the eighties.
4.2 Water supply source
Dependence on surface water (river) source increased from 61 percent in 1978-79 to 73.3
percent in 1989-90, while it declined in the subsequent five years to 39.6 percent. This
may be attributed to increased requirement / demand beyond the discharge carrying
capacity of rivers, uncertainty of water availability in rivers due to fluctuating monsoon
period or degradation of the quality of river water rendering cost of treatment to drinking
water standards unaffordable to municipal bodies. However, it is interesting to note that
dependence on conjunctive use of surface water and groundwater has increased from 3.5
to 52.7 percent for more steady water supply without over-stressing either source. It is
definitely a more considerate approach.
4.3 Water consumption
Water consumption per capita per day was almost steady at around 145 litres, about 10
litres more than the national standard of 135 litres, during 1978-79 to 1989-90. Thereafter
6. 6
there is a sudden increase to 182 litres indicating probably change in life style requiring
more water to cater for the daily needs.
Table 3 Water supply and sanitation status of Class I cities in India
StatusS.
No.
Parameters
1978-79 1989-90 1994-95
1 No. of Class I cities 142 212 299
2 Estimated population 6,02,57,025 10,23,48,951 12,81,13,865
3 Distribution of Class I cities
according to catchment area:
a. Major river basins
b. Non-basin, coastal
c. Non-basin, non-coastal
112
17
13
170
23
19
233
29
37
4 Population distribution of Class I
cities according to catchment area:
a. Major river basins
b. Non-basin, coastal
c. Non-basin, non-coastal
42725526
(71%)
12808602
(21.3)
4660299
(7.7)
74482328
(80.19%)
20613176
(10.85%)
7853447
(8.96%)
97403783
(76%)
23275720
(!8%)
7434362
(6%)
5 Water supply, mld
a. Ground
b. Surface
c. Combined ground and surface
source
8638.48
784.28
(9%)
5261.71
(61%)
2582.49
(30%)
15191.88
3527.77
(23.2%)
11132.75
(73.3%)
531.36
(3.5%)
20545.24
1542.22
(7.5%)
8135.88
(39.6%)
10867.14
(52.9%)
6 Per capita water supply, lpcd 143 147 182
7 Wastewater generated, mld 7006.74 12145.49 15772.50
8 Wastewater collected, mld 4306.67
(59%)
2633.02
(22%)
11693.10
(74%)
9 Wastewater treated, mld 2755.94
(39%)
2485.42
(20.5%)
3740.20
(24%)
10 Wastewater untreated &disposed,
mld
4250.80
(61%)
9660.07
(79.5%)
12032.30
(76%)
Source : Central Pollution Control Board
7. 7
4.4 Wastewater collection
There was slump in collection of municipal wastewaster from 59 percent in 1978-79 to
22 percent which may be due to inability of the local bodies to address to the need of
unpredictable population growth, development of slum areas and / or the financial crunch
of these agencies. However, in the subsequent five years there is marked improvement to
74 percent indicating increasing awareness to sanitation and public pressures on
municipal organisations for better upkeep of the society and increased fund allocation.
4.5 Wastewater treatment and disposal
In spite of the United Nations’ declaration of 1981-91 as the ‘Water & Sanitation
Decade’, wastewater treatment appears to get a lesser priority. The percentage slipped
from 39 in 1978-79 to 20.5 in 1989-90 and remained almost steady at 24. Thus the
figures tell a dismal story that almost 80 percent of wastewater generated in the Class I
cities is discharged into water bodies without any treatment.
4.6 Quality of our water resources
4.6.1 If one could listen to the moaning of our natural water bodies, emotional it could
appear though, one would realise that they are by far neglected by our modern society.
During non-monsoon months the rivers mostly are dry serving as conveyance system for
untreated domestic and industrial wastewater devoid of capacity to dilute or assimilate
the pollution load imposed upon for the benefit of mankind. River is no more the lifeline
of Indian civilisation except to stink. The Brahmanda Purana written in the 8/11th
century
AD prohibited through the following couplet thirteen actions on the river front for the
protection of river water quality of the Ganga:
xaxk iq.;tyka izkI; =;ksn’k footZ;sr~ A 'kkSpekpeua lsda
fuekZY;aPkeu?k"kZ.ke~A
8. 8
xk=laokgua ØhM+ka izfrxzgeFkks jfre~A vU;rhFkZjfrapSo% vU;rhFkZ
iz’kalue~A
oL=R;kxeFkk?kkra laUrkjap fo’ks"kr% AA
“Thirteen actions must be prohibited on arrival at the sacred waters of the Ganga, namely: (1) defecation,
(2) ablution, (3) discharge of water, (4) throwing of used floral offerings, (5) rubbing of filth, (6) body
shampooing, (7) frolicking, (8) acceptance of donations, (9) obscenity, (10) offering of inappropriate
praises or even hymns in an incorrect way, (11) discarding of garments, (12) beating, and (13) swimming
across, in particular.” -- Brahmandapurana
However, the message did not perpetuate through generations resulting in mass abuse of
water bodies.
4.6.2 The Central Pollution Control Board through their modest network of about 500
water quality monitoring stations on main rivers and major tributaries have identified 39
polluted river stretches requiring action programmes for upgradation of water quality.
The picture will be far more alarming if one considers the minor surface water drainage
channels which have virtually turned into open sewers as recipient of untreated domestic
and industrial wastes.
4.6.3 Groundwater is also not spared from the onslaught. More and more reports of
groundwater pollution are pouring in, which are the results of indiscriminate disposal of
municipal solid waste and industrial hazardous wastes on land without any treatment to
cause leaching of contaminants to groundwater reserves. Reports of pumping industrial
wastewater into ground to get rid of the waste are also coming to light. Pollution of
groundwater, which is difficult to treat, is becoming a non-news item as it is prevalent in
several industrial estates in the country,
5. Quality of Life
Defining quality of life is the business of the Social Scientists as it involves several socio-
economic aspects of life. However, in broader terms, the apparent indices in commoners’
language to describe the quality of living look for (1) availability of good infrastructure
facilities in terms of housing, transportation, communication, electric power, water
supply, sanitation, educational institution for children, commercial centres, place for
9. 9
recreation and worship, health care etc., (2) employment opportunity, (3) capacity to
procure daily needs without hardship, (4) healthy family relationship and (5) level of
satisfaction. Urban centres do provide the afore-said opportunities to certain limit of
satisfaction for which there is rapid migration of populace from non-urban areas.
However, the development of the urban centres to the required expectation of the society
is subject to availability of financial resources and prioritisation of needs in case of
stringency. In a society having multi-faceted problems with resource crunch to pay
attention to all the needs with equal interest, it is difficult to allocate higher priorities to
avoidables (!), like waste treatment, river health care. In the 20-Point programme of the
National Government, the standing of ‘Environment’ thus could figure at the seventeenth
spot to provide room for other over-riding priorities.
6. Concluding Remarks
6.1 As a developed nation among the developing ones, India could make long strides in
technological and scientific advancements to improve the quality of life and living, but
the national water resources are dwindling for lack of resources and will to store surface
water during monsoon months to tide over the long dry spell of almost nine months
including the summer, and their quality deteriorating due to ‘uncared for’ abuses which
may assume to be a potential threat to the society in the long run.
6.2 There is a need for reviewing of the National Water Policy for development/
harnessing of surface water resources to meet the increasing water demand and control of
over-exploitation of groundwater and concomitant drastic lowering of groundwater table
due to negative water balance in terms of withdrawal and recharging on annual basis. The
Policy inter alia needs to integrate:
• River flow regulation for minimum discharge to be maintained;
• Imposition of discipline in water abstraction from and discharge of treated
sewage/ trade effluent into river to effect water conservation;
• Waste load allocation to utilise self-assimilation capacity of the rivers instead
of aiming at treatment of waste to pristine quality;
10. 10
• Maximisation of recycling/reuse of treated sewage/trade effluent for irrigation
in the growth of agriculture;
• Proper collection, conveyance, treatment and disposal of municipal sewage
and solid wastes to nature in a sanitary manner so as not to defile the quality of the
water resources;
• Water harvesting; and
• Pricing of potable water supplied and also for treatment of wastewater, for
development of the facilities and sustainability of the services.
Acknowledgement : The author would like to express sincere thanks to Shri Arunodaya Bhattacharjya, IAS,
former Chairman, Central Pollution Control Board, Ministry of Environment & Forests, Govt. of India, and
former Chief Secretary, Govt. of Assam, and Dr. J. G. Grijsen, Team Leader, Hydrology Project, Ministry of
Water Resources, Govt. of India for their encouragement in writing this paper.
----------