Polyphonic images of the city, mapping human landscapes through user generated content
•Download as KEY, PDF•
1 like•864 views


Recommended
More Related Content
Similar to Polyphonic images of the city, mapping human landscapes through user generated content
Similar to Polyphonic images of the city, mapping human landscapes through user generated content (20)
More from Giorgia Lupi
More from Giorgia Lupi (15)
Recently uploaded
Recently uploaded (20)
Polyphonic images of the city, mapping human landscapes through user generated content
- 1. Poliphonic images of the cities: Mapping new human landscapes through User Generated Content Cumulus Helsinki Conference 24-26 May 2012 OPEN INTERACTIVE CITY Giorgia Lupi, Luca Simeone, Paolo Patelli, Salvatore Iaconesi
- 2. Poliphonic images of the cities: Mapping new human landscapes through User Generated Content User Generated Content at the Urban Scale analysing correlating crossing depicting
- 3. twitter geo-referenced tweets, Milan, 15 km gathering analysing integrating depicting (interpreting)
- 4. Information "Contemporary computing systems can track everything in a city except its rats." Richard Prouty
- 5. Information "Contemporary computing systems can track everything in a city except its rats." Richard Prouty In 1990, 2.4 millioncellular subscriptions, people worldwide had and by the end of 2010, the number of mobile cellular subscriptions worldwide reached approximately 4.6 billion.
- 6. Information "Contemporary computing systems can track everything in a city except its rats." Richard Prouty How is technology helping us to better understand some urban phenomena?
- 7. how? "you're not dealing with a 100% of life-logging; they are stories, it's not a transcription of reality, but it's an interesting mapping of something half-way between reality and people's aspirations" Mafe de Baggis why do people share? which people are sharing?
- 8. how? Spatial distribution spatial distributions (clusters and concentration) of the people that wants to share their position.
- 9. how? Spatial distribution Spatial distribution landmarks aggregating data, using images manipulations and video filters as a methodology for finding clusters individuating some LANDMARKS for average weeks.
- 10. Spatial distribution landmarks aggregating data, using images manipulations and video filters as a methodology for finding clusters individuating some LANDMARKS for average weeks.
- 11. Spatial distribution macro-areas aggregating data, using images manipulations and video filters as a methodology for finding clusters individuating MACRO AREAS
- 12. temporal distribution the possibility to depict the city as it EVOLVES through times
- 13. temporal distribution the possibility to depict the city as it EVOLVES through times (design week)
- 14. temporal distribution the possibility to depict the city as it EVOLVES through times
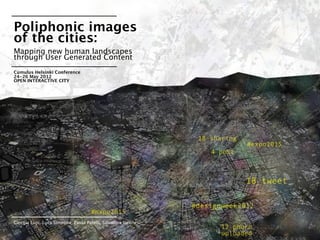
- 15. groups within the city differences between how Italians, english, spanish or even the emergent spoken languages use the city in terms of temporality and spatial distribution.
- 16. groups within the city differences between how Italians, english, spanish or even the emergent spoken languages use the city in terms of temporality and spatial distribution.
- 17. groups within the city differences between how Italians, english, spanish or even the emergent spoken languages use the city in terms of temporality and spatial distribution.
- 18. groups within the city differences between how Italians, english, spanish or even the emergent spoken languages use the city in terms of temporality and spatial distribution.
- 19. the temporary city? difference between the spatial distribution of people during the different times of the day, measuring the rhythm of the city.
- 20. 0.00 . 3,00 am the temporary city? difference between the spatial distribution of people during the different times of the day, measuring the rhythm of the city.
- 21. 3.00 - 6.00 am the temporary city? difference between the spatial distribution of people during the different times of the day, measuring the rhythm of the city.
- 22. 6.00 - 9.00 am the temporary city? difference between the spatial distribution of people during the different times of the day, measuring the rhythm of the city.
- 23. 9.00 - 12.00 am the temporary city? difference between the spatial distribution of people during the different times of the day, measuring the rhythm of the city.
- 24. 0.00 - 3.00 pm the temporary city? difference between the spatial distribution of people during the different times of the day, measuring the rhythm of the city.
- 25. 3.00 - 6.00 pm the temporary city? difference between the spatial distribution of people during the different times of the day, measuring the rhythm of the city.
- 26. 3.00 - 6.00 pm the temporary city? difference between the spatial distribution of people during the different times of the day, measuring the rhythm of the city.
- 27. 6.00 - 9.00 pm the temporary city? difference between the spatial distribution of people during the different times of the day, measuring the rhythm of the city.
- 28. 9.00 - 12.00 pm the temporary city? difference between the spatial distribution of people during the different times of the day, measuring the rhythm of the city.
- 29. sentiment analysis and spatial patterns? analysing contents
- 30. This is the visualization of emotional citizens' reaction to specific political events
- 31. (1) querys on geo-localized tweets selection: Monti MarioMonti premier government liberalization taxi taxi-driver strike traffic diseases public services reform reforms crisis
- 32. (1) querys on (2) sentiment geo-localized analysis tweets selection: conversational analysis engine Monti MarioMonti discovering premier feelings foe each government contribution liberalization taxi taxi-driver > strike traffic general mood diseases neutral public services positive reform negative reforms crisis > advanced analysis anger surpirse fear anticipation acceptance sadness joy disgust
- 33. (1) querys on (2) sentiment (3) geographical geo-localized analysis pattern? tweets selection: conversational * average negative reaction analysis engine (more neutral in the outskirts) Monti MarioMonti discovering * disappointment along premier feelings foe each touristic routes and city government contribution landmarks liberalization (visitors and taxi users?) taxi taxi-driver > * ironic hastags strike #menotaxipertutti traffic general mood diseases neutral public services positive reform negative reforms crisis > advanced analysis anger surpirse fear anticipation acceptance sadness joy disgust
- 34. This is the visualization of emotional citizens' reaction to specific political events
- 35. visualization as a medium for patterns extraction
- 36. how to make those data worth? identify specific area of interests
- 37. identify specific area of interests Political feeling toward local Attitudes acceptance, policies and urban interventions: understanding how new urban policies and infrastructures are evaluated and being able to plan new public services for specific groups and places
- 38. identify specific area of interests Behavioral Mechanisms discovering possible emergent programs, structures and bottom-up initiatives responding to uncovered needs and desires as well as predicting gentrification areas and patterns of use of the city
- 39. identify specific area of interests Places identities and relationships delimitation of territories, links between areas, emergent nets and relationships and connections between places, people and uses
- 40. identify specific area of interests Perceived well-being/ Livability perceptions related to alyzing users’ specific geographic areas and providing attractivity and urban qualitative indicators to compare diverse zones;
- 41. identify specific area of interests Temporary events understanding how people, distributions, emotions and uses changes over the time, relating contributions to specific events, periods or situations.
- 42. how to make those data worth? identify specific area of interests + domains of applications
- 43. how to make those data worth? identify specific area of interests + domains of applications tourism temporary inhabitants profile, patterns of mobility, needs and desires)
- 44. how to make those data worth? identify specific area of interests + domains of applications tourism temporary inhabitants profile, patterns of mobility, needs and desires) planning the cultural offer of the city named together with which places are ontologies related to culture, emergent local and global net of places related to cultural activities, cultural influencer
- 45. how to make those data worth? identify specific area of interests + domains of applications temporary citizens where they are, who they are, how they use the city tourism temporary inhabitants profile, patterns of mobility, needs and desires) planning the cultural offer of the city named together with which places are ontologies related to culture, emergent local and global net of places related to cultural activities, cultural influencer
- 46. mobility how to make patterns time based analysis on those data worth? fluxes and pattern of mobility of certain groups of people within metropolitan identify specific area of interests and urban areas + domains of applications temporary citizens where they are, who they are, how they use the city tourism temporary inhabitants profile, patterns of mobility, needs and desires) planning the cultural offer of the city named together with which places are ontologies related to culture, emergent local and global net of places related to cultural activities, cultural influencer
- 47. Poliphonic images of the cities: Mapping new human landscapes through User Generated Content Cumulus Helsinki Conference 24-26 May 2012 OPEN INTERACTIVE CITY Giorgia Lupi, Luca Simeone, Paolo Patelli, Salvatore Iaconesi
- 48. giorgialupi.net
Editor's Notes
- - I'm Giorgia Lupi,\nI'm attending a PhD in Design at Milan Politecnico.\n\nPolyphonic images of the cities is a series of experiments on listening to collective digital traces, \nfocusing on user generated content. \nI'm carrying this research together with Informatics experts, and Urban Planners.\n\nThe paper we submitted at the conference tells about a precise experiment we've done within a more complex research project that I'll introduce.\nRather than presenting here just one experiment in depth,\nwe thought it would have been more useful and interesting to introduce you the different opportunities that we're finding analysing and depicting those information.\n
- - Our research is trying to understand how to properly analyse User Generated Content at the Urban scale for providing citizens, planners, decision makers \n- and private stakeholders as well - \nwith important insights about how people live, use and perceive the city.\n\nThe research is prototyping different experiments particularly focused on the city of Milan in Italy where we have the possibility to confront our work with urban experts.\n\n
- - At the moment we're gathering geo-referenced data from Twitter\n(we mean all the contributions that is possible to geo-localize) \nwithin 15 km from the center of Milan through the API that Twitter provide, \n\nand we're storing them into a database that we then inquire time by time.\n\nWe're studying how inquire those data; \nhow to interpret them,\nhow to integrate them with other sources of information at hand,\n\nand how to properly use visualization to make knowledge emerge from such information.\n
- - Of course, we started this research because today information is at the core of our everyday life.\nTalking of urban environment, I think that this sentence of Richard Prouty \n"contemporary computing systems can track everything in a city, except its rats"\ncan give us back the idea of how many information are everyday around us.\n\n\n
- Millions of people now wander the streets of the world’s cities \nsnapping photographs, sending messages, conducting Internet searches \non hand-held devices.\nThese activities can be stamped with precise geo-positioning data, \nthey can be processed, stored, and used,\nbecause they are public.\nThe number of mobile phones subscriptions worldwide has increased dramatically in last years, \nas you can see from the numbers.\nA recent news stated also that Facebook has now more users that share by mobile phones than user sharing by desktops. \nThe number of geo-localizes contributions is increasing in parallel with the smartphones diffusion.\nSo more and more we're sharing while moving, while experiencing the city with its public places - public services, commercial services; actually talking about that on social media.\n\n
- - But do these technologies give us a better view of the city than the one we can experience everyday on the public spaces? \nHow is technology helping us to better understand urban phenomena?\n\n\n
- - First of all, information has to be understood for the very nature of the data we gather..\nWhy do people share? which people is sharing? Is it really possible to extract urban knowledge out of that?\nA social media expert that I'm constantly interviewing remarked that the terrific things with User generated contents, \nis that:\n"you're not dealing with a 100% of life-logging; \nwhat you find it's not a transcription of reality, \nbut it's an even more interesting mapping of something half-way between reality and people's aspirations"\n\n\n
- - Since the very nature of the data / which have a precise localization / \nwe can analyze the city in terms of spatial distributions (clusters and concentration) \nof the people that actually share not only contents but their position. \nproviding alternative images of how the public spaces in Milan are used and lived.\n\n
- aggregating data, using images manipulations and video filters \n(as a new methodology for a first discovering of clusters), \nwe could isolate the places from which the most contributions comes from;\n\n
- - and this helps us individuating some NEW CITY LANDMARKS \nwhich are a very interesting information.\nWe’re finding that of course the Touristic Attractions of the city are part of them;\nbut we also found a lot of train stations, \nthe University Campus, \na huge concentration of shopping places, \nand also some interesting others, like a very peripheral IKEA store, or a famous Television company place.\n\n\n
- - we can also find information about macro-areas,\nand compare residential areas \nwith commercial areas \nwith financial areas,\n\nand finding also the empty places,\nplaces from which people actually don't share, \n(that we found on avergae in Milan are pheripherical areas, \nfinancial districts, \nresidential zones and actually parks!)\n
- - then, we can monitor the distribution of people during specific events, and this is very promising. \n- Those data gives us the possibility to depict the city as it EVOLVES through times;\nand so to compare average weeks (weeks where no special events are taking place), \nwith special weeks \nanalyzing how Landmarks, areas and fluxes changes when something happens in the city:\n
- Here you can see contributions during the past edition of Design Week,\nwhich is a quite important event in Milan, \nwe can compare the clusters of people the week before and after, \n
- and discover if effectively the places where people go \nare the ones that we expected (the actual areas with planned events); and in case compare them;\n\nor if we can also notice emergent areas we didn’t expect.\n(and we found some!)\n\n
- - Moreover:\nthe nature of the data allow us to easily discover profiles out of them, \nWe here splitted and plotted contributions according to the different language with which people posted.\n...understanding if there are differences between how Italians, english, spanish or even the less diffused spoken languages use the city.\n\nthis is the design week and we actually found several differences in terms of where and when different groups are actually sharing their position. \n
- here you can see italians in blue which we found are really much more “diffused” even in pheripherical and residential areas;\n\n
- then english (in green) which seems to be concentrated on particular zones \n(here is the design week again); where effectively we know that events are planned.\n
- and spanish people, that are not much effectively but the areas where they post from are designing some interesting clusters around specific places.\n\n(*we’re anonimizing contents and experimenting on how much of these contents come from a singular user or are effectively showing a collective part of the city)s\n\n
- Then as I introduced, \nwe can plot on the map contributions shared in different hours of the day, \nmeasuring the rhythm of the city.\nwhere do people are in the morning?\nwhere is the sedimentation of the city at lunch break \nif we aggregate contributions made in different days but at the same time?\n(each query and visualization has to be done with a precise aim in mind)\n
- So here and in the following images you can see the aggregation of the same time-period of 3 hours,\nevery day, during several days of the week.\n\nstarting from 0 to 3 a.m, this is the sedimentation of the first hours of the day-city\n
- then from 3.00 to 6.00..\n
- and you now can see that in the morning, in the upper left corner something is lighting up\n
- which is actually the fair, and so the main attractor of this event which was the deisng week\n
- which is nice, because the architecture consists of a central corridor with side pavillons\n
- and we can really recognize the central corridor even by looking at the tweets!\n
- here’s a zoom\n
- and then slowly the people move back to the city and gather where the night events are,\nat the end of the afternoon.\n
- of course there's some macro phenomena that are basically confirmed:\n*places full of offices that lights up during the day;\n*places where everybody knows that clubs are; pop up at evening;\n*but there's also small emergent zones and areas that reveals themselves at lunch break, \n* or small commercial areas that everyday pulse in peripheral contexts,\nAnd of course these clusters changes during specific events.\nAnd we can imagine to inquire those data comparing weekly days and weekends;\n\n
- - Then Even if it's at an early stage regarding italian language, we can consider to analyze also the content of those contributions. \nand to extract not only the main topics from the contributions, \nbut also to provide a sentiment analysis of that, trying to return the feelings that people share through their texts.\n- Sentiment analysis is now used for analyzing social media contributions or digital texts in many fields;\nBut our question was: could we also find any spatial pattern out of them?\nIs there any spatial pattern within the sentiment that people shared regarding to a specific topic / issue or event we may ask for?\n
- - And here is Visualizing the Crisis, the experiment we presented in detail in the paper.\nThis is the visualization of emotional citizens' reaction to a specific political events \n(you know the instable political situation in Italy) in Rome.\nIn this image you can see the geographical distribution of feelings related with a wide strike of taxi drivers \nthat caused a lot of traffic deseases in January 23, 2012.\n\nThe drivers protest against a liberalization of the market\nthat the government proposed as one of the key reforms to contain the effects of the economical crisis.\n\n
- - We carried some queries on geo-localized twitters within the city of Rome (which has been the most affected one), selecting only the contributions that contained a list of keywords related to the event:\npremier Monti, government, liberalization, taxi , taxi drivers, strike, public services, reform;\n
- - Then we provided a sentiment analysis with a conversational analysis engine we're developing, \nthat gives us 2 kind of results on the same dataset:\n\n- a first analysis gave us the general mood (positive negative neutral)\n- and a second experimental analysis gave us more detailed results \n(is the negative anger or fear? sadness or disgust? is the positive acceptance or joy or surprise? )\n\nSince the italian language translator is at the early stage we then checked the results manually.\nAnd we're actually improving the algorithm of the machine.\n\n\n
- - Plotting datasets on the map, and comparing results for the whole day\nwe tried to understand if there was any emergent geographical outcome out of them.\n\n- We noticed an average negative reaction, regularly spread across the city, \nthat was slowly fading to more neutral feelings from the center towards the outskirts.\n- Higher concentrations along tourist routes and city landmarks suggested disappointment especially among visitors and taxi users, as if the negative feelings were directed towards the strike itself \nother than the government and the reforms. \n- Furthermore, the research highlighted the usage of specific ironic hashtags (e.g. #menotaxipertutti) wiich could be translated as "lesstaxiforeverybody" related to the negative UGCs and addressing the strike as a source of disaffection.\n
- - We then repeated the test making some more experimental visualizations in order to enlighten areas and not just singular clusters of contribution.\n\nAnd so yes, we understood that it's eventualluy possible to detect spatial patterns out of sentiments spreading.\nWe are currently refining the platform in use with linguistical experts \nto be sure we would be able to select the contributions not just manually,\nbut through more complete ontologies built around the topic we want to ask for.\n
- - VISUALIZATION AS A MEDIUM FOR EXTRACTING PATTERNS\nOf course choosing a proper visualization method is the only possibility we have to deal with these amount of information; - through the visualization we can extract patterns that we could not do with a huge excel file full of data in front of us.\nBut we have to choose the proper visualization methods\n\nAs an example, here with this video you can see contributions that pops up in real time, through this dynamic image. Which is quite suggestive but it's not always the best way to interact with this information.\nThis method is useful if we want to inquire where people share in a very specific moment.\n\nOtherwise we should think in terms of sedimentation, as you saw in the images before, choosing for different purposes if we want o sediment a whole day of contribution, a whole week, a time period of 3 hours or of 1 hour, and so on;\n\nwe're also actually buiding a platform which can allow user to easily inquire the database and plot results on the map; \nand for doing this we're talking with actual different stakeholders to see their possible needs in terms of knowledge.\n
- the nature of the data we have, allow us to identify specific area of interest within the Urban Planning field.\n\nWe're currently analyzing all the clusters I presented:\ntogether with city expert we're understanding what are the most important questions \nthat might be partially answered; and also with matemathics and statistics we’re understanding how to analyze them.\n\n
- The first months of research enlightened a few area of particular interest on those data:\n- Political Attitudes: measuring acceptance, feeling toward local policies and urban interventions:\n
- - Behavioral Mechanisms: discovering possible emergent programs, structures and bottom-up initiatives responding to uncovered needs and desires as well as predicting gentrification areas and patterns of use of the city;\n
- - Places identities and relationships: which places people recognize as center, or as a neighborhood and which ones not? which places are linked together in the mind of users?\n\n
- - Perceived well-being/Livability: alyzing users’ perceptions related to specific geographic areas and providing attractivity and urban qualitative indicators to compare diverse zones;\n
- - Temporary events: understanding how people, distributions, emotions and uses changes over the time, relating contributions to specific events, periods or situations.\n\n
- FURTHERMORE\nTo narrow even more, due to the profile of the people that actually use Social Networks, \n(quite young as an average; active on-line; a good part of users' travels regularly…) \nthe most promising domains of applications could be summed as follows:\n
- - tourism (who are the temporary inhabitants? which is their profile? what are they needs and desires? how do they use the city?)\n
- - planning the cultural offer of the city (which places are named together with ontologies related to culture, emergent local and global net of places related to cultural activities, cultural influencer);\n
- - temporary citizens (are there any emergent ethnic group we can not easily measure with the census? who they are, where they are, how they use the city,)\n
- - the understanding of mobility patterns (and as we said, we can produce time based analysis on fluxes and pattern of mobility of certain groups of people within metropolitan and urban areas);\n\n\n\n
- - Basically this is our research direction,\nThe work is carried on by us from Density Design Lab (we deal with data visualization of complex phenomena and my PhD Thesis is on analyzing and visualizing digital traces at the urban scale);\nthen Paolo Patelli is from Urban Planning Department of Milan Politecnic as well;\nLuca Simeone is an anthropologist form Malmoo University\nSalvatore Iaconesi is an artist and programmer at La Sapienza Unveristy Rome\n\n
- if you’re interested in the background, the methodology or to see more developments you can check us at:\ngiorgialupi.net\n\n\n