Busan City Gas investment recommendation and business analysis
1. 1
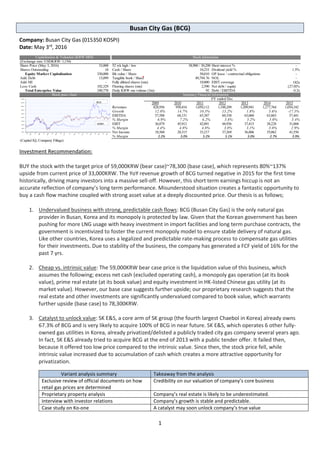
Busan City Gas (BCG)
Company: Busan City Gas (015350 KOSPI)
Date: May 3rd
, 2016
Investment Recommendation:
BUY the stock with the target price of 59,000KRW (bear case)~78,300 (base case), which represents 80%~137%
upside from current price of 33,000KRW. The YoY revenue growth of BCG turned negative in 2015 for the first time
historically, driving many investors into a massive sell-off. However, this short term earnings hiccup is not an
accurate reflection of company’s long term performance. Misunderstood situation creates a fantastic opportunity to
buy a cash flow machine coupled with strong asset value at a deeply discounted price. Our thesis is as follows;
1. Undervalued business with strong, predictable cash flows: BCG (Busan City Gas) is the only natural gas
provider in Busan, Korea and its monopoly is protected by law. Given that the Korean government has been
pushing for more LNG usage with heavy investment in import facilities and long term purchase contracts, the
government is incentivized to foster the current monopoly model to ensure stable delivery of natural gas.
Like other countries, Korea uses a legalized and predictable rate-making process to compensate gas utilities
for their investments. Due to stability of the business, the company has generated a FCF yield of 16% for the
past 7 yrs.
2. Cheap vs. intrinsic value: The 59,000KRW bear case price is the liquidation value of this business, which
assumes the following; excess net cash (excluded operating cash), a monopoly gas operation (at its book
value), prime real estate (at its book value) and equity investment in HK-listed Chinese gas utility (at its
market value). However, our base case suggests further upside; our proprietary research suggests that the
real estate and other investments are significantly undervalued compared to book value, which warrants
further upside (base case) to 78,300KRW.
3. Catalyst to unlock value: SK E&S, a core arm of SK group (the fourth largest Chaebol in Korea) already owns
67.3% of BCG and is very likely to acquire 100% of BCG in near future. SK E&S, which operates 6 other fully-
owned gas utilities in Korea, already privatized/delisted a publicly traded city gas company several years ago.
In fact, SK E&S already tried to acquire BCG at the end of 2013 with a public tender offer. It failed then,
because it offered too low price compared to the intrinsic value. Since then, the stock price fell, while
intrinsic value increased due to accumulation of cash which creates a more attractive opportunity for
privatization.
Variant analysis summary Takeaway from the analysis
Exclusive review of official documents on how
retail gas prices are determined
Credibility on our valuation of company’s core business
Proprietary property analysis Company’s real estate is likely to be underestimated.
Interview with investor relations Company’s growth is stable and predictable.
Case study on Ko-one A catalyst may soon unlock company’s true value
Share Price (May 3, 2016) 33,000 52 wk high / low 38,900 / 30,200 Short interest % -
Shares Outstanding 10 Cash / Share 10,233 Dividend yield % 1.5%
Equity Market Capitalization 330,000 Bk value / Share 50,010 OP lease / contractual obligations -
Add: Debt 13,099 Tangible book / Share 49,794.76 NOL -
Add: MI - Fully diluted shares (mn) 10,000 EBIT coverage 182x
Less: Cash 102,329 Floating shares (mn) 2,590 Net debt / equity (27.0)%
Total Enterprise Value 240,770 Daily KRW mn volume (3m) 92 Debt / EBITDA 0.2x
2009 2010 2011 2012 2013 2014 2015
Revenues 828,956 950,416 1,050,112 1,188,209 1,209,941 1,277,764 1,054,182
Growth 12.0% 14.7% 10.5% 13.2% 1.8% 5.6% -17.5%
EBITDA 57,588 68,151 65,387 69,338 63,060 63,863 57,441
% Margin 6.9% 7.2% 6.2% 5.8% 5.2% 5.0% 5.4%
EBIT 36,879 45,912 42,091 44,936 37,415 38,228 31,004
% Margin 4.4% 4.8% 4.0% 3.8% 3.1% 3.0% 2.9%
Net Income 18,560 28,315 33,217 37,269 36,806 35,062 41,556
% Margin 2.2% 3.0% 3.2% 3.1% 3.0% 2.7% 3.9%
(Capital IQ, Company Filings)
FY ended Dec
Capitalization & Valuation (KRW MM) Stock information
(Exchange rate: USDKRW: 1,154)
Stock price chart Summary Financial Information
BCG
KOSPI
2. 2
BCG Business Brief
Busan City Gas Company Limited ("BCG") is a city gas distributor with an exclusive concession to supply natural gas in
Busan. For the year ending in December 31, 2015, the company had pumped nearly 56 billion MJ of heat to more
than 1.2 million homes and 950 factories with no single consumer occupying more than 10% of its revenues. The
company is the only listed and partially owned (67.32%) city gas subsidiary of SK E&S, a holding company that
specializes in gas distribution, power generation, and overseas energy businesses.
1. Business mix:
a. Retail natural gas distribution (90% of revenue, 72% of operating income), compressed natural gas
(CNG) fuelling stations (9% of revenue, 7% of operating income), and real estate rental (0.6% of
revenue, 19% of operating income). Company expects continued, albeit slow growth in sales volume
from retail distribution going forward as it seeks to raise the current penetration rate1
of 84.6%
(compare to Seoul’s 95%) to 94.3% by 20212
.
b. Other operations: Since 2014, the company has pushed forward plans to diversify into related utility
businesses, such as a cogeneration plant and a fuel cell generator. When completed, the two utilities
will provide heat and electricity to about 64,000 households, which is only about 5% of the number
of city gas users. These operations are relatively small and disclosure is limited at their initial stage.
Revenue breakdown in 2015 (%) OP breakdown in 2015 (%)
(Source: Company)
2. Geographical mix:
a. Location mix: Busan (100%). BCG holds an exclusive right to distribute city gas (LNG) in Busan.
Busan City Gas’s area of operation
(Source: Google Maps, Art Busan 2015)
1
Penetration rate is defined as the number of households that use city gas divided by the total number of households within the
area a company serves.
2
(Busan Metropolitan Council, 2015)
90%
9% 1% 0%
City gas CNG Real estate Others
71%
7%
19%
3%
City gas CNG Real estate Others
3. 3
b. Customer mix: In 2014, there were about 1.18 million consumer units using city gas. Of these, 96%
were residential (homes), 3.9% were commercial (offices, stores, public and private institutions), and
0.1% were others, including industrial (factories, manufacturing plants), transportation (gas fueling
stations) and power plants. In terms of heat consumption, however, the breakdown is quite
different due to different energy consumption per unit: 43% from residential households, 15% from
commercial users, 30% from industrial consumers, and 9% from gas fuelling stations.
Consumer breakdown (%) in 2015 Annual consumption by consumer class
(Source: Company)
3. Distribution channel (100% retail model): All Korean city gas companies purchase gas entirety from the sole
wholesaler in the nation, Korea Gas Company (KOGAS). There is little supply shortage risk as KOGAS has a
portfolio of mid to long term contracts for importing liquefied natural gas (LNG). However, given that the
wholesale gas price closely follows oil prices, there is a wholesale gas price risk which impacts BCG’s COGS.
The fluctuating price is one of main determinants of city gas demand, but company’s bottom line is
somewhat shielded from the risk by government policy (authorized monopoly) and sticky demand, as
discussed below.
4. Business model:
City gas and CNG fueling stations: Retail gas and fueling prices are designed so that COGS and operating
expenses are completely passed onto consumers, while guaranteeing utilities a ‘predetermined’ or ‘allowed’
return (please refer to our appendix section for further detail on allowed return and rate making process in
Korea). According to the Principles of City Gas Ratemaking guidelines, regulators annually review and
determine retail rates based on factors such as company’s operating expenses and CAPEX plans, projections
of future consumption and economic conditions.
Price structure of retail city gas – Allowed return is only a small portion of total gas cost to consumers
(Source: Reports on City Gas Ratemaking in Busan, Company)
96%
4%
Residential
Commercial
Industrial
Transportation
Power plant
0
5,000
10,000
15,000
20,000
25,000
30,000
MILLIONMJ
2013 2014 2015
0 5 10 15 20 25
2013
2014
2015
RATE IN KRW PER MJ
COGS (KOGAS) Operating expenses Allowed return
Wholesale rate Retail rate
4. 4
5. Cost breakdown: Cost related to retail gas distribution and fueling stations is entirely passed through to
consumers. Natural gas purchased from KOGAS at wholesale account for more than 90% of total cost. The
remainder is operating expenses, or SG&A. Breakdown of SG&A in 2015 is as follows: service fees (33%) /
labor (28%) / depreciation and amortization (27%) / others (12%). Service fees are paid out to city gas
customer service centers that conduct safety inspection, read and maintain meters, deliver bills, etc.
Depreciation is incurred on fixed investments, most of which are pipelines.
Cost breakdown – Total Cost breakdown – SG&A
(Source: Company)
6. Historical financials - Past 8-year CAGR (Revenue 5% / GP 3% / OP -1% / NP 8%): As price of wholesale gas
price spiked in 2014, BCG’s revenue also peaked in 2014. Revenue trend follows that of COGS which is
basically price of wholesale natural gas multiplied by its volume. According to investor relations, BCG is in
the maturity phrase, and there will not be a significant change in its rate base (cumulative investments plus
working capital). In FY2015, OP dropped 19% year over year, but net profit was up 19% due to profits in the
amount of 17.8 billion KRW earned from equity investments.
YOY growth of revenue, OP and NP Operating profit by segment
(Source: Company, Capital IQ)
-30%
-20%
-10%
0%
10%
20%
30%
40%
50%
60%
2008 2009 2010 2011 2012 2013 2014 2015
Revenue OP NP
-20%
0%
20%
40%
60%
80%
100%
2008 2009 2010 2011 2012 2013 2014 2015
City gas CNG Real estate Others
5. 5
Industry Background – Importance of LNG in Korea
Background
1. Poor in resources: South Korea is very poor in natural resources. The only energy resource embedded in
Korea is a small amount of coal.
2. Need for gas distribution: Korea had depended heavily on oil imports for energy supply until the 1970s.
When the two oil shocks struck a critical blow to its economy, Korean government realized the need to
actively diversify its energy mix. Thanks to government's effort to be less oil-dependent, the city gas industry
as we know it today was born.
3. Blueprint: The Urban Gas Business Act of 1978 is the basis for the city gas industry’s market structure, price
regulations, safety management and supervision.
4. City gas refers to a broad scope of fuels provided by a regional distributor, but over time it has become
synonymous with liquefied natural gas (LNG).
Supply chain
1. Wholesale distributor: In the city gas industry, Korean Gas Corporation (KOGAS) is the sole wholesaler of
LNG, importing it from areas like the Middle East and Southeast Asia. At the receiving terminal, LNG is
regasified, processed and distributed through high-pressure main pipelines to regional retailers.
2. Retail distributors or city gas companies take natural gas from KOGAS, adjust fuel pressure at regulating
stations and deliver it to end-users through pipelines.
A. The retail gas distribution is a public service concession. Therefore, city gas companies are regional
monopolies with high barriers to entry.
B. Distributors are responsible for constructing and maintaining branch pipelines, enforcing safety
measures, and providing customer service within their districts. In addition the utilities often operate
fuelling stations for compressed natural gas (CNG) vehicles.
3. Consumers: There are three classes of end-users categorized by gas usage: residential (heating and cooking),
commercial (restaurants, retail outlets and offices), and industrial (manufacturing plants, factories).
Industry supply chain
(Source: SK E&S)
6. 6
Industry Growth
1. During the 1990s, the city gas industry grew rapidly from tailwinds of favourable government policies and
low consumer penetration. The Basic Plan for Nationwide LNG Distribution of 1990 set out the government
initiative to turn mere strands of gas pipelines into a dense network, adding more than 1,300 km in the
decade3
.
National natural gas pipeline network in 1989 National natural gas pipeline network in 2014
(Source: Ministry of Trade, Industry and Energy))
In 1982, there were only 3 city gas companies nationwide. The number of retail LNG distributors rose to 19
by 1998 and has plateaued at 30 since 2005. During the period from 1992-2014, national penetration rate
more than tripled from 22% to 79.4%. On the other hand, total consumption of city gas went up almost
hundredfold from 184,000 tons in 1998 to 18.2 million tons by 2014.
National city gas penetration rate Consumption of natural gas by usage
(Source: Korea City Gas Association, Korea Energy Statistics Information System)
3
(National Archives of Korea, 2015)
0%
10%
20%
30%
40%
50%
60%
70%
80%
90%
0
5
10
15
20
25
30
35
40
45
1988
1990
1992
1994
1996
1998
2000
2002
2004
2006
2008
2010
2012
2014
MILLIONTON
City gas Power generation District heating
7. 7
Competitive landscape
1. As of the end of 2015, there were 33 city gas retailers nationwide (including 3 LPG distributors), supplying a
total of 931,217 million MJ. Each company holds an exclusive concession in its city or province. There are 7
gas utilities in Greater Seoul Metropolitan Area (Seoul, Gyeonggi and Incheon), each one of them a regional
monopoly without any overlap. Therefore, there is little to no competition among utilities.
SK E&S, a holding company of 7 gas utilities including BCG, has the largest market share at 22.5%.
Top ten city gas companies of 2015
Utility Area
Sales Volume
(million MJ)
Market Share (%)
Number of consumers
(households)
Samchully Gyeonggi, Incheon 156,580 16.8 2,890,694
Seoul City Gas Seoul, Gyeonggi 81,024 8.7 2,252,831
Kyungdong City Gas Ulsan 77,337 8.3 528,027
Ko-won ES1
Seoul, Gyeonggi 66,623 7.2 1,429,343
Busan City Gas1
Busan 55,910 6.0 1,279,180
Yesco Seoul, Gyeonggi 55,278 5.9 1,253,452
Daesung Energy Daegu, Gyeongsan 45,870 4.9 1,031,769
Kyeongnam Energy Gyeongnam 38,198 4.1 663,948
Daeryuen ES Seoul, Gyeonggi 37,816 4.1 848,273
Joongbu City Gas Sejong, Chungnam 36,047 3.9 456,037
Subtotal 650,683 69.9 12,633,554
Others (23) 280,534 30.1 4,698,457
Total 931,217 100 17,332,011
SK E&S (holds 7 gas utilities) Approx. 210,000 22.5
1 Subsidiary of SK E&S
(Source: Korea City Gas Association)
2. As we have already discussed, a city gas utility’s earnings are stable and guaranteed by government policy;
i.e. they are a function of rate base (invested capital plus working capital) and allowed rate of return. For the
sake of providing a comprehensive overview, we will discuss factors that affect sales volume below.
3. Climate, or the number of heating degree days, is the major determinant of residential and commercial
natural gas consumption. Warmer climate means less consumption of city gas. Thus residential and
commercial demand is cyclical and concentrated in the period from October to March.
This is one of the reasons why gas prices in Busan, the southern port city, are third highest among the
nation’s seven metropolis. Per length of pipelines invested, BCG distributes a smaller sales volume relative
to other cities which are colder. To offset the economic impact coming from smaller volumes, BCG charges
higher prices. For example, although BCG sells less gas than Ko-one (colder locations than BCG), it generates
a slightly higher gross profit than the latter due to higher prices.
Korea’s seven metropolitan cities as of July 1, 2014
City
Average retail city gas rate
(KRW / MJ)
Average temperature
(degrees Celsius)
Total consumption
(million MJ)
Daejun 2.1443 13.0 4,255
Gwangju 2.0323 13.8 3,535
Busan 1.9398 18.9 7,558
Daegu 1.9289 14.1 5,515
Seoul 1.4607 12.5 30,983
Incheon 1.2549 12.1 8,783
Ulsan1 0.6866 19.2 12,060
1 Ulsan’s large industrial demand, which accounted for 84.8% of total consumption in 2014, makes its distribution very economic.
(Source: 2014 Report on City Gas Ratemaking in Busan, Korea Meteorological Administration, Korea City Gas Association)
8. 8
4. Industrial consumption of city gas is affected less by climate than that of residential or commercial. Instead,
it is mainly driven by economic growth rates, industry-specific shocks and relative energy prices.
From 2009 to 2013, consumption of industrial city gas climbed at a CAGR of 14.2%. All of a sudden in 2014,
it dropped 10.2% for the first time since 2000. Researchers at the Korea Energy Economics Institute (KEEI)
explain that the prolonged growth from 2009 to 2013 followed by a rapid fall in industrial demand in 2014
was due to cost competitiveness of alternative fuels (i.e., cost of oil compared to gas hit new lows in 2014
and 2015)4
.
Consumption of natural gas vs. Cost of oil relative to gas
(Source: Tandem, Korea City Gas Association, Korea Energy Statistics Information System)
4
(ParkMyungduk & LeeSangyeol, 2015)
0.00
0.20
0.40
0.60
0.80
1.00
1.20
1.40
0
50
100
150
200
250
300
350
400
450
2000 2001 2002 2003 2,004 2,005 2,006 2007 2008 2009 2010 2011 2012 2013 2014 2015
RATIO
BILLIONMJ
Consumption of industrial city gas Relative price (price of Bunker C oil / price of industrial natural gas)
9. 9
Investment thesis #1: Good business with fruitful cash flow generation
BCG’s core business has several moats and advantages:
1. BCG is a regional monopoly, shielded from any new competitors. Due to heavy capex incurred by these
players and inefficiency of capital it would create if there was a new entrant, government guarantees that
there are no new competitors.
2. Also, due to predictable nature of BCG’s cash flows guaranteed by the government (a function of rate base
and allowed rate of return), the company can generate a stable and reliable cash flows going forward. For
the past 7 years, the company has generated a FCF yield of 16%.
3. Utilities generate stable and predictable cash flow and so most other utilities use heavy leverage to
maximize their ROE’s. However, BCG paid off all of its debt in 2014, and currently sits on huge cash balance
(more than 30% of market cap). SK E&S may have many other ways to increase ROE by increasing leverage.
FCF and dividend yields (Definitions in footnote)
(Source: Our Valuation)
*FCF = OCF – capex * FCF yield = FCF / (market cap + net debt) *Dividend yield = dividend / market cap
Another way to look at BCG’s cash generating power is shown below. From 2008 to 2015, BCG managed to generate
strong operating cash flow, spending the proceeds in capex, purchase of investments and payout of dividends, while
increasing its rate base by 14.7%.
Cash allocation from 2008 - 2015
(Source: Capital IQ)
5%
15%
19%
20%
10%
-19%
18%
5%
0%
5%
5%
4%
3%
2%
2009 2010 2011 2012 2013 2014 2015
FCF yield Dividend yield
10. 10
Investment thesis #2: Dirt cheap vs. intrinsic value
Bear case valuation or minimum floor price is much higher than market price
Because BCG is a pretty straightforward gas utility, it is rather easy to value. Below, we conducted a SOTP valuation
of BCG’s gas utility operation and its non-operating assets. We used very conservative liquidation values for the bear
case scenario.
(in mm KRW, except per share value)
1. Rate base: BCG’s core business value is captured through rate base amount. Historically, BCG consistently
earned excess return above its allowed return. Therefore, we believe that valuing the gas utility operation at
rate base is very conservative. (Please refer to the base case valuation of the operational value.) Slowly
falling rate base indicates that Busan city area is now mature, and that BCG will only need to make mostly
maintenance capex. (Please refer to the Risk Section for further information.)
Allowed return vs. actual return (after-tax) (in mm KRW)
(Source: Company filing, our calculation)
Rate base and its yoy growth rate (in mm KRW)
(Source: Company filing, our calculation)
11. 11
2. Investment in real estate: BCG owns a prime real estate in Busan. We assessed the value of those lands, and
believe that the actual fair value is well-above book value. We used the book value for the bear case
valuation and used our own valuation for the base case. (Details of property re-valuation can be found in our
base case valuation.)
Aerial view of the properties near 2 subway stations and ocean… … Currently occupied by a supermarket and 2 restaurants
(Source: Naver map)
3. Investment securities: The portion of investment securities compared to our assessment of the intrinsic
value of BCG is less than 1%. And since it consists of private equity investment with no clarity, we only
counted 10% of their book value (90% discount; less than 0.1% of overall intrinsic value) into our valuation.
4. SK E&S HK: BCG, with its parent SK E&S, has 50% stake in SK E&S Hong Kong, which owns 49% of a gas utility
JV in mainland China. Although we believe the business is probably worth well-above the book value
(because China is also pushing clean LNG as the major alternative of dirty coal), the company does not
disclose much information, so we only accounted for 50% of book value (50% discount).
5. CGH: China Gas Holdings is a Hong Kong-listed (HKG:0384) Chinese LNG midstream and downstream (utility)
company. SK E&S owns total of about 15% of CGH, and BCG owns 1.5%. We used the market value of the
company into our valuation. We believe market value (15x forward P/E) is reasonable given the high growth
rate of the company.
CGH investor presentation showing its growth
(Source: IR presentation http://www.chinagasholdings.com.hk/uploadfiles/20160105095356777.pdf)
12. 12
6. Busan Green Energy: BCG owns 28.5% stake is a fuel cell generator project in Busan area. Given that the JV is
at its early stage and detail of the project is hard to come by, we cannot value it with certainty. Several other
utilities are involved in such power generator projects, and they are profitable and stable (such projects are
low-risk because the government controlled-electric utility is the off-taker and those projects are financed by
government sponsored entity from the beginning). To be conservative, we only counted 50% of the project
book value into our valuation.
7. At current market price near 33,000 KRW per share, BCG shares are about ~45% undervalued (~80% upside
from current market price to minimum intrinsic value).
Current price is ~12% below what SK E&S paid (37,500 KRW) at the end of 2013 in its public tender offer.
Since then, the minimum intrinsic value of BCG increased ~5% due to cash accumulation. Since the tender
offer at the end of 2013, BCG didn’t pay out much dividend, but paid off all of its debt.
We believe it’s very likely that SK E&S will attempt to buy more BCG shares through another public tender
offer above what it had offered in 2013 to acquire 100% of this utility.
13. 13
Base Case Valuation: What is BCG’s intrinsic value if property was revalued and operating value was fully realized?
1. Busan City Gas Investment Property Valuation
A. Location: Busan City Gas owns 3 investment properties. All 3 properties are located in Suyeong Bay. The
address of these properties are as follows:
Site 1 is rented by a supermarket, and sites 2 & 3 with ocean view are rented by family restaurants.
Busan City Gas’ 3 investment properties View of from sky
(Source: Naver Map, map.naver.com) (Source: Naver Map, map.naver.com)
Site 1 – Close up view View of Suyeong Bay Tower – Area near the site
Source: Naver Map, map.naver.com) (Source: Dongtak Gallery, http://dongtak.com/)
B. Ownership: We verified the ownership of the properties through online registry office of the Korea
Supreme Court (http://www.iros.go.kr/PMainJ.jsp).
14. 14
C. Official Price (praised by government): The official site area, gross floor area, individual official price of
the property is obtained from the MOLIT’s Land Management Support System (http://kras.gg.go.kr/).
D. Average selling price per square foot: We calculated the average selling price per square traded in the
nearby region, with the market values obtained from the Naver Real Estate system
(http://land.naver.com/).
Market price from real estate system – screenshot Organized Data
(Source: Naver Real Estate system, http://land.naver.com/)
E. Market value of the property:
Market Value = Gross Floor Area X Average selling price per m2
2. Operational value using cash flow yield
To be conservative, we valued the core gas operation at its book value in our bear case scenario (using rate
base). However, the company is in fact a cash flow machine, generating 16.1% FCF yield, or ~6.2x FCF
multiple (7-year average; even after including 2014, when account payable increased dramatically and was
normalized back in 2015).
15. 15
All in all, our summary valuation for the 2 different methods is as follows:
Valuation for different scenarios vs. the current market cap (in bn KRW)
(Source: Our Valuation)
Bear case:
Description of bear case valuation is already written in the “Valuation” section.
In bear case scenario, target price is 59,000 KRW, and there is ~80% upside from current price.
Base case:
For the gas operation, we used 8x normalized FCF of 43.2bn KRW. (FYI – 2015 FCF was 58.1bn KRW).
For the real estate investment value, we used the fair value calculated using our proprietary analysis and
channel checks.
All other assets (cash, investments in subsidiaries, etc) are valued the same way in both methods.
In base case scenario, target price is 78,300 KRW, and there is ~137% upside from current price.
Below is a case study of what SK E&S did in the past to fully acquire another city gas company called Ko-one.
(FYI – Kyung Nam Energy (KOSPI: 008020) is another city gas company that has been very recently privatized by its
parent company through a public tender offer.)
16. 16
Investment thesis #3: SK E&S’s city gas company privatization – Ko-one Case Study
Overview
1. Ko-one Energy Service Co., Ltd. (formerly known as Daehan City Gas) is a city gas retailer based in Seoul and
100% owned by SK E&S. Formerly a listed company, Ko-one went private on October 31, 2012 through a
public tender offer at a 29% premium (37,000 KRW) to its three-month average close price (28,400 KRW).
2. SK E&S has attempted to deregister BCG as well in November 2013 by buying off all of its shares at a 31%
premium (37,500 KRW) to its three-month average close price (28,600 KRW). Given BCG’s similarities with
Ko-one in terms of business, history, and ownership, the holding company is likely to follow through.
Similar Business
1. Market share: Ko-one and BCG are Korea’s fourth and fifth largest city gas utilities, pumping 67 million MJ
and 56 million MJ of energy in their respective districts.
2. Gross profit (gross revenue minus COGS): Ko-one generated 28% more than BCG in 2000. The Busan
distributor, however, surpassed its peer in 2011 and recorded a gross profit of 128 billion KRW in 2015, 7%
higher than Ko-one’s 120 billion KRW the same year.
3. Valuation and asset value floor: When looking at the asset value excluding debt, the asset value for BCG is
far greater than that of Ko-one. While, it is hard to figure out Ko-one’s property value in the market before
SK E&S’ purchase of Ko-one, we managed to get a good market estimate on BCG’s property value, as we
have described in detail in our report. We should therefore note that SK E&S will not only be buying BCG for
its attractive cash flow but also for its attractive asset value.
Business information as of December 31, 2015 Gross profits of Ko-one and Busan City Gas
Type Ko-one Busan City Gas
Market share 7.2% 6.0%
Distribution
(million MJ)
66,623 55,910
Households 1,429,343 1,279,180
Gross profit
(million KRW)
119,843 128,482
Book value
to mkt cap1 73% 152%
Net cash, investment,
property to mkt cap1 41% 95%
1 Before premium and property value for both companies based on book value
(Source: Company)
Similar history: Been there, done that
In many ways, Ko-one is BCG’s senior by a couple of years.
1. Ko-one was established in 1978, about three years ahead (1981) of BCG.
2. Ko-one initiated its retail distribution of city gas in 1980, about two years ahead (1982) of BCG.
3. Ko-one went public in 1995, about two years ahead (1997) of BCG.
0
20
40
60
80
100
120
140
160
2000 2003 2006 2009 2012 2015
BILLIONKRW
Ko-one Busan City Gas
17. 17
4. SK Corporation became Ko-one’s major shareholder in 1990, participating in latter’s management, while
BCG would meet SK as its largest shareholder three years later in 1993.
SK E&S’s ownership of Ko-one and Busan City Gas
Event Ko-one Busan City Gas
Established July 7, 1978 March 4, 1981
Initial distribution June 2, 1979 November 15, 1982
Listed December 21, 1995 June 23, 1997
First major involvement of SK January 16, 1990 March 6, 1993
(Source: Company)
SK E&S enters the scene
1. SK, the fourth largest conglomerate in Korea today, had ambitious plans to build a utility empire. On January
13, 1999, SK would form a $450 million joint venture with the US energy giant Enron to establish SK-Enron
(SK E&S), a holding company of gas utilities, power plants, and overseas investments.
2. One of the first things SK-Enron did was acquisition of four city gas utilities affiliated with Byucksan Group.
By 2001, it had nine city gas utilities in its portfolio.
3. SK-Enron went through many changes over the years. After losing Enron as its partner due to the infamous
scandal, SK-Enron changed its name in November 2005, eventually becoming fully owned by SK Corporation.
Subsequently it expanded its business to renewables and overseas energy projects.
4. Among other things, SK E&S has been consistently purchasing shares of its subsidiaries. In March 2002, five
city gas utilities were partially owned by the holding company. Today, only BCG is partially owned.
SK E&S has tightened control of its subsidiaries.
Subsidiary March 29, 2002
Subsidiary December 31, 2015
Gumi Gas1
100%
Youngnam ES1
100%
Pohang Gas1
100%
Daehan Gas2
40% Ko-one ES2
100%
Busan City Gas 40% Busan City Gas 67%
Chonnam City Gas 100% Chonnam City Gas 100%
Gangwon City Gas 87% Gangwon City Gas 100%
Iksan City Gas3
51% Jeonbuk ES3
100%
Cheongju4
100% Chungcheong ES4
100%
Chungnam City Gas5
98% - -
1 Gumi Gas was renamed Youngnam ES in 2007 and merged with Pohang Gas in 2008.
2 Daehan was renamed Ko-one ES in 2011.
3 Iksan City Gas merged with Jeonbuk ES, another subsidiary of SK E&S, in 2007.
4 Cheongju was renamed Chungcheong ES in 2007.
5 SK E&S sold off its ownership of Chungnam City Gas in exchange for shares of Daehan Gas in 2011.
(Source: Company, Proprietary research)
Delisting of Ko-one
1. We can learn what may happen to BCG from Ko-one’s example. Until 2007, SK E&S had a 40% stake in both
companies. From 2008 and on, the parent company, SK E&S, increased its ownership of Ko-one steadily until
finally delisting it in 2012.
2. Why: There are at least two reasons why Ko-one went private.
18. 18
A. First, the management wanted more flexibility and control. Being a public company, it had to comply
with tremendous regulatory, administrative, and corporate governance bylaws. In exchange, there was
little to gain from it. According to a company official, Ko-one has never accessed the public capital
market for cash infusion.
B. Second, SK E&S wanted to settle an ongoing feud with the second largest shareholder once and for all.
The two had been jointly running the utility, but had a significant difference in opinion. However, we
should note that Ko-one still chose to go private even after the issue had been resolved in November
2011.
3. From August 9 to 28, 2012, SK E&S, which had 82.2% ownership of Ko-one, conducted an open-market
purchase of the remaining 17.8% at 37,000 KRW with an intent to de-list. A sufficient number of
shareholders bought into the deal to meet the minimum ownership requirement of 95% to go private.
4. At a special meeting of shareholders on October 23, 2012, the request to de-list Ko-one’s securities was
approved.
SK E&S’s ownership of Ko-one and Busan City Gas
(Source: Company)
History repeats itself
1. About a year later, in 2013, SK E&S tries the same act with BCG. From November 20 to December 9. SK E&S
engaged in an open-market purchase of all BCG shares outstanding at 37,500 KRW to fully acquire BCG.
2. However, due to low tender price, many investors did not accept the offer and SK E&S failed to take full
control of BCG. BCG share price traded at a much higher price throughout 2014 in hopes of a higher asking
price from SK E&S. The enthusiasm faded away as SK E&S remained silent.
Conclusion: Given BCG’s undervaluation, its similarities with Ko-one, and SK E&S’s preference for privatization, a
catalyst may soon unlock its true value.
0%
20%
40%
60%
80%
100%
120%
1998 1999 2000 2001 2002 2003 2004 2005 2006 2007 2008 2009 2010 2011 2012 2013 2014 2015
Ko-one Busan City Gas
19. 19
Risk Factors
Here are some of the risk factors that we considered:
1. Falling revenue: The year over year revenue growth of BCG turned negative in 2015 for the first time in the
century, driving many investors into a massive sell-off. The historic decline, which was caused by the steep
fall of wholesale natural gas price (about 90% of revenue) and diminished demand, is not an accurate
reflection of company’s performance. A city gas utility’s earnings are determined by its government-
approved profits, not revenues or sales volume. In 2015, while revenues fell 17.5% compared to the year
before, the utility still managed to earn a NOPAT 6% in excess of its allowed return.
2. Falling rate base: Given the high penetration of city gas in Busan metropolitan area and what the BCG IR told
us, we expect the amount of BCG’s rate base to remain stable or continue to fall slowly in future. This
indicates a lack of high growth potential for this company.
However, the intrinsic value of gas operation does not fall even if rate base amount falls, because the
original investment is compensated with cash. As BCG depreciates the rate base it built up over the years,
the depreciation amount is fully compensated through the rate it charges to customers, which is separate
from the allowed return.
3. Falling oil price: One might worry that falling oil price can be a risk for BCG. However, falling oil price is not a
real risk. First, most houses and businesses in Busan are equipped with city gas as the only economical
energy source for cooking and heating. They would have to invest in additional equipment (such as boilers,
heaters, etc) to use other energy sources. Given that LNG price follows oil price trends in medium term (by
contract terms), it is unlikely that such scenario would play out.
Also, even if demand for city gas falls, allowed return to city gas companies is a tiny portion of total gas cost
to customers (1.4%, 1.0% and 1.4% of total gas rate in 2013, 2014 and 2015, respectively). Hence, it is
unlikely that gas utilities would have hard time collecting incremental margin to compensate for falling
usage.
20. 20
Appendix: Process for Korean City Gas Utilities – Clear and Predictable Process
Overview
1. Why: Ratemaking is the primary determinant of prices, which in turn affect a company’s bottom line.
Knowledge of the process is important because it allows us to better understand the business model of city
gas utilities in Korea. If you are familiar with the ratemaking process in the U.S., you will realize that Korea
uses very similar structure/process with small differences.
2. Law: Article 20 of Urban Gas Business Act says retail city gas prices must be calculated according to the
Principles of City Gas Ratemaking.
3. How: Regulators use a conventional cost of service approach to determine a fair price for gas distribution,
by which the aggregate costs (including a reasonable return on investment) for providing each class of
service (residential, commercial and industrial) are determined. Prices are set to recover those costs, based
on the sales volumes for each class.
4. Many investors and researchers do not give rates the level of attention it deserves. We put BCG’s allowed
return under close scrutiny, working with company IR, public regulators and accountants for data
acquisition, analysis and clarification.
Timeline
1. Ratemaking is an annual process.
2. It begins with a utility’s initial filing of accounting records within 90 days after the end of the fiscal year.
3. Then local government reviews the submission in consultation with a third-party service provider - typically
an accounting firm or a research institute - which comes up with one or more draft rates.
4. After a period for rebuttals and adjustments, a regulatory commission approves new prices for customers
and a new rate of return for the company.
5. The new rates normally take effect for one year from July 1 until the next adjustment.
Timeline of the ratemaking process
(Source: Tandem)
Determining the Revenue Requirement
1. The revenue requirement is the total amount of revenue a utility would need to earn a fair rate of return on
its investment, given specified assumptions about sales and costs.
2. Most of the evidence in ratemaking is directed at determining the revenue requirement. The utility is most
concerned with this number.
21. 21
3. The basic formula:
𝑅𝑒𝑣𝑒𝑛𝑢𝑒 𝑟𝑒𝑞𝑢𝑖𝑟𝑒𝑚𝑒𝑛𝑡 = 𝑂𝑝𝑒𝑟𝑎𝑡𝑖𝑛𝑔 𝑒𝑥𝑝𝑒𝑛𝑠𝑒𝑠 + 𝐴𝑙𝑙𝑜𝑤𝑒𝑑 𝑟𝑒𝑡𝑢𝑟𝑛
A. Operating expenses include labor, outside services, marketing, depreciation and amortization, and
taxes. These expenses constitute an amount deemed reasonable for safe and reliable distribution and
exclude costs that are not required to provide service.
B. Allowed return is what the government allows the company to earn after-tax.
4. The rest of ratemaking involves allocating that total allowed revenue among different customer classes, and
does not affect the utility’s overall profit.
During allocation, regulators decide how each class should contribute to meeting the revenue requirement
based on usage characteristics, and the outcome is retail rates for each class. Usually retail rates for
residential and commercial classes, which consume less per investment, are higher than those of industrial.
5. The final price a class of consumers pay is determined by adding the retail rate to COGS, which is purchased
wholesale from KOGAS. Operating expenses and COGS are passed through. Company earns allowed return.
Breakdown of consumer rate
(Source: Tandem)
Allowed Return
1. The basic formula:
𝐴𝑙𝑙𝑜𝑤𝑒𝑑 𝑟𝑒𝑡𝑢𝑟𝑛 = 𝑅𝑎𝑡𝑒 𝑏𝑎𝑠𝑒 × 𝐴𝑙𝑙𝑜𝑤𝑒𝑑 𝑟𝑎𝑡𝑒 𝑜𝑓 𝑟𝑒𝑡𝑢𝑟𝑛
2. The rate base includes a company’s fixed investments (mostly pipelines), intangibles (software), and working
capital (operating funds) necessary to operate on a day-to-day basis. Utilities may also include construction
work in progress (CWIP) in rate base during construction periods, allowing them to earn a current return
even before construction is completed.
3. The allowed rate of return dictates how much utilities earn on the rate base. The resulting profit allows
companies to cover the cost of capital - to pay interest on debt, issue dividends to shareholders, and provide
retained earnings. It is equivalent to weighted average cost of capital (WACC).
𝐴𝑙𝑙𝑜𝑤𝑒𝑑 𝑟𝑎𝑡𝑒 𝑜𝑓 𝑟𝑒𝑡𝑢𝑟𝑛 = 𝑊𝐴𝐶𝐶 =
𝐷
𝑉
× 𝐶𝑜𝑠𝑡 𝑜𝑓 𝑑𝑒𝑏𝑡 +
𝐸
𝑉
× 𝐶𝑜𝑠𝑡 𝑜𝑓 𝑒𝑞𝑢𝑖𝑡𝑦
A. The cost of debt is the effective interest rate net of tax a firm paid on its debt in the previous year.
B. The cost of equity is estimated based on the Capital Asset Pricing Model (CAPM) as the rate on a risk-
free security plus a risk premium.
22. 22
𝐶𝑜𝑠𝑡 𝑜𝑓 𝑒𝑞𝑢𝑖𝑡𝑦 = 𝑅𝑓 + (𝑅 𝑚 − 𝑅𝑓) × 𝛽
The risk-free rate is equivalent to the previous year’s average yield on a 5-year national bond. Market
risk premium is 6% in most cases5
. Beta is estimated based on the utility industry’s average stock index
and the market, incorporating the company-specific characteristics.
4. BCG’s proportion of debt is low. Therefore, its allowed rate of return is closely correlated with the cost of
equity, which in turn follows the average 5-year bond yield.
Correlation between Busan City Gas’s allowed rate of return and bond yield
(Source: Reports on City Gas Ratemaking in Busan)
How reliable is the allowed return as an estimate of net operating profit after tax (NOPAT)?
1. In theory, a company’s allowed return should roughly equal its NOPAT from distribution operations.
2. In practice, discrepancies often arise because the real world does not perfectly match the assumptions used
to establish revenue requirements. Some companies earn in excess, while others fall short. Causes for the
inconsistency are manifold - such as a regulatory lag, accounting irregularity, or inaccurate assumptions -
and thus difficult to pinpoint.
3. In its effort to reduce gaps and raise fairness, the government has amended the Principles of City Gas
Ratemaking more than ten times since its inception in 1993. One corrective device of note accounts for
discrepancies in sales volume. If it is discovered a company’s actual sales volume is 3% greater or less than
the approved projection, the regulator must account for the difference by lowering or raising the next year’s
rate in proportion, thereby protecting both consumers and company from a faulty volume assumption.
Likewise, the policy addresses some inaccurate assumptions, which are a main source of discrepancies
between actual and approved returns on investment. However, there is no clause for directly settling the
return itself. If a company’s NOPAT is different from allowed return, it simply takes away the additional
profit or loss.
4. Takeaway: According to our analysis, BCG has earned more than the allowed return every year in the past 8
years, even in 2014 and 2015 which saw an industry-wide drop in sales because the relative cost of
petroleum products became declined when compared to LNG price (which is linked to oil price, but lags).
5
(Samjong KPMG, 2015)
0.00%
2.00%
4.00%
6.00%
8.00%
10.00%
12.00%
2005 2006 2007 2008 2009 2010 2011 2012 2013 2014 2015
Allowed rate of return Yield on 5-year national bond
23. 23
BCG has consistently earned more than its allowed return
† An adjusted allowed return is shown for 2014. The Busan government subjected BCG’s allowed return to a one-time deduction of 3.1 billion
KRW for an extra subsidy the company had received.
(Source: Tandem, Company, Reports on City Gas Ratemaking in Busan)
Summary
1. The outcome of the regulator’s analysis is a determination of operating expenses, rate base and rate of
return. Together they make up the revenue requirement.
2. Then the government allocates the required revenue among customer classes and designs price structures
that will recover the revenue requirement based on historical and projected sales.
3. New city-gas rates and allowed return are approved by the regulator.
4. Unravelling the reasons for the excess earnings is not easy – it could be administrative lag, company’s
operational efficiency, and/or other inadequate approximations of the real world during ratemaking.
Nevertheless, we do know costs are passed through and that the allowed return has served well thus far as
a lower bound of NOPAT. Based on our understanding of rates and knowledge of BCG’s track record, we are
confident of employing the allowed return as a conservative estimate of NOPAT.
Appendix: Proprietary Research Methods
Number
Proprietary analyses of Report on City Gas Ratemaking 41
Analysis of city gas utilities 22
Interviews with investor relations managers 6
Interviews with local government officials 5
Interviews with experts on ratemaking (accountants & economists) 3
0%
5%
10%
15%
20%
25%
30%
35%
40%
45%
0
5,000
10,000
15,000
20,000
25,000
30,000
2008 2009 2010 2011 2012 2013 2014† 2015
millionKRW
Allowed return (RHS) NOPAT (RHS) % of excess earnings (LHS)
24. 24
(Disclaimer)
This report has been prepared by Tandem Investors Limited. This report is based on material analyst(s) believe to be reliable; however, we do
not represent that it is accurate, current, complete, or error free. Assumptions, estimates and opinions contained in this document constitute
our judgment as of the date of the document and are subject to change without notice. Any projections are based on a number of assumptions
as to market conditions and there can be no guarantee that any projected results will be achieved. Past performance is not a guarantee of
future results.
The securities described herein may not be eligible for sale in all jurisdictions or to certain categories of investors. Investments involve risks and
investors should exercise prudence in making their investment decisions. The report should not be regarded by recipients as a substitute for the
exercise of their own judgement. We do not hold any liability for any loss or damage arising out of the use of all or any part of this report. If
investors have any queries, please contact info@tandem-investors.com or+852-3950-6720.