Hawaii Police Misconduct Survey
•
1 like•1,157 views

A survey of 922 registered Hawaii voters found the following: - 57% believe police misconduct happens too frequently but is mostly the result of a few bad cops, while 19% think it is widespread and 17% think there is not much misconduct. - 46% think more government oversight of police is needed, while 37% think oversight is already sufficient. - Respondents were 52% female, 48% male, and the largest ethnic groups were Caucasian (37%), Japanese (28%), and Filipino (9%).

Recommended
More Related Content
What's hot
What's hot (20)
Similar to Hawaii Police Misconduct Survey
Similar to Hawaii Police Misconduct Survey (20)
More from Honolulu Civil Beat
More from Honolulu Civil Beat (20)
Recently uploaded
Recently uploaded (20)
Hawaii Police Misconduct Survey
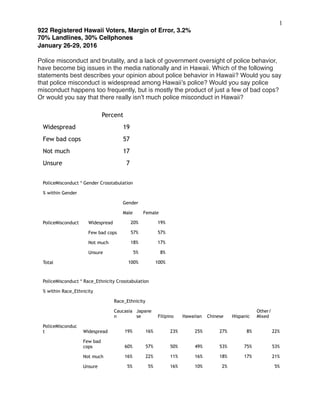
- 1. !1 922 Registered Hawaii Voters, Margin of Error, 3.2% 70% Landlines, 30% Cellphones January 26-29, 2016 Police misconduct and brutality, and a lack of government oversight of police behavior, have become big issues in the media nationally and in Hawaii. Which of the following statements best describes your opinion about police behavior in Hawaii? Would you say that police misconduct is widespread among Hawaii’s police? Would you say police misconduct happens too frequently, but is mostly the product of just a few of bad cops? Or would you say that there really isn’t much police misconduct in Hawaii? Percent Widespread 19 Few bad cops 57 Not much 17 Unsure 7 PoliceMisconduct * Gender Crosstabulation % within Gender Gender Male Female PoliceMisconduct Widespread 20% 19% Few bad cops 57% 57% Not much 18% 17% Unsure 5% 8% Total 100% 100% PoliceMisconduct * Race_Ethnicity Crosstabulation % within Race_Ethnicity Race_Ethnicity Caucasia n Japane se Filipino Hawaiian Chinese Hispanic Other/ Mixed PoliceMisconduc t Widespread 19% 16% 23% 25% 27% 8% 22% Few bad cops 60% 57% 50% 49% 53% 75% 53% Not much 16% 22% 11% 16% 18% 17% 21% Unsure 5% 5% 16% 10% 2% 5%
- 2. !2 922 Registered Hawaii Voters, Margin of Error, 3.2% 70% Landlines, 30% Cellphones January 26-29, 2016 Total 100% 100% 100% 100% 100% 100% 100% PoliceMisconduct * Age_Group Crosstabulation % within Age_Group Age_Grou p Under 50 50 or older PoliceMisconduct Widespread 26% 16% Few bad cops 54% 59% Not much 15% 19% Unsure 5% 7% Total 100% 100%
- 3. !3 922 Registered Hawaii Voters, Margin of Error, 3.2% 70% Landlines, 30% Cellphones January 26-29, 2016 PoliceMisconduct * County_CD Crosstabulation % within County_CD County_C D Oahu_1 Oahu_2 Hawaii Maui Kauai PoliceMisconduct Widespread 18% 18% 19% 32% 11% Few bad cops 55% 62% 59% 51% 62% Not much 21% 14% 17% 7% 16% Unsure 6% 6% 6% 11% 11% Total 100% 100% 100% 100% 100% PoliceMisconduct * Politics Crosstabulation % within Politics Politic s Liberal Moderate Conservativ e Unsure PoliceMisconduct Widespread 25% 16% 19% 20% Few bad cops 57% 61% 55% 51% Not much 13% 20% 23% 14% Unsure 5% 3% 4% 16% Total 100% 100% 100% 100% PoliceMisconduct * Party Crosstabulation % within Party Party Democra t Republica n Independen t Unsure PoliceMisconduct Widespread 20% 16% 20% 27% Few bad cops 58% 55% 58% 44% Not much 16% 24% 18% 15% Unsure 6% 6% 4% 15% Total 100% 100% 100% 100%
- 4. !4 922 Registered Hawaii Voters, Margin of Error, 3.2% 70% Landlines, 30% Cellphones January 26-29, 2016
- 5. !5 922 Registered Hawaii Voters, Margin of Error, 3.2% 70% Landlines, 30% Cellphones January 26-29, 2016 PoliceMisconduct * Income Crosstabulation % within Income Income Less than $50,000 $50,000- $100,000 More than $100,000 Refused PoliceMisconduc t Widespread 23% 17% 21% 16% Few bad cops 51% 62% 57% 55% Not much 19% 16% 19% 20% Unsure 7% 5% 3% 9% Total 100% 100% 100% 100% PoliceMisconduct * Ige Crosstabulation % within Ige Ige Positiv e Negative Unsure PoliceMisconduct Widespread 15% 26% 17% Few bad cops 61% 53% 56% Not much 17% 18% 16% Unsure 7% 3% 11% Total 100% 100% 100%
- 6. !6 922 Registered Hawaii Voters, Margin of Error, 3.2% 70% Landlines, 30% Cellphones January 26-29, 2016 Would you say that state and local government agencies need to provide more oversight of police in Hawaii than they currently are? Or would you say that there is already enough government oversight of police in the state? Percent More 46 Enough 37 Unsure 18 PoliceOversight * Gender Crosstabulation % within Gender Gender Male Female PoliceOversight More 47% 44% Enough 41% 33% Unsure 12% 23% Total 100% 100% PoliceOversight * Race_Ethnicity Crosstabulation % within Race_Ethnicity Race_Ethnicity Caucasian Japanese Filipino Hawaiian Chinese Hispanic Other/ Mixed PoliceOversight More 49% 46% 36% 44% 33% 55% 52% Enough 37% 40% 29% 43% 29% 46% 37% Unsure 14% 15% 36% 13% 39% 11% Total 100% 100% 100% 100% 100% 100% 100% PoliceOversight * Age_Group Crosstabulation % within Age_Group Age_Group
- 7. !7 922 Registered Hawaii Voters, Margin of Error, 3.2% 70% Landlines, 30% Cellphones January 26-29, 2016 Under 50 50 or older PoliceOversight More 51% 44% Enough 34% 39% Unsure 16% 17% Total 100% 100% PoliceOversight * County_CD Crosstabulation % within County_CD County_CD Oahu_1 Oahu_2 Hawaii Maui Kauai PoliceOversight More 47% 32% 53% 51% 42% Enough 35% 49% 31% 32% 46% Unsure 18% 19% 16% 17% 13% Total 100% 100% 100% 100% 100%
- 8. !8 922 Registered Hawaii Voters, Margin of Error, 3.2% 70% Landlines, 30% Cellphones January 26-29, 2016 PoliceOversight * Politics Crosstabulation % within Politics Politics Liberal Moderate Conservativ e Unsure PoliceOversight More 61% 46% 34% 42% Enough 28% 39% 53% 23% Unsure 11% 15% 13% 35% Total 100% 100% 100% 100% PoliceOversight * Party Crosstabulation % within Party Party Democrat Republica n Independen t Unsure PoliceOversight More 51% 33% 45% 46% Enough 32% 50% 40% 25% Unsure 17% 16% 15% 29% Total 100% 100% 100% 100% PoliceOversight * Income Crosstabulation % within Income Income Less than $50,000 $50,000- $100,000 More than $100,000 Refused PoliceOversight More 53% 50% 43% 33% Enough 36% 35% 43% 38% Unsure 11% 16% 14% 29% Total 100% 100% 100% 100% PoliceOversight * Ige Crosstabulation % within Ige Ige
- 9. !9 922 Registered Hawaii Voters, Margin of Error, 3.2% 70% Landlines, 30% Cellphones January 26-29, 2016 Positive Negative Unsure PoliceOversight More 45% 50% 43% Enough 38% 42% 30% Unsure 17% 9% 27% Total 100% 100% 100%
- 10. !10 922 Registered Hawaii Voters, Margin of Error, 3.2% 70% Landlines, 30% Cellphones January 26-29, 2016 Demographics Gender Age Group Race/Ethnicity Percent Male 48 Female 52 Percent Under 50 27 50 or older 73 Percent Caucasian 37 Japanese 28 Filipino 9 Hawaiian 10 Chinese 6 Hispanic 1 Other/Mixed 10
- 11. !11 922 Registered Hawaii Voters, Margin of Error, 3.2% 70% Landlines, 30% Cellphones January 26-29, 2016 Political Ideology Party I.D. Household Income Percent Liberal 25 Moderate 34 Conservative 25 Unsure 17 Percent Democrat 52 Republican 21 Independent 22 Unsure 6 Percent Less than $50,000 27 $50,000-$100,000 33 More than $100,000 22 Refused 19