SlideShare a Scribd company logo
1 of 5
Download to read offline
Rank               Geography              Percent       Percent     Percent Change from
among                                        Below         Below          1999-2009
Hawaii                                   Poverty Level Poverty Level
 CDP                                        in 2009       in 1999
         United States                           13.5%         12.4%                 8.8%
         West Region                             13.0%         13.0%                -0.3%
         Northeast Region                        11.6%         11.4%                 2.3%
         South Region                            15.1%         13.9%                 8.5%
         Midwest Region                          12.8%         10.2%               25.7%
         State of Hawaii                          9.4%         10.7%              -12.0%
         Maui County                              7.9%         10.5%              -24.8%
         Hawaii County                           13.5%         15.7%              -13.6%
         Honolulu County                          8.9%          9.9%              -10.4%
         Kauai County                             9.5%         10.5%                -9.8%
1        Hanalei CDP, Hawaii                      0.5%         25.3%              -97.9%
2        Waikane CDP, Hawaii                      1.1%         11.6%              -90.6%
3        Kaaawa CDP, Hawaii                       1.7%         11.8%              -85.8%
4        Laupahoehoe CDP, Hawaii                  4.1%         25.2%              -83.5%
5        Omao CDP, Hawaii                         2.0%         10.0%              -80.3%
6        Pakala Village CDP, Hawaii               8.7%         43.8%              -80.0%
7        Kawela Bay CDP, Hawaii                   2.4%         11.4%              -79.3%
8        Pukalani CDP, Hawaii                     1.6%          6.4%              -75.4%
9        Waipio Acres CDP, Hawaii                 2.7%         10.6%              -74.5%
10       Wailua Homesteads CDP, Hawaii            2.4%          8.9%              -72.7%
11       Kalihiwai CDP, Hawaii                    4.0%         13.5%              -70.2%
12       Halaula CDP, Hawaii                      5.9%         16.8%              -65.1%
13       Hawi CDP, Hawaii                         3.2%          8.7%              -64.0%
14       Hana CDP, Hawaii                         3.1%          8.6%              -63.6%
15       Napili-Honokowai CDP, Hawaii             3.6%          9.5%              -62.1%
16       Puhi CDP, Hawaii                         2.9%          7.2%              -60.3%
17       Kukuihaele CDP, Hawaii                   6.3%         14.9%              -57.8%
18       Hanapepe CDP, Hawaii                     2.8%          6.6%              -57.6%
19       Whitmore Village CDP, Hawaii             4.7%         11.1%              -57.4%
20       Kahuku CDP, Hawaii                       6.6%         14.6%              -55.2%
21       Hauula CDP, Hawaii                       8.7%         19.0%              -54.4%
22       Eleele CDP, Hawaii                       6.1%         13.2%              -54.0%
23       Poipu CDP, Hawaii                        3.5%          7.5%              -53.4%
Rank               Geography                 Percent       Percent     Percent Change from
among                                           Below         Below          1999-2009
Hawaii                                      Poverty Level Poverty Level
 CDP                                           in 2009       in 1999
24       Waimea CDP (Hawaii County), Hawaii          2.9%          6.0%              -51.3%
25       Pahoa CDP, Hawaii                           8.8%         18.0%              -51.0%
26       Ainaloa CDP, Hawaii                        18.1%         36.6%              -50.5%
27       Kilauea CDP, Hawaii                         6.3%         12.4%              -49.4%
28       Kapalua CDP, Hawaii                         3.7%          7.2%              -49.3%
29       Waialua CDP, Hawaii                         6.4%         11.7%              -45.1%
30       Kaumakani CDP, Hawaii                       6.1%         11.1%              -44.7%
31       Papaikou CDP, Hawaii                        8.5%         15.0%              -43.4%
32       Kahului CDP, Hawaii                         6.8%         11.8%              -42.8%
33       Wailuku CDP, Hawaii                         6.5%         11.2%              -41.8%
34       Hawaiian Acres CDP, Hawaii                 16.4%         28.1%              -41.5%
35       Honomu CDP, Hawaii                          9.7%         16.6%              -41.4%
36       Haleiwa CDP, Hawaii                        10.4%         17.6%              -40.8%
37       Waimalu CDP, Hawaii                         3.6%          5.9%              -39.5%
38       Kalaoa CDP, Hawaii                          3.9%          6.2%              -36.8%
39       Waihee-Waiehu CDP, Hawaii                   4.4%          6.8%              -35.4%
40       Haiku-Pauwela CDP, Hawaii                  11.0%         16.4%              -32.7%
41       Hawaiian Ocean View CDP, Hawaii            17.1%         25.2%              -32.2%
42       Honalo CDP, Hawaii                         13.1%         19.1%              -31.4%
43       Ewa Villages CDP, Hawaii                    5.9%          8.6%              -30.8%
44       Wainaku CDP, Hawaii                         8.8%         12.5%              -29.6%
45       Koloa CDP, Hawaii                          12.6%         17.8%              -29.3%
46       Makakilo City CDP, Hawaii                   3.6%          5.1%              -28.9%
47       Kahaluu-Keauhou CDP, Hawaii                 9.6%         13.4%              -28.6%
48       Kailua CDP (Hawaii County), Hawaii          7.7%         10.8%              -28.4%
49       Laie CDP, Hawaii                           12.6%         17.5%              -28.3%
50       Kihei CDP, Hawaii                           7.3%         10.1%              -28.2%
51       Nanawale Estates CDP, Hawaii               22.4%         31.0%              -27.7%
52       Punaluu CDP, Hawaii                        14.4%         19.9%              -27.5%
53       Wahiawa CDP, Hawaii                        12.3%         16.7%              -26.5%
54       Halawa CDP, Hawaii                          7.5%         10.1%              -25.4%
55       Mountain View CDP, Hawaii                  23.0%         30.3%              -24.3%
56       Waimanalo Beach CDP, Hawaii                 6.5%          8.5%              -24.0%
Rank               Geography                   Percent       Percent     Percent Change from
among                                             Below         Below          1999-2009
Hawaii                                        Poverty Level Poverty Level
 CDP                                             in 2009       in 1999
57       Waikoloa Village CDP, Hawaii                  7.9%         10.4%              -23.7%
58       Honokaa CDP, Hawaii                           7.3%          9.6%              -23.4%
59       Volcano CDP, Hawaii                          11.3%         14.3%              -21.2%
60       Waianae CDP, Hawaii                          15.7%         19.8%              -20.7%
61       Kurtistown CDP, Hawaii                        6.7%          8.4%              -20.0%
62       Honaunau-Napoopoo CDP, Hawaii                10.9%         13.5%              -19.0%
63       Kaunakakai CDP, Hawaii                       16.7%         20.6%              -18.9%
64       Hanamaulu CDP, Hawaii                         8.2%         10.0%              -18.3%
65       Nanakuli CDP, Hawaii                         18.0%         21.3%              -15.4%
66       Mokuleia CDP, Hawaii                          9.1%         10.7%              -14.9%
67       Kealakekua CDP, Hawaii                       11.7%         13.7%              -14.8%
68       Waimea CDP (Kauai County), Hawaii             9.8%         11.5%              -14.5%
69       Orchidlands Estates CDP, Hawaii              24.1%         27.6%              -12.6%
70       Lanai City CDP, Hawaii                        8.3%          9.5%              -12.4%
71       Honolulu CDP, Hawaii                         10.5%         11.8%              -10.6%
72       Makaha Valley CDP, Hawaii                    32.8%         36.6%              -10.3%
73       Waipio CDP, Hawaii                            3.7%          4.1%                -9.1%
74       Hilo CDP, Hawaii                             15.6%         17.1%                -9.0%
75       Lahaina CDP, Hawaii                           7.1%          7.8%                -8.4%
76       Kekaha CDP, Hawaii                           10.3%         11.2%                -7.9%
77       Ahuimanu CDP, Hawaii                          3.7%          3.9%                -4.3%
78       Keaau CDP, Hawaii                            11.8%         12.3%                -3.4%
79       Pupukea CDP, Hawaii                          14.8%         15.2%                -2.5%
80       Maunawili CDP, Hawaii                         2.5%          2.5%                -2.4%
81       Waipahu CDP, Hawaii                          13.8%         13.8%                 0.3%
82       Kahaluu CDP, Hawaii                           7.5%          7.4%                 0.5%
83       Hawaiian Beaches CDP, Hawaii                 28.8%         28.6%                 0.7%
84       Aiea CDP, Hawaii                              4.6%          4.6%                 0.8%
85       Pearl City CDP, Hawaii                        6.3%          6.2%                 0.9%
86       Hickam Housing CDP, Hawaii                    2.2%          2.2%                 1.5%
87       Mililani Town CDP, Hawaii                     3.3%          3.2%                 1.6%
88       Kailua CDP (Honolulu County), Hawaii          5.5%          5.4%                 1.8%
89       Maili CDP, Hawaii                            22.1%         21.5%                 2.5%
Rank                Geography                  Percent       Percent     Percent Change from
among                                             Below         Below          1999-2009
Hawaii                                        Poverty Level Poverty Level
 CDP                                             in 2009       in 1999
90       Captain Cook CDP, Hawaii                      8.7%          8.5%                2.9%
91       Makaha CDP, Hawaii                           26.1%         23.9%                8.9%
92       Pahala CDP, Hawaii                           26.4%         24.2%                9.1%
93       Wheeler AFB CDP, Hawaii                       8.7%          7.9%                9.8%
94       Kaneohe CDP, Hawaii                           6.8%          6.1%               11.0%
95       Kapaa CDP, Hawaii                            17.7%         15.7%               12.4%
96       Eden Roc CDP, Hawaii                         39.3%         34.9%               12.6%
97       Holualoa CDP, Hawaii                          9.0%          7.8%               15.6%
98       Fern Forest CDP, Hawaii                      29.8%         25.5%               16.5%
99       Leilani Estates CDP, Hawaii                  25.6%         21.9%               16.8%
100      Anahola CDP, Hawaii                          16.7%         14.2%               17.3%
101      Ewa Beach CDP, Hawaii                        11.7%          9.9%               18.9%
102      Hawaiian Paradise Park CDP, Hawaii           23.3%         19.6%               19.0%
103      Waimanalo CDP, Hawaii                         9.7%          8.1%               20.4%
104      Wailua CDP, Hawaii                           10.7%          8.9%               20.7%
105      Kaneohe Station CDP, Hawaii                   9.0%          7.2%               24.5%
106      Kualapuu CDP, Hawaii                         18.8%         15.1%               24.7%
107      Haliimaile CDP, Hawaii                        9.2%          7.3%               26.6%
108      Village Park CDP, Hawaii                      6.6%          5.0%               30.2%
109      Naalehu CDP, Hawaii                          28.9%         20.4%               41.7%
110      Wailea-Makena CDP, Hawaii                     9.4%          6.6%               41.9%
111      Fern Acres CDP, Hawaii                       23.8%         16.4%               44.9%
112      Makawao CDP, Hawaii                          14.6%          9.6%               51.8%
113      Pepeekeo CDP, Hawaii                         32.3%         20.7%               56.3%
114      Paukaa CDP, Hawaii                           14.3%          8.9%               61.9%
115      Kapaau CDP, Hawaii                           13.4%          7.8%               71.5%
116      Kaanapali CDP, Hawaii                         4.7%          2.7%               73.9%
117      Paauilo CDP, Hawaii                          21.5%         12.3%               75.0%
118      Maalaea CDP, Hawaii                           6.8%          3.7%               81.0%
119      Lawai CDP, Hawaii                             9.2%          4.9%               88.9%
120      Ewa Gentry CDP, Hawaii                        5.0%          2.6%               89.7%
121      Schofield Barracks CDP, Hawaii               14.7%          7.2%              103.5%
122      Kalaheo CDP, Hawaii                           5.0%          2.4%              107.7%
Rank                Geography                 Percent       Percent      Percent Change from
among                                            Below         Below           1999-2009
Hawaii                                       Poverty Level Poverty Level
 CDP                                            in 2009       in 1999
123      Princeville CDP, Hawaii                     18.4%          8.1%                 127.4%
124      Lihue CDP, Hawaii                           10.7%          4.6%                 134.0%
125      Puako CDP, Hawaii                            8.0%          3.1%                 162.0%
126      Waikapu CDP, Hawaii                          5.4%          1.9%                 183.1%
127      Paia CDP, Hawaii                            27.1%          8.9%                 206.5%
128      Maunaloa CDP, Hawaii                        68.5%         22.3%                 207.4%
129      Iroquois Point CDP, Hawaii                   5.6%          1.8%                 220.1%
130      Heeia CDP, Hawaii                            2.2%          0.5%                 351.1%
131      Barbers Point Housing CDP, Hawaii           14.5%          0.0% (Cannot Divide By Zero)

More Related Content

Similar to 10 year gains — percent in poverty

10 year gains — median household income
10 year gains — median household income10 year gains — median household income
10 year gains — median household incomeHonolulu Civil Beat
 
WKXC Graphic Summary 2011
WKXC Graphic Summary  2011WKXC Graphic Summary  2011
WKXC Graphic Summary 2011lilliankaysmith
 
Impact of Health Reform on Racial and Ethnic Inequities
Impact of Health Reform on Racial and Ethnic InequitiesImpact of Health Reform on Racial and Ethnic Inequities
Impact of Health Reform on Racial and Ethnic Inequitiesmasscare
 
WHHD Graphic Summary 2011
WHHD Graphic Summary  2011WHHD Graphic Summary  2011
WHHD Graphic Summary 2011lilliankaysmith
 
WDRR Graphic Summary 2011
WDRR Graphic Summary  2011WDRR Graphic Summary  2011
WDRR Graphic Summary 2011lilliankaysmith
 
Wake County public schools calendar survey results
Wake County public schools calendar survey resultsWake County public schools calendar survey results
Wake County public schools calendar survey resultsNews 14 Carolina
 
Civil beat poll sept. 7 8, 2010 governor crosstabs
Civil beat poll sept. 7 8, 2010 governor crosstabsCivil beat poll sept. 7 8, 2010 governor crosstabs
Civil beat poll sept. 7 8, 2010 governor crosstabsHonolulu Civil Beat
 

Similar to 10 year gains — percent in poverty (20)

10 year gains — median household income
10 year gains — median household income10 year gains — median household income
10 year gains — median household income
 
2012 State of the Community
2012 State of the Community2012 State of the Community
2012 State of the Community
 
10-Year Changes 2000-2009
10-Year Changes 2000-200910-Year Changes 2000-2009
10-Year Changes 2000-2009
 
Hawaii Towns Transportation
Hawaii Towns TransportationHawaii Towns Transportation
Hawaii Towns Transportation
 
Towns Race
Towns RaceTowns Race
Towns Race
 
WKXC Graphic Summary 2011
WKXC Graphic Summary  2011WKXC Graphic Summary  2011
WKXC Graphic Summary 2011
 
Hawaii Towns Travel Time
Hawaii Towns Travel TimeHawaii Towns Travel Time
Hawaii Towns Travel Time
 
Impact of Health Reform on Racial and Ethnic Inequities
Impact of Health Reform on Racial and Ethnic InequitiesImpact of Health Reform on Racial and Ethnic Inequities
Impact of Health Reform on Racial and Ethnic Inequities
 
Hawaii Towns Departure Time
Hawaii Towns Departure TimeHawaii Towns Departure Time
Hawaii Towns Departure Time
 
Hawaii Towns — Place of Birth
Hawaii Towns — Place of BirthHawaii Towns — Place of Birth
Hawaii Towns — Place of Birth
 
WHHD Graphic Summary 2011
WHHD Graphic Summary  2011WHHD Graphic Summary  2011
WHHD Graphic Summary 2011
 
Fleishman WWCMA June Meeting
Fleishman WWCMA June MeetingFleishman WWCMA June Meeting
Fleishman WWCMA June Meeting
 
WDRR Graphic Summary 2011
WDRR Graphic Summary  2011WDRR Graphic Summary  2011
WDRR Graphic Summary 2011
 
May 2011 CHC academics and health
May 2011 CHC academics and healthMay 2011 CHC academics and health
May 2011 CHC academics and health
 
Keypad results
Keypad resultsKeypad results
Keypad results
 
10th San Diego Asian Film Festival Marketing Presentation
10th San Diego Asian Film Festival Marketing Presentation10th San Diego Asian Film Festival Marketing Presentation
10th San Diego Asian Film Festival Marketing Presentation
 
Idle Teens 2000-2009
Idle Teens 2000-2009Idle Teens 2000-2009
Idle Teens 2000-2009
 
Wake County public schools calendar survey results
Wake County public schools calendar survey resultsWake County public schools calendar survey results
Wake County public schools calendar survey results
 
Civil beat poll sept. 7 8, 2010 governor crosstabs
Civil beat poll sept. 7 8, 2010 governor crosstabsCivil beat poll sept. 7 8, 2010 governor crosstabs
Civil beat poll sept. 7 8, 2010 governor crosstabs
 
States Race
States RaceStates Race
States Race
 

More from Honolulu Civil Beat

Gov. David Ige response to U.S. Rep. Anna Eshoo
Gov. David Ige response to U.S. Rep. Anna EshooGov. David Ige response to U.S. Rep. Anna Eshoo
Gov. David Ige response to U.S. Rep. Anna EshooHonolulu Civil Beat
 
Audit of the Department of the Honolulu Prosecuting Attorney’s Policies, Proc...
Audit of the Department of the Honolulu Prosecuting Attorney’s Policies, Proc...Audit of the Department of the Honolulu Prosecuting Attorney’s Policies, Proc...
Audit of the Department of the Honolulu Prosecuting Attorney’s Policies, Proc...Honolulu Civil Beat
 
Audit of the Honolulu Police Department’s Policies, Procedures, and Controls
Audit of the Honolulu Police Department’s Policies, Procedures, and ControlsAudit of the Honolulu Police Department’s Policies, Procedures, and Controls
Audit of the Honolulu Police Department’s Policies, Procedures, and ControlsHonolulu Civil Beat
 
2019 Use of Force Annual Report HPD
2019 Use of Force Annual Report HPD 2019 Use of Force Annual Report HPD
2019 Use of Force Annual Report HPD Honolulu Civil Beat
 
Office of Health Equity Goals Draft 10
Office of Health Equity Goals Draft 10Office of Health Equity Goals Draft 10
Office of Health Equity Goals Draft 10Honolulu Civil Beat
 
ACLU Letter to HPD regarding racial profiling
ACLU Letter to HPD regarding racial profilingACLU Letter to HPD regarding racial profiling
ACLU Letter to HPD regarding racial profilingHonolulu Civil Beat
 
ACLU Letter to HPD regarding racial profiling
ACLU Letter to HPD regarding racial profilingACLU Letter to HPD regarding racial profiling
ACLU Letter to HPD regarding racial profilingHonolulu Civil Beat
 
Guam Governor's Letter to Pence
Guam Governor's Letter to Pence Guam Governor's Letter to Pence
Guam Governor's Letter to Pence Honolulu Civil Beat
 
List Of Pro Bono Legal Service Providers
List Of Pro Bono Legal Service ProvidersList Of Pro Bono Legal Service Providers
List Of Pro Bono Legal Service ProvidersHonolulu Civil Beat
 
Arbitration Hearing Transcript December 2018
Arbitration Hearing Transcript December 2018Arbitration Hearing Transcript December 2018
Arbitration Hearing Transcript December 2018Honolulu Civil Beat
 

More from Honolulu Civil Beat (20)

Gov. David Ige response to U.S. Rep. Anna Eshoo
Gov. David Ige response to U.S. Rep. Anna EshooGov. David Ige response to U.S. Rep. Anna Eshoo
Gov. David Ige response to U.S. Rep. Anna Eshoo
 
Audit of the Department of the Honolulu Prosecuting Attorney’s Policies, Proc...
Audit of the Department of the Honolulu Prosecuting Attorney’s Policies, Proc...Audit of the Department of the Honolulu Prosecuting Attorney’s Policies, Proc...
Audit of the Department of the Honolulu Prosecuting Attorney’s Policies, Proc...
 
Audit of the Honolulu Police Department’s Policies, Procedures, and Controls
Audit of the Honolulu Police Department’s Policies, Procedures, and ControlsAudit of the Honolulu Police Department’s Policies, Procedures, and Controls
Audit of the Honolulu Police Department’s Policies, Procedures, and Controls
 
2019 Use of Force Annual Report HPD
2019 Use of Force Annual Report HPD 2019 Use of Force Annual Report HPD
2019 Use of Force Annual Report HPD
 
Office of Health Equity Goals Draft 10
Office of Health Equity Goals Draft 10Office of Health Equity Goals Draft 10
Office of Health Equity Goals Draft 10
 
NHPI COVID-19 Statement
NHPI COVID-19 StatementNHPI COVID-19 Statement
NHPI COVID-19 Statement
 
DLIR Response Language Access
DLIR Response Language AccessDLIR Response Language Access
DLIR Response Language Access
 
Language Access Letter To DLIR
Language Access Letter To DLIRLanguage Access Letter To DLIR
Language Access Letter To DLIR
 
ACLU Letter to HPD regarding racial profiling
ACLU Letter to HPD regarding racial profilingACLU Letter to HPD regarding racial profiling
ACLU Letter to HPD regarding racial profiling
 
ACLU Letter to HPD regarding racial profiling
ACLU Letter to HPD regarding racial profilingACLU Letter to HPD regarding racial profiling
ACLU Letter to HPD regarding racial profiling
 
Jane Doe v. Rehab Hospital
Jane Doe v. Rehab HospitalJane Doe v. Rehab Hospital
Jane Doe v. Rehab Hospital
 
Coronavirus HPHA
Coronavirus HPHA Coronavirus HPHA
Coronavirus HPHA
 
OHA Data Request
OHA Data RequestOHA Data Request
OHA Data Request
 
Letter from Palau to Guam
Letter from Palau to GuamLetter from Palau to Guam
Letter from Palau to Guam
 
Guam Governor's Letter to Pence
Guam Governor's Letter to Pence Guam Governor's Letter to Pence
Guam Governor's Letter to Pence
 
OHA Analysis by Akina
OHA Analysis by AkinaOHA Analysis by Akina
OHA Analysis by Akina
 
Case COFA Letter
Case COFA LetterCase COFA Letter
Case COFA Letter
 
List Of Pro Bono Legal Service Providers
List Of Pro Bono Legal Service ProvidersList Of Pro Bono Legal Service Providers
List Of Pro Bono Legal Service Providers
 
Arbitration Hearing Transcript December 2018
Arbitration Hearing Transcript December 2018Arbitration Hearing Transcript December 2018
Arbitration Hearing Transcript December 2018
 
Caldwell Press Release
Caldwell Press ReleaseCaldwell Press Release
Caldwell Press Release
 

10 year gains — percent in poverty

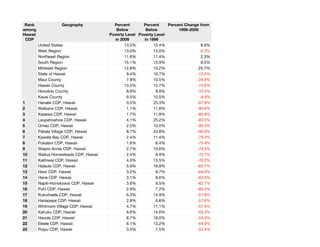
  • 1. Rank Geography Percent Percent Percent Change from among Below Below 1999-2009 Hawaii Poverty Level Poverty Level CDP in 2009 in 1999 United States 13.5% 12.4% 8.8% West Region 13.0% 13.0% -0.3% Northeast Region 11.6% 11.4% 2.3% South Region 15.1% 13.9% 8.5% Midwest Region 12.8% 10.2% 25.7% State of Hawaii 9.4% 10.7% -12.0% Maui County 7.9% 10.5% -24.8% Hawaii County 13.5% 15.7% -13.6% Honolulu County 8.9% 9.9% -10.4% Kauai County 9.5% 10.5% -9.8% 1 Hanalei CDP, Hawaii 0.5% 25.3% -97.9% 2 Waikane CDP, Hawaii 1.1% 11.6% -90.6% 3 Kaaawa CDP, Hawaii 1.7% 11.8% -85.8% 4 Laupahoehoe CDP, Hawaii 4.1% 25.2% -83.5% 5 Omao CDP, Hawaii 2.0% 10.0% -80.3% 6 Pakala Village CDP, Hawaii 8.7% 43.8% -80.0% 7 Kawela Bay CDP, Hawaii 2.4% 11.4% -79.3% 8 Pukalani CDP, Hawaii 1.6% 6.4% -75.4% 9 Waipio Acres CDP, Hawaii 2.7% 10.6% -74.5% 10 Wailua Homesteads CDP, Hawaii 2.4% 8.9% -72.7% 11 Kalihiwai CDP, Hawaii 4.0% 13.5% -70.2% 12 Halaula CDP, Hawaii 5.9% 16.8% -65.1% 13 Hawi CDP, Hawaii 3.2% 8.7% -64.0% 14 Hana CDP, Hawaii 3.1% 8.6% -63.6% 15 Napili-Honokowai CDP, Hawaii 3.6% 9.5% -62.1% 16 Puhi CDP, Hawaii 2.9% 7.2% -60.3% 17 Kukuihaele CDP, Hawaii 6.3% 14.9% -57.8% 18 Hanapepe CDP, Hawaii 2.8% 6.6% -57.6% 19 Whitmore Village CDP, Hawaii 4.7% 11.1% -57.4% 20 Kahuku CDP, Hawaii 6.6% 14.6% -55.2% 21 Hauula CDP, Hawaii 8.7% 19.0% -54.4% 22 Eleele CDP, Hawaii 6.1% 13.2% -54.0% 23 Poipu CDP, Hawaii 3.5% 7.5% -53.4%
  • 2. Rank Geography Percent Percent Percent Change from among Below Below 1999-2009 Hawaii Poverty Level Poverty Level CDP in 2009 in 1999 24 Waimea CDP (Hawaii County), Hawaii 2.9% 6.0% -51.3% 25 Pahoa CDP, Hawaii 8.8% 18.0% -51.0% 26 Ainaloa CDP, Hawaii 18.1% 36.6% -50.5% 27 Kilauea CDP, Hawaii 6.3% 12.4% -49.4% 28 Kapalua CDP, Hawaii 3.7% 7.2% -49.3% 29 Waialua CDP, Hawaii 6.4% 11.7% -45.1% 30 Kaumakani CDP, Hawaii 6.1% 11.1% -44.7% 31 Papaikou CDP, Hawaii 8.5% 15.0% -43.4% 32 Kahului CDP, Hawaii 6.8% 11.8% -42.8% 33 Wailuku CDP, Hawaii 6.5% 11.2% -41.8% 34 Hawaiian Acres CDP, Hawaii 16.4% 28.1% -41.5% 35 Honomu CDP, Hawaii 9.7% 16.6% -41.4% 36 Haleiwa CDP, Hawaii 10.4% 17.6% -40.8% 37 Waimalu CDP, Hawaii 3.6% 5.9% -39.5% 38 Kalaoa CDP, Hawaii 3.9% 6.2% -36.8% 39 Waihee-Waiehu CDP, Hawaii 4.4% 6.8% -35.4% 40 Haiku-Pauwela CDP, Hawaii 11.0% 16.4% -32.7% 41 Hawaiian Ocean View CDP, Hawaii 17.1% 25.2% -32.2% 42 Honalo CDP, Hawaii 13.1% 19.1% -31.4% 43 Ewa Villages CDP, Hawaii 5.9% 8.6% -30.8% 44 Wainaku CDP, Hawaii 8.8% 12.5% -29.6% 45 Koloa CDP, Hawaii 12.6% 17.8% -29.3% 46 Makakilo City CDP, Hawaii 3.6% 5.1% -28.9% 47 Kahaluu-Keauhou CDP, Hawaii 9.6% 13.4% -28.6% 48 Kailua CDP (Hawaii County), Hawaii 7.7% 10.8% -28.4% 49 Laie CDP, Hawaii 12.6% 17.5% -28.3% 50 Kihei CDP, Hawaii 7.3% 10.1% -28.2% 51 Nanawale Estates CDP, Hawaii 22.4% 31.0% -27.7% 52 Punaluu CDP, Hawaii 14.4% 19.9% -27.5% 53 Wahiawa CDP, Hawaii 12.3% 16.7% -26.5% 54 Halawa CDP, Hawaii 7.5% 10.1% -25.4% 55 Mountain View CDP, Hawaii 23.0% 30.3% -24.3% 56 Waimanalo Beach CDP, Hawaii 6.5% 8.5% -24.0%
  • 3. Rank Geography Percent Percent Percent Change from among Below Below 1999-2009 Hawaii Poverty Level Poverty Level CDP in 2009 in 1999 57 Waikoloa Village CDP, Hawaii 7.9% 10.4% -23.7% 58 Honokaa CDP, Hawaii 7.3% 9.6% -23.4% 59 Volcano CDP, Hawaii 11.3% 14.3% -21.2% 60 Waianae CDP, Hawaii 15.7% 19.8% -20.7% 61 Kurtistown CDP, Hawaii 6.7% 8.4% -20.0% 62 Honaunau-Napoopoo CDP, Hawaii 10.9% 13.5% -19.0% 63 Kaunakakai CDP, Hawaii 16.7% 20.6% -18.9% 64 Hanamaulu CDP, Hawaii 8.2% 10.0% -18.3% 65 Nanakuli CDP, Hawaii 18.0% 21.3% -15.4% 66 Mokuleia CDP, Hawaii 9.1% 10.7% -14.9% 67 Kealakekua CDP, Hawaii 11.7% 13.7% -14.8% 68 Waimea CDP (Kauai County), Hawaii 9.8% 11.5% -14.5% 69 Orchidlands Estates CDP, Hawaii 24.1% 27.6% -12.6% 70 Lanai City CDP, Hawaii 8.3% 9.5% -12.4% 71 Honolulu CDP, Hawaii 10.5% 11.8% -10.6% 72 Makaha Valley CDP, Hawaii 32.8% 36.6% -10.3% 73 Waipio CDP, Hawaii 3.7% 4.1% -9.1% 74 Hilo CDP, Hawaii 15.6% 17.1% -9.0% 75 Lahaina CDP, Hawaii 7.1% 7.8% -8.4% 76 Kekaha CDP, Hawaii 10.3% 11.2% -7.9% 77 Ahuimanu CDP, Hawaii 3.7% 3.9% -4.3% 78 Keaau CDP, Hawaii 11.8% 12.3% -3.4% 79 Pupukea CDP, Hawaii 14.8% 15.2% -2.5% 80 Maunawili CDP, Hawaii 2.5% 2.5% -2.4% 81 Waipahu CDP, Hawaii 13.8% 13.8% 0.3% 82 Kahaluu CDP, Hawaii 7.5% 7.4% 0.5% 83 Hawaiian Beaches CDP, Hawaii 28.8% 28.6% 0.7% 84 Aiea CDP, Hawaii 4.6% 4.6% 0.8% 85 Pearl City CDP, Hawaii 6.3% 6.2% 0.9% 86 Hickam Housing CDP, Hawaii 2.2% 2.2% 1.5% 87 Mililani Town CDP, Hawaii 3.3% 3.2% 1.6% 88 Kailua CDP (Honolulu County), Hawaii 5.5% 5.4% 1.8% 89 Maili CDP, Hawaii 22.1% 21.5% 2.5%
  • 4. Rank Geography Percent Percent Percent Change from among Below Below 1999-2009 Hawaii Poverty Level Poverty Level CDP in 2009 in 1999 90 Captain Cook CDP, Hawaii 8.7% 8.5% 2.9% 91 Makaha CDP, Hawaii 26.1% 23.9% 8.9% 92 Pahala CDP, Hawaii 26.4% 24.2% 9.1% 93 Wheeler AFB CDP, Hawaii 8.7% 7.9% 9.8% 94 Kaneohe CDP, Hawaii 6.8% 6.1% 11.0% 95 Kapaa CDP, Hawaii 17.7% 15.7% 12.4% 96 Eden Roc CDP, Hawaii 39.3% 34.9% 12.6% 97 Holualoa CDP, Hawaii 9.0% 7.8% 15.6% 98 Fern Forest CDP, Hawaii 29.8% 25.5% 16.5% 99 Leilani Estates CDP, Hawaii 25.6% 21.9% 16.8% 100 Anahola CDP, Hawaii 16.7% 14.2% 17.3% 101 Ewa Beach CDP, Hawaii 11.7% 9.9% 18.9% 102 Hawaiian Paradise Park CDP, Hawaii 23.3% 19.6% 19.0% 103 Waimanalo CDP, Hawaii 9.7% 8.1% 20.4% 104 Wailua CDP, Hawaii 10.7% 8.9% 20.7% 105 Kaneohe Station CDP, Hawaii 9.0% 7.2% 24.5% 106 Kualapuu CDP, Hawaii 18.8% 15.1% 24.7% 107 Haliimaile CDP, Hawaii 9.2% 7.3% 26.6% 108 Village Park CDP, Hawaii 6.6% 5.0% 30.2% 109 Naalehu CDP, Hawaii 28.9% 20.4% 41.7% 110 Wailea-Makena CDP, Hawaii 9.4% 6.6% 41.9% 111 Fern Acres CDP, Hawaii 23.8% 16.4% 44.9% 112 Makawao CDP, Hawaii 14.6% 9.6% 51.8% 113 Pepeekeo CDP, Hawaii 32.3% 20.7% 56.3% 114 Paukaa CDP, Hawaii 14.3% 8.9% 61.9% 115 Kapaau CDP, Hawaii 13.4% 7.8% 71.5% 116 Kaanapali CDP, Hawaii 4.7% 2.7% 73.9% 117 Paauilo CDP, Hawaii 21.5% 12.3% 75.0% 118 Maalaea CDP, Hawaii 6.8% 3.7% 81.0% 119 Lawai CDP, Hawaii 9.2% 4.9% 88.9% 120 Ewa Gentry CDP, Hawaii 5.0% 2.6% 89.7% 121 Schofield Barracks CDP, Hawaii 14.7% 7.2% 103.5% 122 Kalaheo CDP, Hawaii 5.0% 2.4% 107.7%
  • 5. Rank Geography Percent Percent Percent Change from among Below Below 1999-2009 Hawaii Poverty Level Poverty Level CDP in 2009 in 1999 123 Princeville CDP, Hawaii 18.4% 8.1% 127.4% 124 Lihue CDP, Hawaii 10.7% 4.6% 134.0% 125 Puako CDP, Hawaii 8.0% 3.1% 162.0% 126 Waikapu CDP, Hawaii 5.4% 1.9% 183.1% 127 Paia CDP, Hawaii 27.1% 8.9% 206.5% 128 Maunaloa CDP, Hawaii 68.5% 22.3% 207.4% 129 Iroquois Point CDP, Hawaii 5.6% 1.8% 220.1% 130 Heeia CDP, Hawaii 2.2% 0.5% 351.1% 131 Barbers Point Housing CDP, Hawaii 14.5% 0.0% (Cannot Divide By Zero)