1. 26thNov’14 Equity Bazaar
NIFTY
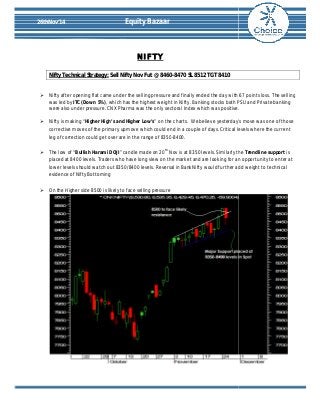
Nifty Technical Strategy: Sell Nifty Nov Fut @ 8
8460-8470 SL 8512 TGT 8410
Nifty after opening flat came under the selling pressure and finally ended the
was led by ITC (Down 5%), which has the highest weight in Nifty.
were also under pressure. CNX Pharma was the only sectoral Index which was positive.
Nifty is making “Higher High’s and Higher Low’s
corrective moves of the primary upmove
leg of correction could get over are in the range of 8350
The low of “Bullish Harami DOJI” candle made on 20
move was one of those
placed at 8400 levels. Traders who have long view on the market and are looking for an
lower levels should watch out 8350/8400 levels. Reversal in BankNifty would further add weight to technical
evidence of Nifty Bottoming
On the Higher side 8500 is likely to face selling pressure
day with 67 points loss. The selling
Banking stocks both PSU and Private banking
h’s Low’s” on the charts. We believe yesterday’s
which could end in a couple of days. Critical levels where the current
8350-8400.
” 20th Nov is at 8350 levels. Similarly the
Trendline support is
opportunity to enter at
2. 26thNov’14 Equity Bazaar
Bank Nifty
Bank Nifty Technical Strategy: Sell
BankNifty Nov Fut @ 18090-18100 SL 17170
BankNifty’s today high of 18320 was close to yesterday’s high of 18329.
We have seen RSI reversing from overbought levels of 77
77-78
170 TGT 17950
The above two observation in BankNifty suggests that BankNifty in yesterday’s trade succumbed to selling
pressure. However we must not forget that
major damage to the chart
BankNifty is still structurally positive. . A single day fall will not inflict
Traders who have long view on BankNifty and are looking to go long at lower levels should watch 17680/17720
levels carefully. Crucial supports are placed in the form of “Runaway gap” and
“Trendline Support”
3. 26thNov’14 Equity Bazaar
Stock of the Day
ONGC Technical Strategy: Buy ONGC
ONGC had made a “Bullish Enguling
Candle”.
in yesterday’s trade.
We have seen Volume based buying
We have seen uptick in RSI.
Nov Fut @ 385-385.2 SL 381.8 TGT 391.2
We believe the stock has the potential to move
positionaly to above 400 levels
4. 26thNov’14 Equity Bazaar
Future & Option
FNO Highlights
The highest Put base is at the 8300 strike with 6
60 lakh shares.
The 8500 and 8600 calls witnessed addition of
saw reduction of 22.05 and 5.70 lakh shares each
FIIs bought Rs. 1169crore while DIIs
FII sold Rs639crore in index futures and
Nifty futures premium decreased and settled at
FNO Highlights
se 8500 strike with
00 and8400 put strikes
Long Build-up was seen in Zee Entertainment, Dabur, Hero MotoCorp and GAIL while short buld
Unitech, ITC, NHPC and NMDC
We saw short covering in PFC, Petronet LNG, Biocon and GMR Infra whereas long closure was seen in IDBI,
Voltas, Axis Bank and Federal Bank
Analysis
se 61 lakh shares while the highestCall base is at the 8
16.5 and 10.5 lakh shares, each. The 8500
each.
crore sold Rs.732crore in the cash segment.
crore sold Rs307crore in Stock futures.
mium 3 points. India VIX increased 4% and settled at 1
% 13.89
buld-up was seen in
8. 26thNov’14 Equity Bazaar
Disclaimer
This is solely for information of clients of
Choice Broking and does not construe to be an investment
advice. It is also not intended as an offer or solicitation for the purchase and sale of any financial
instruments. Any action taken by you on the basis of the information contained herein is your
responsibility sponsibility alone and Choice Broking its subsidiaries or its employees or associates will not be liable in
any manner for the consequences of such action taken by you. We have exercised due diligence in
checking the correctness and authenticity of the information inf
ormation contained in this recommendation, but
Choice Broking or any of its subsidiaries or associates or employees shall not be in any way responsible
for any loss or damage that may arise to any person from any inadvertent error in the information
contained ned in this recommendation or any action taken on basis of this information. Technical analysis
studies market psychology, price patterns and volume levels. It is used to forecast future price and
market movements. Technical analysis is complementary to fundamental fu
ndamental analysis and news sources.
The recommendations issued herewith might be contrary to recommendations issued by Choice Broking
in the company research undertaken as the recommendations stated in this report is derived purely from
technical analysis. . Choice Broking has based this document on information obtained from sources it
believes to be reliable but which it has not independently verified; Choice Broking makes no guarantee,
representation or warranty and accepts no responsibility or liability as a
s to its accuracy or completeness.
The opinions contained within the report are based upon publicly available information at the time of
publication and are subject to change without notice. The information and any disclosures provided
herein are in summary y form and have been prepared for informational purposes. The recommendations
and suggested price levels are intended purely for trading purposes. The recommendations are valid for
the day of the report however trading trends and volumes might vary substantially substan
tially on an intraday basis
and the recommendations may be subject to change. The information and any disclosures provided
herein may be considered confidential. Any use, distribution, modification, copying, forwarding or
disclosure by any person is strictly ly prohibited. The information and any disclosures provided herein do
not constitute a solicitation or offer to purchase or sell any security or other financial product or
instrument. The current performance may be unaudited. Past performance does not guar
guarantee future
returns. There can be no assurance that investments will achieve any targeted rates of return, and there
is no guarantee against the loss of your entire investment.
POTENTIAL CONFLICT OF INTEREST DISCLOSURE (as on date of report) Disclosure
of interest statement
• Analyst interest of the stock /Instrument(s):
- No. • Firm interest of the stock / Instrument (s):
–
- No.