
Recommended
More Related Content
What's hot
What's hot (20)
Similar to 1 statistical analysis notes
Similar to 1 statistical analysis notes (20)
More from cartlidge
More from cartlidge (20)
1 statistical analysis notes
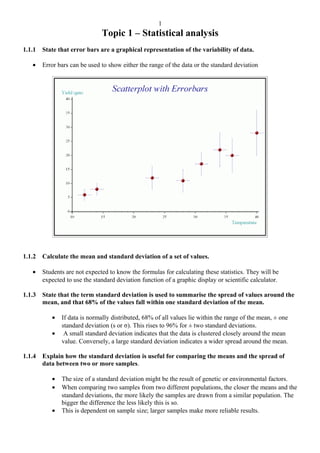
- 1. Topic 1 – Statistical analysis 1.1.1 State that error bars are a graphical representation of the variability of data. • Error bars can be used to show either the range of the data or the standard deviation 1.1.2 Calculate the mean and standard deviation of a set of values. • Students are not expected to know the formulas for calculating these statistics. They will be expected to use the standard deviation function of a graphic display or scientific calculator. 1.1.3 State that the term standard deviation is used to summarise the spread of values around the mean, and that 68% of the values fall within one standard deviation of the mean. • If data is normally distributed, 68% of all values lie within the range of the mean, ± one standard deviation (s or σ). This rises to 96% for ± two standard deviations. • A small standard deviation indicates that the data is clustered closely around the mean value. Conversely, a large standard deviation indicates a wider spread around the mean. 1.1.4 Explain how the standard deviation is useful for comparing the means and the spread of data between two or more samples. • The size of a standard deviation might be the result of genetic or environmental factors. • When comparing two samples from two different populations, the closer the means and the standard deviations, the more likely the samples are drawn from a similar population. The bigger the difference the less likely this is so. • This is dependent on sample size; larger samples make more reliable results. 1
- 2. values numberoftimeseachvalue occurs mean normal distribution curve 95% CI95% CI 1.1.5 Deduce the significance of the difference between two sets of data using calculated values for t and the appropriate tables. • For the t-test to be applied, the data must have a normal distribution and a sample size of at least 10. • The t-test can be used to compare two sets of data and measure the amount of overlap. • .For example are plants treated with fertiliser taller than those without? If the means of the two sets are very different, then it is easy to decide, but often the means are quite close and it is difficult to judge whether the two sets are the same or are significantly different. • To compare two sets of data use the t-test, which tells you the probability (P) that there is no difference between the two sets. This is called the null hypothesis (H0 ). • P varies from 0 (impossible) to 1 (certain). • The higher the probability, the more likely it is that the two sets are the same, and that any differences are just due to random chance. The lower the probability, the more likely it is that that the two sets are significantly different, and that any differences are real. • Where do you draw the line between these two conclusions? In biology the critical probability is usually taken as 0.05 (or 5%). This may seem very low, but it reflects the facts that biology experiments are expected to produce quite varied results. So if P > 5% then the two sets are the same (i.e. accept the null hypothesis), and if P < 5% then the two sets are different (i.e. reject the null hypothesis). • Students will not be expected to calculate values of t 1.1.6 Explain that the existence of a correlation dos not establish that there is a causal relationship between two variables. • Correlation statistics are used to investigate an association between two factors such as age and height; weight and blood pressure; or smoking and lung cancer. • After collecting as many pairs of measurements as possible of the two factors, plot a scatter graph of one against the other. • If both factors increase together then there is a positive correlation, or if one factor decreases when the other increases then there is a negative correlation. If the scatter graph has apparently random points then there is no correlation. 2
- 3. v a r ia b le 1 variable2 v a r ia b le 1 variable2 v a r ia b le 1 variable2 P o s i t i v e C o r r e l a t i o n N e g a ti v e C o r r e l a t i o n N o C o r r e la t io n 3