Downloaded 1,218 times


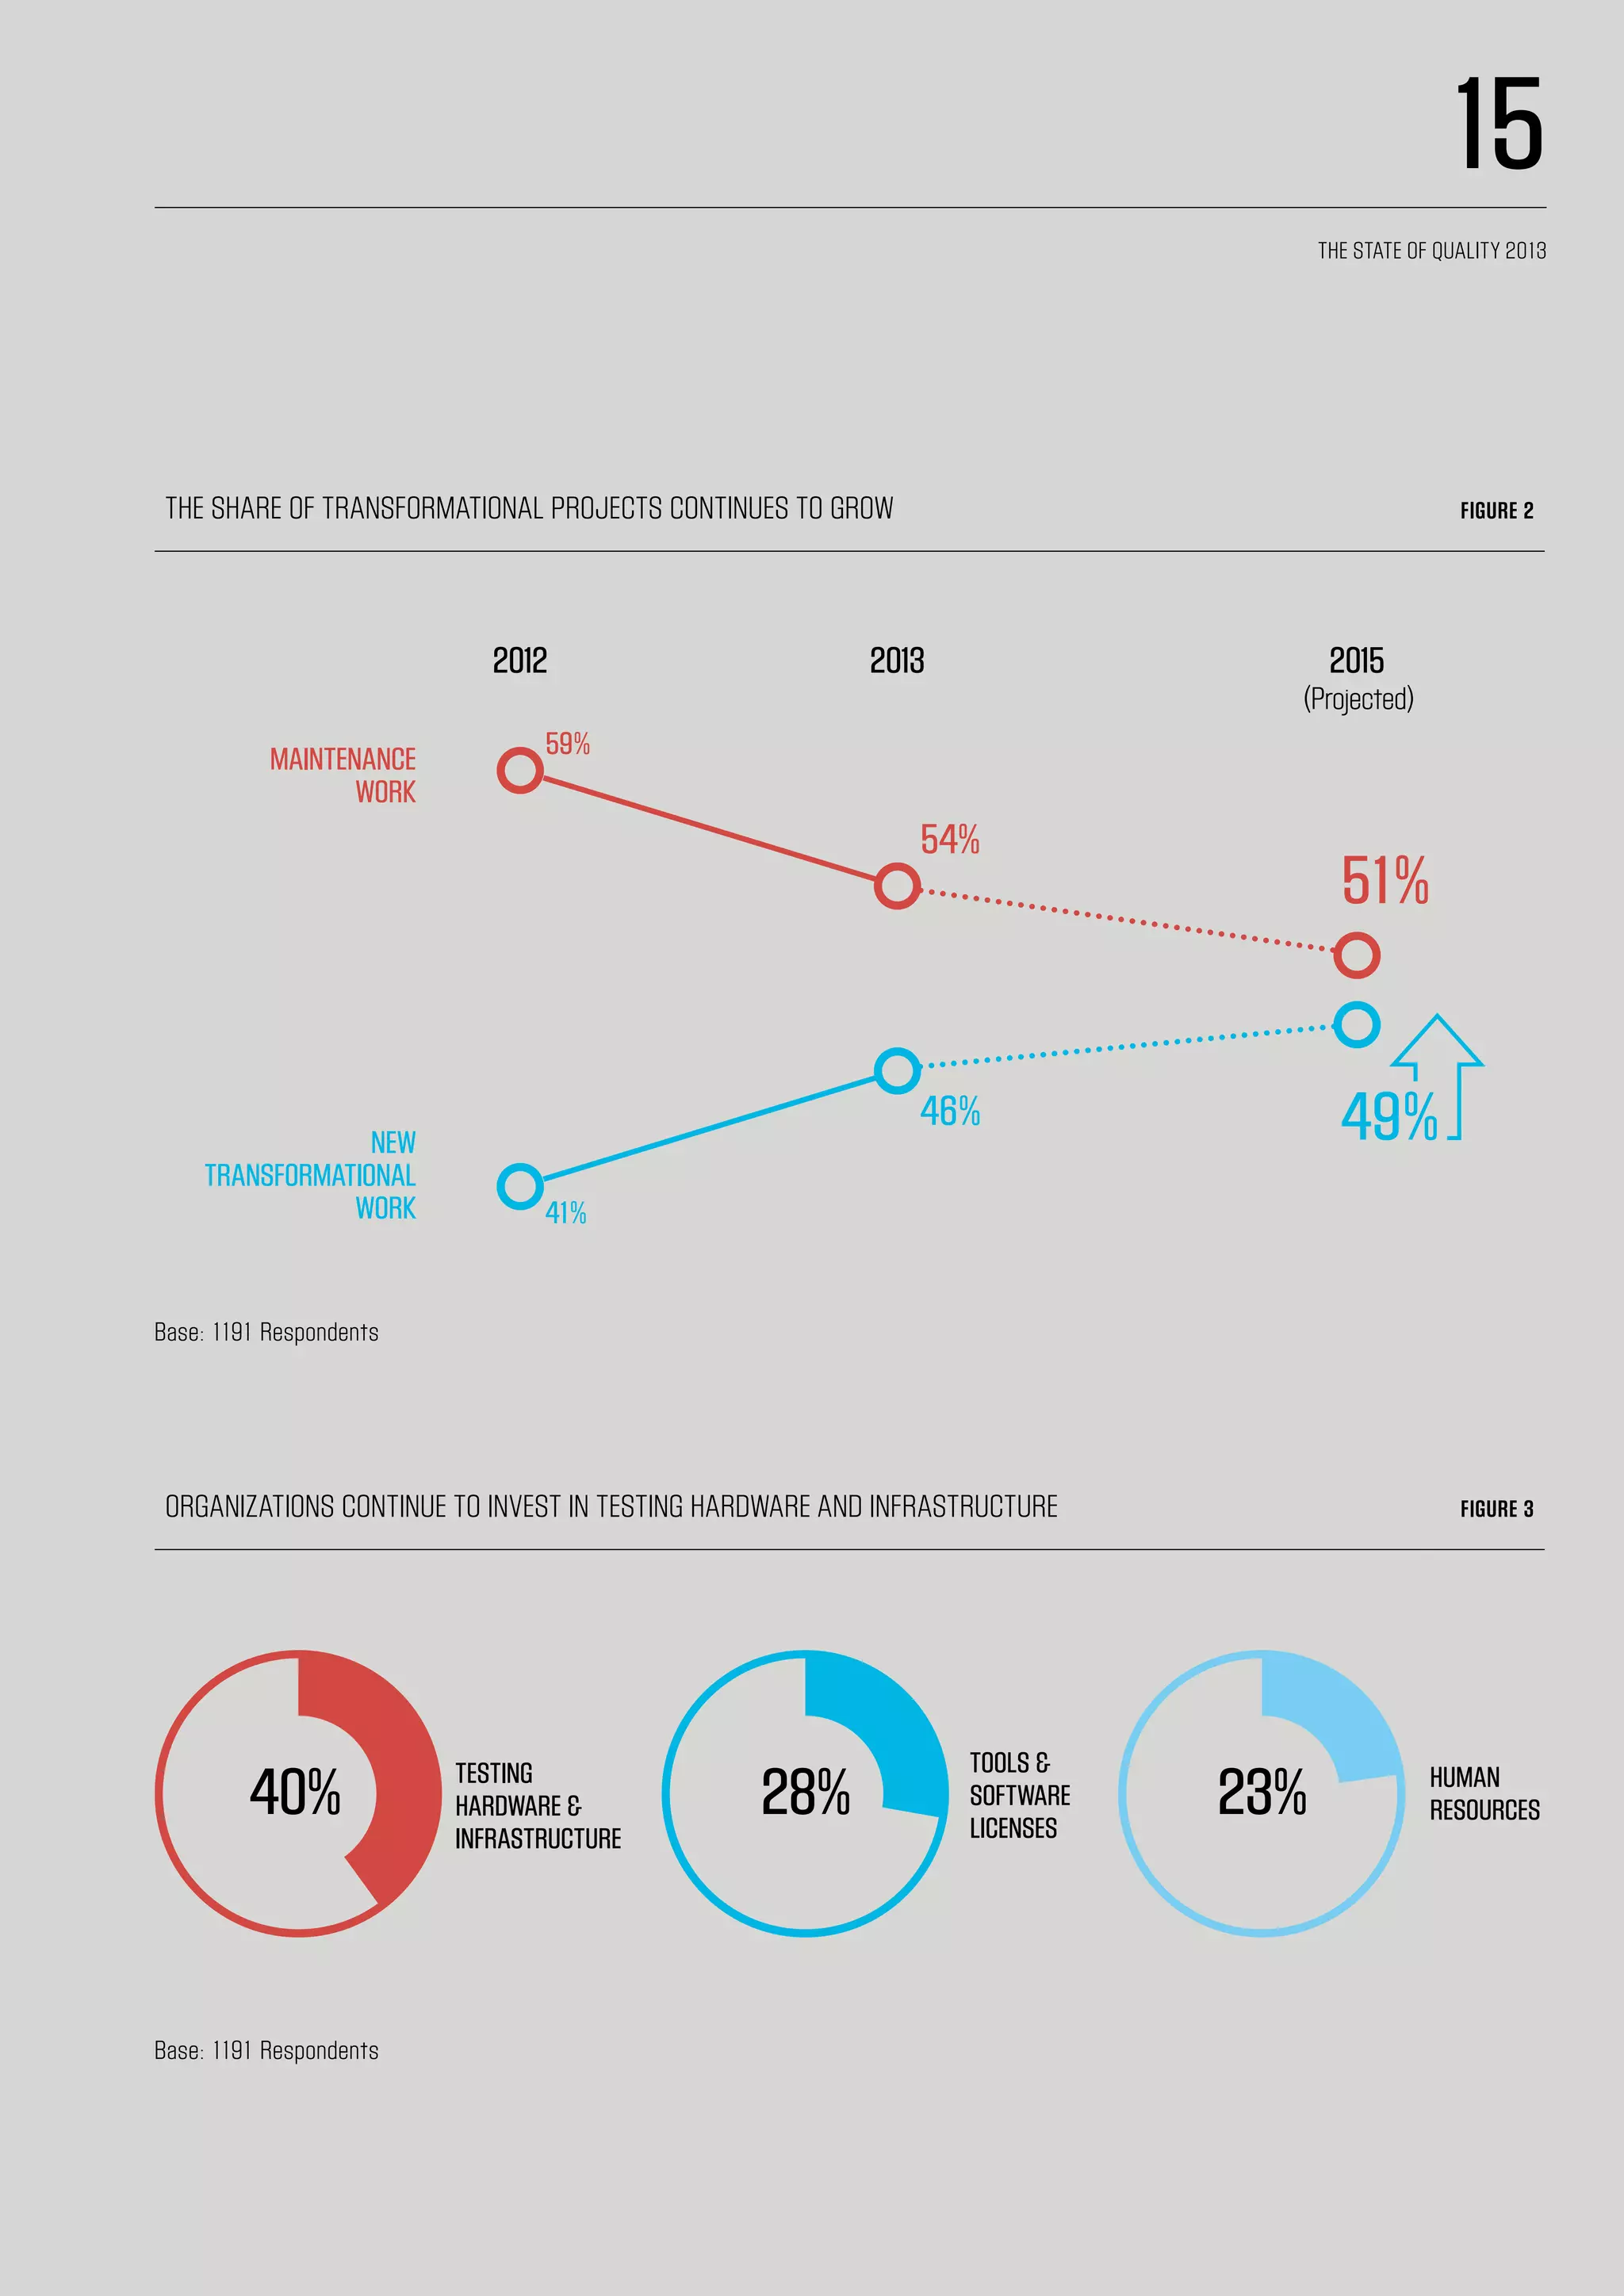


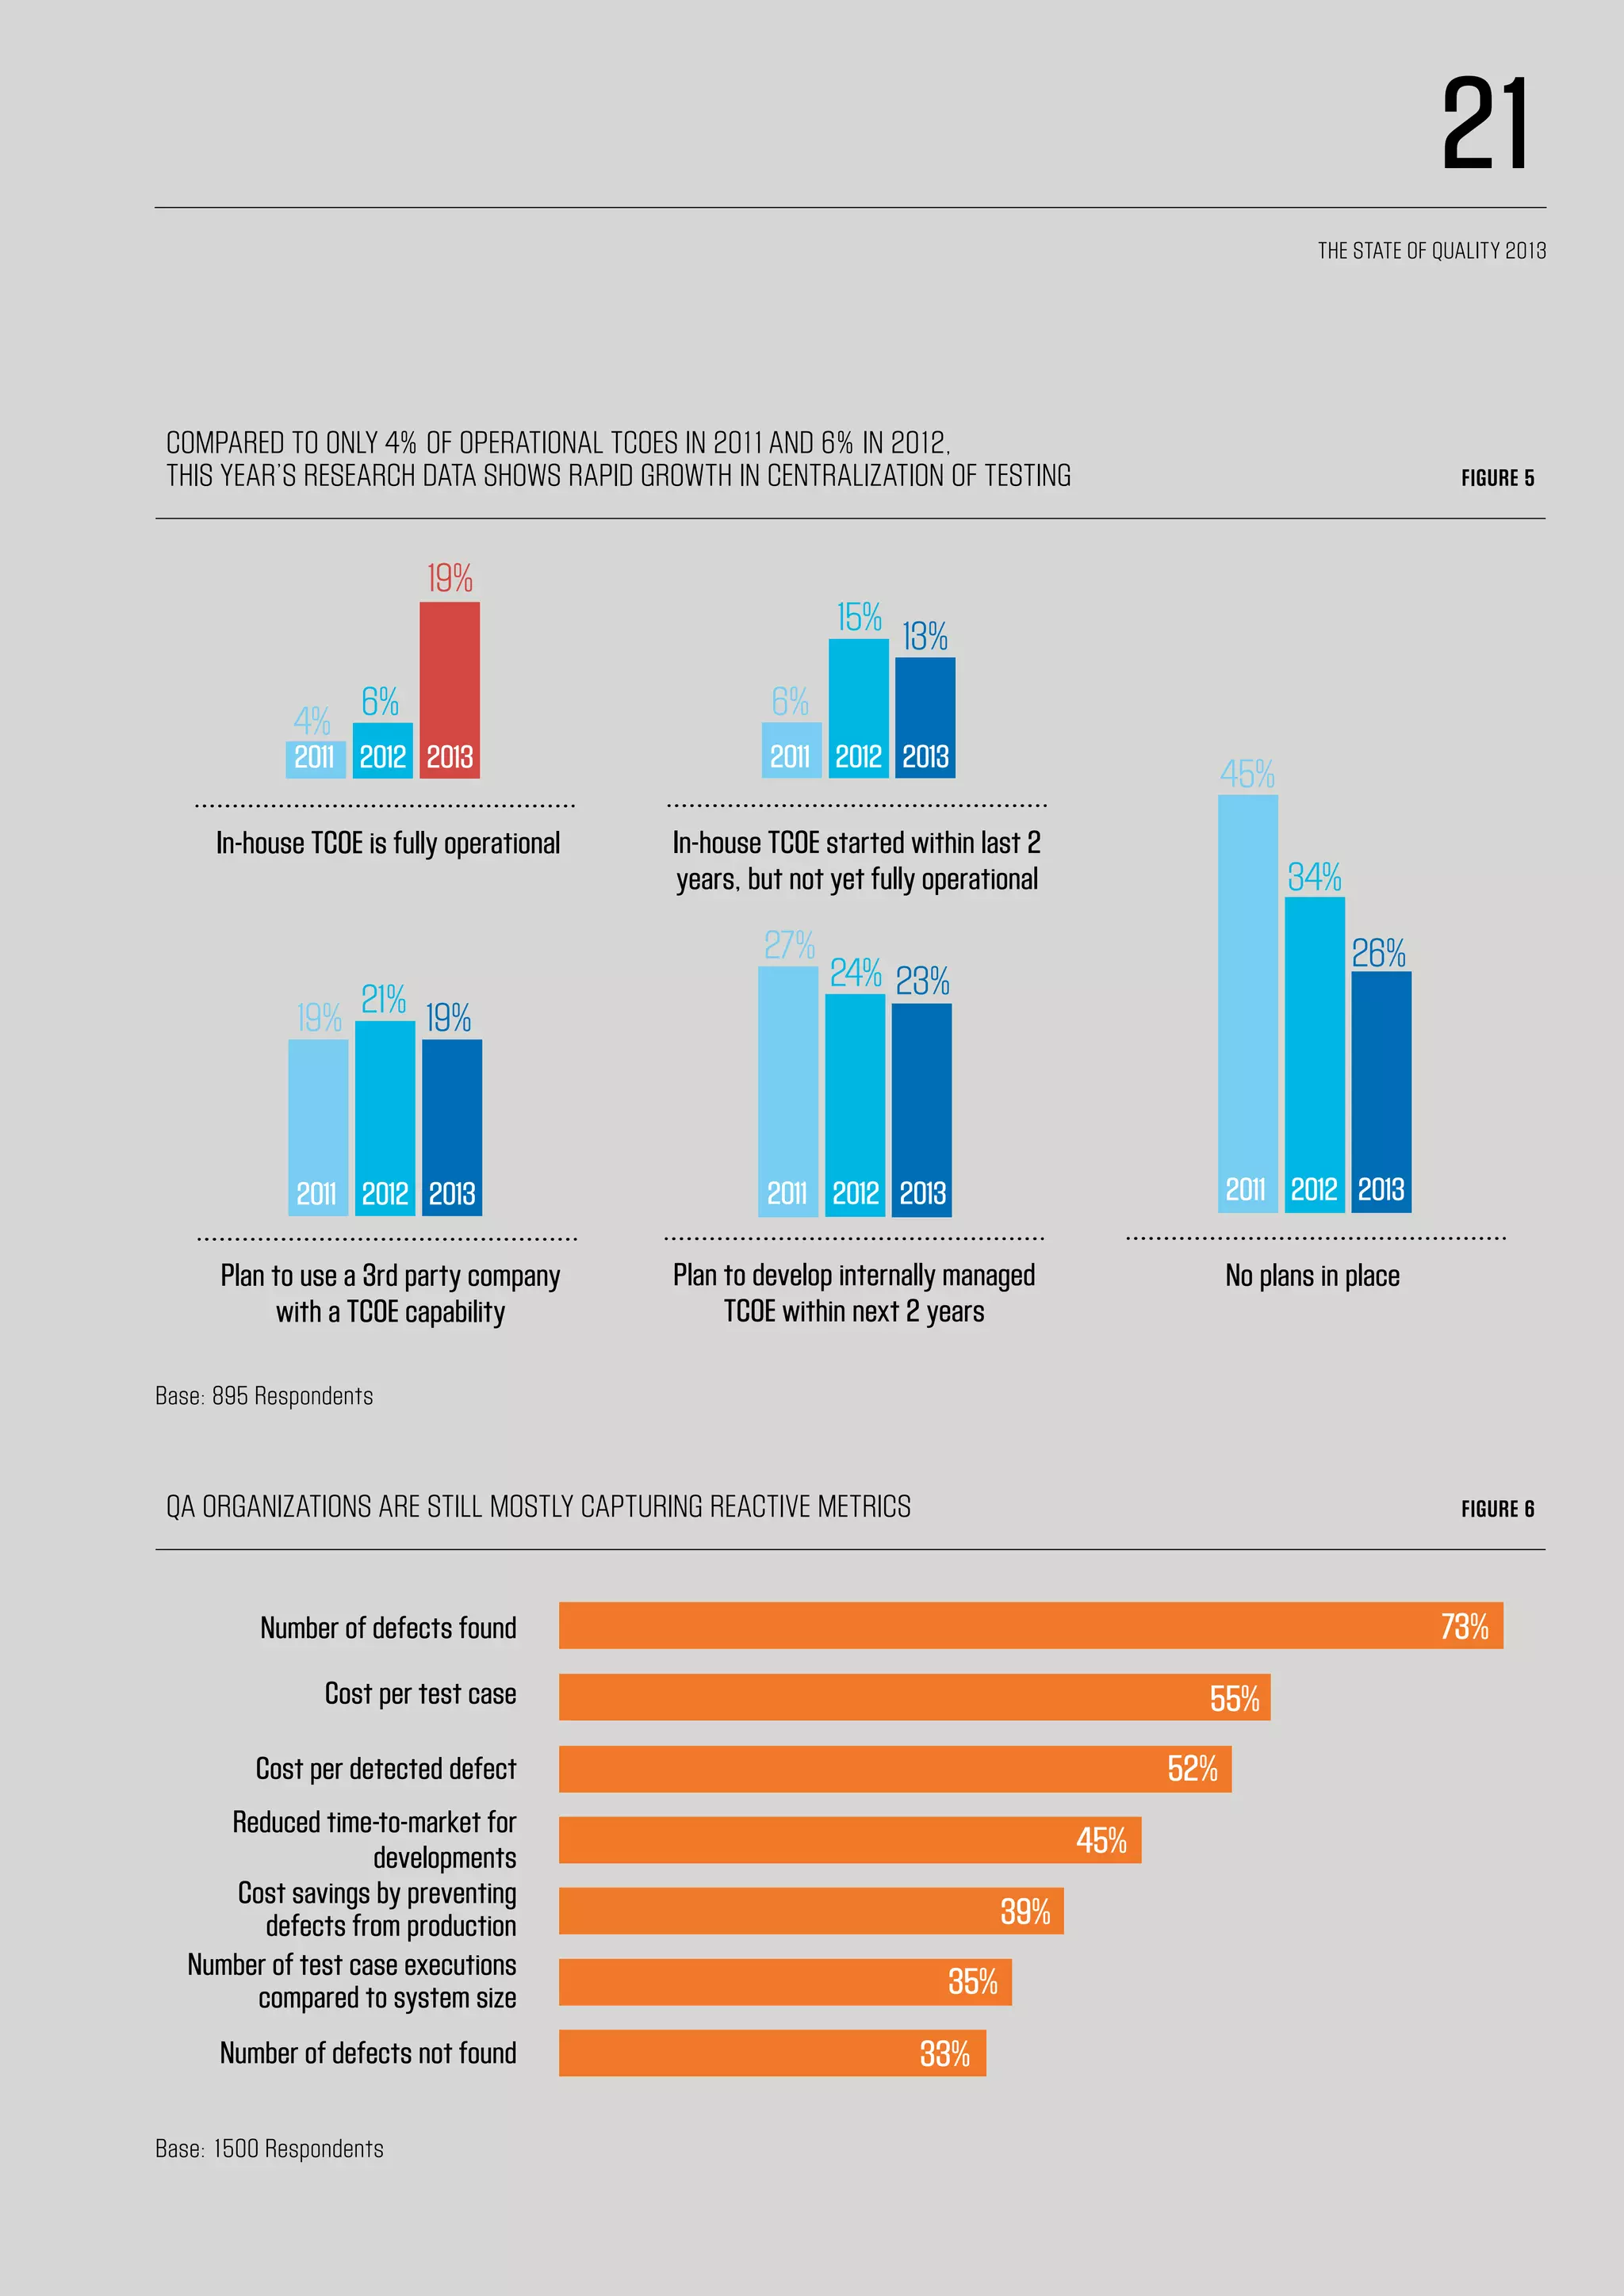


The fifth edition of the World Quality Report highlights ongoing trends in quality assurance and testing, indicating an increasing budget allocation towards these functions, particularly for transformational projects. It reveals that organizations are working to centralize QA processes and are facing challenges with mobile and agile testing methodologies. The report emphasizes the importance of early engagement in testing and the need for business-oriented metrics to demonstrate the value of QA efforts.


![Mello anthony despierta charlas sobre la espiritualidad [doc]](https://cdn.slidesharecdn.com/ss_thumbnails/melloanthony-despiertacharlassobrelaespiritualidaddoc-120502093358-phpapp01-thumbnail.jpg?width=640&height=640&fit=bounds)


![[GUTS-RS] World Quality Report 2014-15 Key Findings](https://cdn.slidesharecdn.com/ss_thumbnails/guts-rsapresentaomaro2015-150313173442-conversion-gate01-thumbnail.jpg?width=640&height=640&fit=bounds)


