(Fall 2012) The Effects of User Characteristics on Iris Capture
•
0 likes•171 views

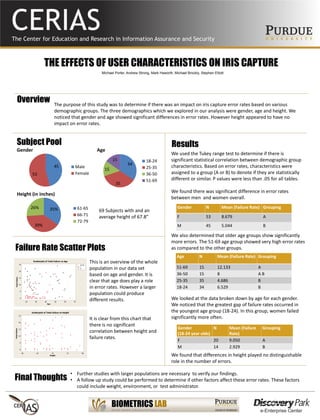
The purpose of this study was to determine if there was an impact on iris capture error rates based on various demographic groups. The three demographics which we explored in our analysis were gender, age and height. We noticed that gender and age showed significant differences in error rates. However height appeared to have no impact on error rates.
Report
Share
Report
Share
Download to read offline
Recommended
Author: Ian BennettThe Contribution of Health Literacy to Disparities in Self Related Health Sta...
The Contribution of Health Literacy to Disparities in Self Related Health Sta...Leonard Davis Institute of Health Economics
Recommended
Author: Ian BennettThe Contribution of Health Literacy to Disparities in Self Related Health Sta...
The Contribution of Health Literacy to Disparities in Self Related Health Sta...Leonard Davis Institute of Health Economics
A new analytical method and new results for 44 countries, 1974-2006Measuring adult mortality using sibling survival
Measuring adult mortality using sibling survivalInstitute for Health Metrics and Evaluation - University of Washington
Identifying “mischievous” responders through Latent Class Analysis
Identifying “mischievous” responders through Latent Class AnalysisCenter for Innovative Public Health Research
More Related Content
Similar to (Fall 2012) The Effects of User Characteristics on Iris Capture
A new analytical method and new results for 44 countries, 1974-2006Measuring adult mortality using sibling survival
Measuring adult mortality using sibling survivalInstitute for Health Metrics and Evaluation - University of Washington
Identifying “mischievous” responders through Latent Class Analysis
Identifying “mischievous” responders through Latent Class AnalysisCenter for Innovative Public Health Research
Similar to (Fall 2012) The Effects of User Characteristics on Iris Capture (20)
KMorton Gender dimorphism and its effect on mortality in traumatically brain ...
KMorton Gender dimorphism and its effect on mortality in traumatically brain ...
Page 1 of 1 PSY2061 Research Methods Lab © 2013 South Un.docx
Page 1 of 1 PSY2061 Research Methods Lab © 2013 South Un.docx
Page 1 of 1 PSY2061 Research Methods Lab © 2013 South Un.docx
Page 1 of 1 PSY2061 Research Methods Lab © 2013 South Un.docx
8141410.pptbbbbbbbnnnnnnnnnnnnnnnnnnnnnnnnnnnnnnnnnnnnnnnnnnnnnnnnnnnnnnnnnnn
8141410.pptbbbbbbbnnnnnnnnnnnnnnnnnnnnnnnnnnnnnnnnnnnnnnnnnnnnnnnnnnnnnnnnnnn
ANRV381-SO35-23 ARI 5 June 2009 934Income Inequality and.docx
ANRV381-SO35-23 ARI 5 June 2009 934Income Inequality and.docx
EXTRA CREDIT Graphing exercises (up to 100 points) N.docx
EXTRA CREDIT Graphing exercises (up to 100 points) N.docx
Couples in the UK Labour Market: Labour Supply And Sociological Interpretati...
Couples in the UK Labour Market: Labour Supply And Sociological Interpretati...
Magellan Strategies 2012 Internal Survey Research Summary Memorandum 120612
Magellan Strategies 2012 Internal Survey Research Summary Memorandum 120612
Identifying “mischievous” responders through Latent Class Analysis
Identifying “mischievous” responders through Latent Class Analysis
Stats HomeworkChapter 12Please show all work. With each p.docx
Stats HomeworkChapter 12Please show all work. With each p.docx
More from International Center for Biometric Research
The human signature provides a natural and publically-accepted legally-admissible method for providing authentication to a process. Automatic biometric signature systems assess both the drawn image and the temporal aspects of signature construction, providing enhanced verification rates over and above conventional outcome assessment. To enable the capture of these constructional data requires the use of specialist ‘tablet’ devices. In this paper we explore the enrolment performance using a range of common signature capture devices and investigate the reasons behind user preference. The results show that writing feedback and familiarity with conventional ‘paper and pen’ donation configurations are the primary motivation for user preference. These results inform the choice of signature device from both technical performance and user acceptance viewpoints.An Investigation into Biometric Signature Capture Device Performance and User...
An Investigation into Biometric Signature Capture Device Performance and User...International Center for Biometric Research
This is the presentation given at the Biometrics 2014 conference in London on October 21st, 2014Advances in testing and evaluation using Human-Biometric sensor interaction m...
Advances in testing and evaluation using Human-Biometric sensor interaction m...International Center for Biometric Research
According to a report by Frost and Sullivan in 2007, revenues for non-AFIS fingerprint devices in notebook PC's and wireless devices is anticipated to grow from $148.5 million to $1588.0 million by 2014, a compound annual growth rate of 40.3% [1]. The AFIS market has a compound annual growth rate of 15.2% with revenues of $445.0 million in 2007. With the development of mobile applications in a number of different market segments, such as healthcare, retail, and law enforcement, this paper analyzed the performance of fingerprints of different sizes, from different sensors...(2010) Fingerprint recognition performance evaluation for mobile ID applications
(2010) Fingerprint recognition performance evaluation for mobile ID applicationsInternational Center for Biometric Research
More from International Center for Biometric Research (20)
An Investigation into Biometric Signature Capture Device Performance and User...
An Investigation into Biometric Signature Capture Device Performance and User...
Best Practices in Reporting Time Duration in Biometrics
Best Practices in Reporting Time Duration in Biometrics
Advances in testing and evaluation using Human-Biometric sensor interaction m...
Advances in testing and evaluation using Human-Biometric sensor interaction m...
(2010) Fingerprint recognition performance evaluation for mobile ID applications
(2010) Fingerprint recognition performance evaluation for mobile ID applications
Recently uploaded
💉💊+971581248768>> SAFE AND ORIGINAL ABORTION PILLS FOR SALE IN DUBAI AND ABUDHABI}}+971581248768
+971581248768 Mtp-Kit (500MG) Prices » Dubai [(+971581248768**)] Abortion Pills For Sale In Dubai, UAE, Mifepristone and Misoprostol Tablets Available In Dubai, UAE CONTACT DR.Maya Whatsapp +971581248768 We Have Abortion Pills / Cytotec Tablets /Mifegest Kit Available in Dubai, Sharjah, Abudhabi, Ajman, Alain, Fujairah, Ras Al Khaimah, Umm Al Quwain, UAE, Buy cytotec in Dubai +971581248768''''Abortion Pills near me DUBAI | ABU DHABI|UAE. Price of Misoprostol, Cytotec” +971581248768' Dr.DEEM ''BUY ABORTION PILLS MIFEGEST KIT, MISOPROTONE, CYTOTEC PILLS IN DUBAI, ABU DHABI,UAE'' Contact me now via What's App…… abortion Pills Cytotec also available Oman Qatar Doha Saudi Arabia Bahrain Above all, Cytotec Abortion Pills are Available In Dubai / UAE, you will be very happy to do abortion in Dubai we are providing cytotec 200mg abortion pill in Dubai, UAE. Medication abortion offers an alternative to Surgical Abortion for women in the early weeks of pregnancy. We only offer abortion pills from 1 week-6 Months. We then advise you to use surgery if its beyond 6 months. Our Abu Dhabi, Ajman, Al Ain, Dubai, Fujairah, Ras Al Khaimah (RAK), Sharjah, Umm Al Quwain (UAQ) United Arab Emirates Abortion Clinic provides the safest and most advanced techniques for providing non-surgical, medical and surgical abortion methods for early through late second trimester, including the Abortion By Pill Procedure (RU 486, Mifeprex, Mifepristone, early options French Abortion Pill), Tamoxifen, Methotrexate and Cytotec (Misoprostol). The Abu Dhabi, United Arab Emirates Abortion Clinic performs Same Day Abortion Procedure using medications that are taken on the first day of the office visit and will cause the abortion to occur generally within 4 to 6 hours (as early as 30 minutes) for patients who are 3 to 12 weeks pregnant. When Mifepristone and Misoprostol are used, 50% of patients complete in 4 to 6 hours; 75% to 80% in 12 hours; and 90% in 24 hours. We use a regimen that allows for completion without the need for surgery 99% of the time. All advanced second trimester and late term pregnancies at our Tampa clinic (17 to 24 weeks or greater) can be completed within 24 hours or less 99% of the time without the need surgery. The procedure is completed with minimal to no complications. Our Women's Health Center located in Abu Dhabi, United Arab Emirates, uses the latest medications for medical abortions (RU-486, Mifeprex, Mifegyne, Mifepristone, early options French abortion pill), Methotrexate and Cytotec (Misoprostol). The safety standards of our Abu Dhabi, United Arab Emirates Abortion Doctors remain unparalleled. They consistently maintain the lowest complication rates throughout the nation. Our Physicians and staff are always available to answer questions and care for women in one of the most difficult times in their lives. The decision to have an abortion at the Abortion Cl+971581248768>> SAFE AND ORIGINAL ABORTION PILLS FOR SALE IN DUBAI AND ABUDHA...
+971581248768>> SAFE AND ORIGINAL ABORTION PILLS FOR SALE IN DUBAI AND ABUDHA...?#DUbAI#??##{{(☎️+971_581248768%)**%*]'#abortion pills for sale in dubai@
Enterprise Knowledge’s Urmi Majumder, Principal Data Architecture Consultant, and Fernando Aguilar Islas, Senior Data Science Consultant, presented "Driving Behavioral Change for Information Management through Data-Driven Green Strategy" on March 27, 2024 at Enterprise Data World (EDW) in Orlando, Florida.
In this presentation, Urmi and Fernando discussed a case study describing how the information management division in a large supply chain organization drove user behavior change through awareness of the carbon footprint of their duplicated and near-duplicated content, identified via advanced data analytics. Check out their presentation to gain valuable perspectives on utilizing data-driven strategies to influence positive behavioral shifts and support sustainability initiatives within your organization.
In this session, participants gained answers to the following questions:
- What is a Green Information Management (IM) Strategy, and why should you have one?
- How can Artificial Intelligence (AI) and Machine Learning (ML) support your Green IM Strategy through content deduplication?
- How can an organization use insights into their data to influence employee behavior for IM?
- How can you reap additional benefits from content reduction that go beyond Green IM?
Driving Behavioral Change for Information Management through Data-Driven Gree...
Driving Behavioral Change for Information Management through Data-Driven Gree...Enterprise Knowledge
Recently uploaded (20)
Workshop - Best of Both Worlds_ Combine KG and Vector search for enhanced R...
Workshop - Best of Both Worlds_ Combine KG and Vector search for enhanced R...
AWS Community Day CPH - Three problems of Terraform
AWS Community Day CPH - Three problems of Terraform
[2024]Digital Global Overview Report 2024 Meltwater.pdf
[2024]Digital Global Overview Report 2024 Meltwater.pdf
ProductAnonymous-April2024-WinProductDiscovery-MelissaKlemke
ProductAnonymous-April2024-WinProductDiscovery-MelissaKlemke
Tech Trends Report 2024 Future Today Institute.pdf
Tech Trends Report 2024 Future Today Institute.pdf
Understanding Discord NSFW Servers A Guide for Responsible Users.pdf
Understanding Discord NSFW Servers A Guide for Responsible Users.pdf
Mastering MySQL Database Architecture: Deep Dive into MySQL Shell and MySQL R...
Mastering MySQL Database Architecture: Deep Dive into MySQL Shell and MySQL R...
Tata AIG General Insurance Company - Insurer Innovation Award 2024
Tata AIG General Insurance Company - Insurer Innovation Award 2024
+971581248768>> SAFE AND ORIGINAL ABORTION PILLS FOR SALE IN DUBAI AND ABUDHA...
+971581248768>> SAFE AND ORIGINAL ABORTION PILLS FOR SALE IN DUBAI AND ABUDHA...
Axa Assurance Maroc - Insurer Innovation Award 2024
Axa Assurance Maroc - Insurer Innovation Award 2024
TrustArc Webinar - Unlock the Power of AI-Driven Data Discovery
TrustArc Webinar - Unlock the Power of AI-Driven Data Discovery
Driving Behavioral Change for Information Management through Data-Driven Gree...
Driving Behavioral Change for Information Management through Data-Driven Gree...
2024: Domino Containers - The Next Step. News from the Domino Container commu...
2024: Domino Containers - The Next Step. News from the Domino Container commu...
HTML Injection Attacks: Impact and Mitigation Strategies
HTML Injection Attacks: Impact and Mitigation Strategies
Exploring the Future Potential of AI-Enabled Smartphone Processors
Exploring the Future Potential of AI-Enabled Smartphone Processors
Apidays New York 2024 - Scaling API-first by Ian Reasor and Radu Cotescu, Adobe
Apidays New York 2024 - Scaling API-first by Ian Reasor and Radu Cotescu, Adobe
(Fall 2012) The Effects of User Characteristics on Iris Capture
- 1. THE EFFECTS OF USER CHARACTERISTICS ON IRIS CAPTURE The purpose of this study was to determine if there was an impact on iris capture error rates based on various demographic groups. The three demographics which we explored in our analysis were gender, age and height. We noticed that gender and age showed significant differences in error rates. However height appeared to have no impact on error rates. Michael Porter, Andrew Strong, Mark Haworth, Michael Brockly, Stephen Elliott Overview Subject Pool Gender Age Height (in inches) 45 53 Male Female 34 35 15 15 18-24 25-35 36-50 51-69 We used the Tukey range test to determine if there is significant statistical correlation between demographic group characteristics. Based on error rates, characteristics were assigned to a group (A or B) to denote if they are statistically different or similar. P values were less than .05 for all tables. We found there was significant difference in error rates between men and women overall. We also determined that older age groups show significantly more errors. The 51-69 age group showed very high error rates as compared to the other groups. We looked at the data broken down by age for each gender. We noticed that the greatest gap of failure rates occurred in the youngest age group (18-24). In this group, women failed significantly more often. We found that differences in height played no distinguishable role in the number of errors. Gender N Mean (Failure Rate) Grouping F 53 8.679 A M 45 5.044 B Age N Mean (Failure Rate) Grouping 51-69 15 12.133 A 36-50 15 8 A B 25-35 35 4.686 B 18-24 34 6.529 B Gender (18-24 year olds) N Mean (Failure Rate) Grouping F 20 9.050 A M 14 2.929 B Results This is an overview of the whole population in our data set based on age and gender. It is clear that age does play a role in error rates. However a larger population could produce different results. It is clear from this chart that there is no significant correlation between height and failure rates. Final Thoughts • Further studies with larger populations are necessary to verify our findings. • A follow up study could be performed to determine if other factors affect these error rates. These factors could include weight, environment, or test administrator. Failure Rate Scatter Plots 35% 39% 26% 61-65 66-71 72-79 69 Subjects with and an average height of 67.8”