
Recommended
Recommended
More Related Content
Similar to Steroid Study Confidence Intervals
Similar to Steroid Study Confidence Intervals (11)
More from aman341480
More from aman341480 (20)
Recently uploaded
Recently uploaded (20)
Steroid Study Confidence Intervals
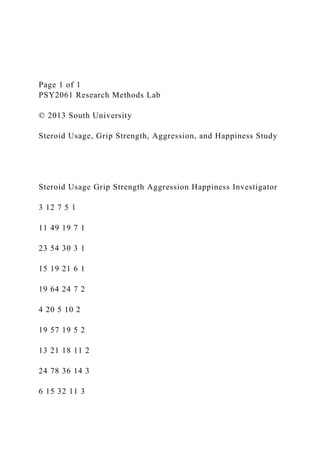
- 1. Page 1 of 1 PSY2061 Research Methods Lab © 2013 South University Steroid Usage, Grip Strength, Aggression, and Happiness Study Steroid Usage Grip Strength Aggression Happiness Investigator 3 12 7 5 1 11 49 19 7 1 23 54 30 3 1 15 19 21 6 1 19 64 24 7 2 4 20 5 10 2 19 57 19 5 2 13 21 18 11 2 24 78 36 14 3 6 15 32 11 3
- 2. 14 17 4 9 3 29 87 26 5 4 2 12 8 5 4 17 74 22 6 4 4 35 6 7 4 Steroid Usage: The number entered reflects the number of weeks on steroids. Grip Strength: The number registered on a hand meter. The larger the number, the stronger the person; the scale cannot go higher than 100. Aggression: The number obtained on the McGuthry Aggression Inventory. The higher the number, the more aggression; the scale goes from 5 to 30. Happiness: The number obtained on the Happiness Scale. The higher the number, the happier the person is; the scale goes from 0 to 15. Investigator: The number assigned to the person who assessed the participant.
- 3. Chapter 3, Section 2, Exercise 068ad Bisphenol A in Your Soup Cans Bisphenol A (BPA) is in the lining of most canned goods, and recent studies have shown a positive association between BPA exposure and behavior and health problems. How much does canned soup consumption increase urinary BPA concentration? That was the question addressed in a recent study1 in which consumption of canned soup over five days was associated with a more than 1000% increase in urinary BPA. In the study, 75 participants ate either canned soup or fresh soup for lunch for five days. On the fifth day, urinary BPA levels were measured. After a two-day break, the participants switched
- 4. groups and repeated the process. The difference in BPA levels between the two treatments was measured for each participant. The study reports that a 95% confidence interval for the difference in means (canned minus fresh) is 19.6 to 25.5 μg/L. 1Carwile J., Ye X., Zhou X., Calafat A., and Michels K., "Canned Soup Consumption and Urinary Bisphenol A: A Randomized Crossover Trial," Journal of the American Medical Association, 2011; 306(20): 2218–2220. (a) Is this a randomized comparative experiment or a matched pairs experiment? Randomized comparative experiment Matched pairs experiment SHOW HINT LINK TO TEXT
- 5. (d) If the study had included 500 participants instead of 75, would you expect the confidence interval to be wider or narrower? Wider Narrower Click if you would like to Show Work for this question: Open Show Work SHOW HINT LINK TO TEXT
- 6. ter 3, Section 2, Exercise 061acd Have You Ever Been Arrested? According to a recent study of 7335 young people in the US, 30% had been arrested1 for a crime other than a traffic violation by the age of 23. Crimes included such things as vandalism, underage drinking, drunken driving, shoplifting, and drug possession. 1From a study in USA Today, quoted in The Week, 2012; 11: 547–548. (a) Is the 30% a parameter or a statistic? Parameter Statistic
- 7. SHOW HINT LINK TO TEXT (b) The margin of error for the population proportion estimate, p, is 0.01. Use this information to give a range of plausible values for the parameter. The plausible values for the proportion p range from to . SHOW HINT LINK TO TEXT (c) Given the margin of error in part (b), if we asked all young
- 8. people in the US if they have ever been arrested, is it likely that the actual proportion is less than 25%? Yes No Click if you would like to Show Work for this question: Open Show Work SHOW HINT LINK TO TEXT Question Attempts: 0 of 3 used SAVE FOR LATER SUBMIT ANSWER
- 9. Chapter 3, Section 1, Exercise 031 Graduate Programs in Statistics! One of the many wonderful things about studying statistics is that graduate programs in statistics often pay their graduate students, which means that many graduate students in statistics are able to attend graduate school tuition free with an assistantship or fellowship. In 2009, there were 82 US statistics or biostatistics doctoral programs for which enrollment data were available.1 The dataset StatisticsPhD lists all these schools together with the total enrollment of full-time graduate students in each program in 2009. Click here for the dataset associated with this question. Click here to access StatKey. 1Full list of the 82 Group IV departments was obtained at http://www.ams.org/profession/data/annual-survey/group_iv. Data on enrollment obtained primarily from Assistantships and Graduate Fellowships in the Mathematical Sciences, 2009, American Mathematical Society. The list does not include combined departments of mathematics and statistics and does not include departments that did not reply to the AMS survey.
- 10. (a) A random sample of 10 of the 82 enrollment values is given in the table below. Give the notation for the sample mean. University Department Enrollment Case Western Reserve University Statistics 11 University of South Carolina Biostatistics 45 Harvard University Statistics 67 University of California - Riverside Statistics 54 Medical University of South Carolina Biostatistics 46 University of Nebraska Statistics 44 New York University Statistics 6 University of Minnesota Biostatistics 48 University of Iowa
- 11. Biostatistics 35 Cornell University Statistics 78 SHOW HINT LINK TO TEXT (b) Compute the sample mean. Enter the exact answer. Sample mean= exact number, no tolerance SHOW HINT LINK TO TEXT
- 12. (c) Another random sample of 10 of the 82 enrollment values is given in the table below. Give the notation for this sample mean. University Department Enrollment University of Wisconsin Statistics 116 Baylor University Statistics 26 Yale University Statistics 36 Iowa State University Statistics 145 Boston University Biostatistics 39 University of Nebraska Statistics 44 Columbia University
- 13. Statistics 196 University of California - Los Angeles Biostatistics 60 University of California - Davis Statistics 34 Virginia Commonwealth University Statistics 15 SHOW HINT LINK TO TEXT (d) Compute the sample mean. Enter the exact answer. Sample mean = exact number, no tolerance
- 14. SHOW HINT LINK TO TEXT (e) Give the notation for the mean enrollment value for the entire population of these 82 graduate programs. SHOW HINT LINK TO TEXT
- 15. (f) Find the mean enrollment value for the entire population of these 82 graduate programs. Round your answer to two decimal places. Mean= the absolute tolerance is +/-0.1 SHOW HINT LINK TO TEXT (g) Consider the sampling distribution if we calculate many sample means taking samples of size n=10 from this population of enrollment values. What shape will it have? Skewed to the left Skewed to the right Symmetric and bell-shaped
- 16. Symmetric but not bell-shaped None of these SHOW HINT LINK TO TEXT (h) Where will the sampling distribution be centered? Round your answer to two decimal places. Center= the absolute tolerance is +/-0.5 Click if you would like to Show Work for this question: Open Show Work SHOW HINT LINK TO TEXT
- 17. Question Attempts: 0 of 3 used SAVE FOR LATER SUBMIT ANSWER Chapter 3, Section 2, Exercise 067bd Playing Video Games A new study provides some evidence that playing action video games strengthens a person's ability to translate sensory information quickly into accurate decisions. Researchers had 23 male volunteers with an average age of 20 look at moving arrays on a computer screen and indicate the direction in which the dots were moving.1 Half of the volunteers (11 men) reported playing action video games at least five times a week for the previous year, while the other 12 reported no
- 18. video game playing in the previous year. The response time and the accuracy score were both measured. A 95% confidence interval for the mean response time for game players minus the mean response time for non-players is -1.8 to -1.2 seconds, while a 95% confidence interval for mean accuracy score for game players minus mean accuracy score for non-players is - 4.2 to +5.8. 1Green, et al., "Improved probabilistic inference as a general learning mechanism with action video games," Current Biology, 2010; 20(September 14): 1. (a) Is it likely that game players and non-game players are basically the same in response time? If not, which group is faster (with a smaller response time)? Likely to be basically the same Not likely to be the same, and game players are faster Not likely to be the same, and non-game players are faster
- 19. SHOW HINT LINK TO TEXT (b) Is it likely that game players and non-game players are basically the same in accuracy? If not, which group is more accurate? Likely to be basically the same Not likely to be the same, and game players are more accurate Not likely to be the same, and non-game players are more accurate Click if you would like to Show Work for this question: Open Show Work SHOW HINT LINK TO TEXT
- 20. Chapter 3, Section 2, Exercise 066 Males vs Females and One True Love In a study, a random sample of 2625 US adults were asked whether they agree or disagree that there is "only one true love for each person." The response and gender of the participants is shown in Table 1. Male Female Total Agree 372 363 735 Disagree 807 1005
- 21. 1812 Don't know 34 44 78 Total 1213 1412 2625 Table 1 Is there only one true love for each person? (a) Use the information in the table to construct a 95% confidence interval for the difference in the proportion who agree, between males and females, using the fact that the standard error for the difference is 0.018. Round your answers to three decimal places. The 95% confidence interval is to . (b) Is it plausible that there is no difference between males and females in the proportion who agree that each person has only one true love? Click if you would like to Show Work for this question: Open Show Work SHOW HINT LINK TO TEXT
- 22. Question Attempts: 0 of 3 used SAVE FOR LATER SUBMIT ANSWER edicting Election Results Throughout the US presidential election of 2012, polls gave regular updates on the sample proportion supporting each candidate and the margin of error for the estimates. This attempt to predict the outcome of an election is a common use of polls.
- 23. In each case below, the proportion of voters who intend to vote for each candidate is given as well as a margin of error for the estimates. Indicate whether we can be relatively confident that candidate A would win if the election were held at the time of the poll. (Assume the candidate who gets more than 50% of the vote wins.) (a) Candidate A: 54% Candidate B: 46% Margin of error: ±5% Confident A would win Not confident in the outcome SHOW HINT LINK TO TEXT
- 24. (b) Candidate A: 52% Candidate B: 48% Margin of error: ±1% Confident A would win Not confident in the outcome SHOW HINT LINK TO TEXT (c)
- 25. Candidate A: 53% Candidate B: 47% Margin of error: ±2% Confident A would win Not confident in the outcome SHOW HINT LINK TO TEXT (d) Candidate A: 58% Candidate B: 42% Margin of error: ±10% Confident A would win
- 26. Not confident in the outcome Click if you would like to Show Work for this question: Open Show Work SHOW HINT LINK TO TEXT hapter 3, Section 1, Exercise 037 Gender in the Rock and Roll Hall of Fame From its founding through 2012, the Rock and Roll Hall of Fame has inducted 303 groups or individuals. Forty-seven of the inductees have been female or have included female members.1 The full dataset is available in RockandRoll. Click here for the dataset associated with this question.
- 27. Click here to access StatKey. 1Rock and Roll Hall of Fame website: rockhall.com/inductees. (a) Give the correct notation for the proportion of inductees who have been performers? SHOW HINT LINK TO TEXT (b) What proportion of inductees have been female or have included female members? Round your answer to three decimal places.
- 28. Proportion= the absolute tolerance is +/-0.001 SHOW HINT LINK TO TEXT (c) If we took many samples of size 50 from the population of all inductees and recorded the proportion female or with female members for each sample, what shape do we expect the distribution of sample proportions to have? Where do we expect it to be centered? Round your answer for the center to three decimal places. Shape : Center : the absolute tolerance is +/-0.001 Click if you would like to Show Work for this question: Open Show Work
- 29. SHOW HINT LINK TO TEXT Question Attempts: 0 of 3 used SAVE FOR LATER SUBMIT ANSWER hapter 3, Section 2, Exercise 064 Number of Text Messages a Day A random sample of n=755 US cell phone users age 18 and older in May 2011 found that the average number of text
- 30. messages sent or received per day is 41.5 messages,1 with standard error about 6.1. 1Smith, A., "Americans and Text Messaging," Pew Research Center, http://www.pewinternet.org/Reports/2011/Cell-Phone- Texting-2011/Main-Report/How-Americans-Use-Text- Messaging.aspx, accessed September 19, 2011. (a) Use the information from the sample to give the best estimate of the population parameter. x¯= exact number, no tolerance SHOW HINT LINK TO TEXT
- 31. (b) Find a 95% confidence interval for the mean number of text messages. The 95% confidence interval is to . Click if you would like to Show Work for this question: Open Show Work SHOW HINT LINK TO TEXT Question Attempts: 0 of 3 used SAVE FOR LATER SUBMIT ANSWER