More Related Content
Similar to Table 7, mdg 7 ensure environmental sustainability (20)
More from Bread for the World (20)
Table 7, mdg 7 ensure environmental sustainability
- 1. Table 7
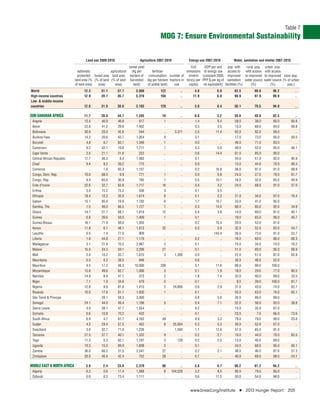
MDG 7: Ensure Environmental Sustainability
Land use 2009-2010 Agriculture 2007-2010 Energy use 2007-2010 Water, sanitation and shelter 2007-2010
cereal yield Co2 GDP per unit pop. with rural pop. urban pop.
nationally agricultural (kg per fertilizer emissions of energy use access to with access with access
protected forest area land area hectare of consumption number of (metric (constant 2005 improved to improved to improved slum pop.
land area (% (% of land (% of land harvested (kg per hectare tractors in ton(s) per PPP $ per kg of sanitation water source water source (% of urban
of land area) area) area) land) of arable land) use capita) oil equivalent) facilities (%) (%) (%) pop.)
World 12.3 31.1 37.7 3,568 122 .. 4.8 6.9 62.5 80.8 96.2 ..
High-income countries 12.9 28.7 36.7 5,319 104 .. 11.9 6.8 99.9 97.9 99.9 ..
Low- & middle-income
countries 12.0 31.9 38.0 3,103 129 .. 3.0 8.4 56.1 79.5 94.9 ..
SUB-SAHARAN AFRICA 11.7 28.0 44.7 1,335 10 .. 0.8 3.2 30.6 48.6 82.5 ..
Angola 12.4 46.9 46.8 617 1 .. 1.4 8.4 58.0 38.0 60.0 65.8
Benin 23.8 41.2 29.8 1,402 .. .. 0.5 3.5 13.0 68.0 84.0 69.8
Botswana 30.9 20.0 45.6 544 .. 3,371 2.5 11.4 62.0 92.0 99.0 ..
Burkina Faso 14.2 20.6 43.7 1,054 9 .. 0.1 .. 17.0 73.0 95.0 59.5
Burundi 4.8 6.7 83.7 1,346 1 .. 0.0 .. 46.0 71.0 83.0 ..
Cameroon 9.2 42.1 19.8 1,711 7 .. 0.3 5.6 49.0 52.0 95.0 46.1
Cape Verde 2.5 21.1 21.8 222 .. .. 0.6 14.4 61.0 85.0 90.0 ..
Central African Republic 17.7 36.3 8.4 1,465 .. .. 0.1 .. 34.0 51.0 92.0 95.9
Chad 9.4 9.2 39.2 775 .. .. 0.0 .. 13.0 44.0 70.0 89.3
Comoros .. 1.6 83.3 1,157 .. .. 0.2 16.8 36.0 97.0 91.0 68.9
Congo, Dem. Rep. 10.0 68.0 9.9 771 1 .. 0.0 0.8 24.0 27.0 79.0 61.7
Congo, Rep. 9.4 65.6 30.9 785 1 .. 0.5 10.1 18.0 32.0 95.0 49.9
Cote d’Ivoire 22.6 32.7 63.8 1,717 16 .. 0.4 3.2 24.0 68.0 91.0 57.0
Eritrea 5.0 15.2 75.2 536 3 .. 0.1 3.5 .. .. .. ..
Ethiopia 18.4 12.3 35.0 1,674 8 .. 0.1 2.2 21.0 34.0 97.0 76.4
Gabon 15.1 85.4 19.9 1,782 6 .. 1.7 10.7 33.0 41.0 95.0 ..
Gambia, The 1.5 48.0 66.5 1,127 7 .. 0.3 14.0 68.0 85.0 92.0 34.8
Ghana 14.7 21.7 68.1 1,814 12 .. 0.4 3.6 14.0 80.0 91.0 40.1
Guinea 6.8 26.6 58.0 1,409 1 .. 0.1 .. 18.0 65.0 90.0 45.7
Guinea-Bissau 16.1 71.9 58.0 1,555 .. .. 0.2 15.4 20.0 53.0 91.0 ..
Kenya 11.8 6.1 48.1 1,613 32 .. 0.3 3.0 32.0 52.0 82.0 54.7
Lesotho 0.5 1.4 77.0 909 .. .. .. 143.4 26.0 73.0 91.0 53.7
Liberia 1.8 44.9 27.1 1,179 .. .. 0.2 .. 18.0 60.0 88.0 68.3
Madagascar 3.1 21.6 70.2 2,987 3 .. 0.1 .. 15.0 34.0 74.0 76.2
Malawi 15.0 34.3 59.1 2,206 27 .. 0.1 .. 51.0 80.0 95.0 68.9
Mali 2.4 10.2 33.7 1,615 3 1,300 0.0 .. 22.0 51.0 87.0 65.9
Mauritania 0.5 0.2 38.5 946 .. .. 0.6 .. 26.0 48.0 52.0 ..
Mauritius 4.5 17.2 48.3 10,000 209 .. 3.1 11.6 89.0 99.0 100.0 ..
Mozambique 15.8 49.6 62.7 1,006 3 .. 0.1 1.9 18.0 29.0 77.0 80.5
Namibia 14.9 8.9 47.1 373 2 .. 1.8 7.4 32.0 90.0 99.0 33.5
Niger 7.1 1.0 34.6 479 0 .. 0.1 .. 9.0 39.0 100.0 81.7
Nigeria 12.8 9.9 81.8 1,413 2 24,800 0.6 2.9 31.0 43.0 74.0 62.7
Rwanda 10.0 17.6 81.1 1,930 1 .. 0.1 .. 55.0 63.0 76.0 65.1
São Tomé & Principe .. 28.1 58.3 3,000 .. .. 0.8 5.6 26.0 88.0 89.0 ..
Senegal 24.1 44.0 49.4 1,196 5 .. 0.4 7.1 52.0 56.0 93.0 38.8
Sierra Leone 4.9 38.1 47.7 1,554 .. .. 0.2 .. 13.0 35.0 87.0 ..
Somalia 0.6 10.8 70.2 432 .. .. 0.1 .. 23.0 7.0 66.0 73.6
South Africa 6.9 4.7 81.7 4,162 49 .. 8.9 3.2 79.0 79.0 99.0 23.0
Sudan 4.2 29.4 57.5 452 8 25,564 0.3 5.3 26.0 52.0 67.0 ..
Swaziland 3.0 32.7 71.0 1,226 .. 1,550 1.1 12.6 57.0 65.0 91.0 ..
Tanzania 27.5 37.7 40.1 1,332 9 .. 0.2 2.7 10.0 44.0 79.0 63.5
Togo 11.3 5.3 62.1 1,187 3 129 0.2 2.0 13.0 40.0 89.0 ..
Uganda 10.3 15.0 69.9 1,608 2 .. 0.1 .. 34.0 68.0 95.0 60.1
Zambia 36.0 66.5 31.5 2,547 27 .. 0.2 2.1 48.0 46.0 87.0 57.3
Zimbabwe 28.0 40.4 42.4 752 28 .. 0.7 .. 40.0 69.0 98.0 24.1
MIDDLE EAST & NORTH AFRICA 3.9 2.4 23.0 2,379 80 .. 3.8 4.7 88.2 81.2 94.2 ..
Algeria 6.3 0.6 17.4 1,568 8 104,529 3.2 6.5 95.0 79.0 85.0 ..
Djibouti 0.0 0.3 73.4 1,111 .. .. 0.6 11.5 50.0 54.0 99.0 ..
www.bread.org/institute I 2013 Hunger Report 205
- 2. Table 7
MDG 7: Ensure Environmental Sustainability
Land use 2009-2010 Agriculture 2007-2010 Energy use 2007-2010 Water, sanitation and shelter 2007-2010
cereal yield Co2 GDP per unit pop. with rural pop. urban pop.
nationally agricultural (kg per fertilizer emissions of energy use access to with access with access
protected forest area land area hectare of consumption number of (metric (constant 2005 improved to improved to improved slum pop.
land area (% (% of land (% of land harvested (kg per hectare tractors in ton(s) per PPP $ per kg of sanitation water source water source (% of urban
of land area) area) area) land) of arable land) use capita) oil equivalent) facilities (%) (%) (%) pop.)
CONTINUED: MIDDLE EAST & NORTH AFRICA
Egypt, Arab Rep. 5.9 0.1 3.7 6,541 503 103,188 2.7 5.9 95.0 99.0 100.0 13.1
Iran, Islamic Rep. 7.1 6.8 29.8 2,359 70 .. 7.4 3.5 100.0 92.0 97.0 ..
Iraq 0.1 1.9 20.1 1,687 37 .. 3.4 3.2 73.0 56.0 91.0 52.8
Jordan 1.9 1.1 11.5 1,963 2,444 .. 3.7 4.1 98.0 92.0 98.0 19.6
Lebanon 0.5 13.4 67.3 2,740 20 .. 4.1 7.5 .. 100.0 100.0 ..
Libya 0.1 0.1 8.8 662 40 .. 9.5 4.7 97.0 .. .. ..
Morocco 1.5 11.5 67.3 1,548 21 .. 1.5 8.8 70.0 61.0 98.0 13.1
Syrian Arab Republic 0.6 2.7 75.7 1,789 65 .. 3.6 4.2 95.0 86.0 93.0 22.5
Tunisia 1.3 6.5 63.0 1,702 42 40,438 2.4 9.5 .. .. 99.0 ..
West Bank & Gaza 0.6 1.5 61.0 1,163 .. .. 0.5 .. 92.0 81.0 86.0 ..
Yemen, Rep. 0.5 1.0 44.4 1,092 12 .. 1.0 7.0 53.0 47.0 72.0 76.8
SOUTH ASIA 5.9 17.1 54.6 2,691 176 .. 1.2 5.2 38.3 87.8 95.5 ..
Afghanistan 0.4 2.1 58.1 1,908 3 .. 0.0 .. 37.0 42.0 78.0 ..
Bangladesh 1.8 11.1 70.3 4,144 282 .. 0.3 7.0 56.0 80.0 85.0 61.6
Bhutan 28.3 84.6 13.2 2,177 32 .. 1.0 11.8 44.0 94.0 100.0 ..
India 5.0 23.0 60.5 2,537 168 .. 1.5 5.1 34.0 90.0 97.0 29.4
Maldives .. 3.3 26.7 2,000 98 .. 3.0 7.0 97.0 97.0 100.0 ..
Nepal 17.0 25.4 29.6 2,295 1 .. 0.1 3.1 31.0 88.0 93.0 58.1
Pakistan 10.1 2.2 34.1 2,592 217 .. 1.0 4.7 48.0 89.0 96.0 46.6
Sri Lanka 21.5 29.7 41.6 3,974 258 .. 0.6 9.5 92.0 90.0 99.0 ..
EAST ASIA & PACIFIC 15.0 29.6 48.5 4,925 .. .. 4.3 3.9 65.5 84.2 96.7 ..
Cambodia 25.8 57.2 31.5 3,108 7 .. 0.3 5.1 31.0 58.0 87.0 ..
China 16.6 22.2 56.2 5,521 488 .. 5.3 3.7 64.0 85.0 98.0 29.1
Fiji 1.3 55.5 22.9 2,598 23 5,983 1.5 6.9 83.0 95.0 100.0 ..
Indonesia 14.1 52.1 29.6 4,876 181 .. 1.7 4.3 54.0 74.0 92.0 23.0
Kiribati 23.2 14.8 42.0 .. .. .. 0.3 20.0 .. .. .. ..
Korea, Dem. Rep. 5.9 47.1 24.1 3,582 .. .. 3.2 .. 80.0 97.0 99.0 ..
Lao PDR 16.6 68.2 10.2 3,751 .. .. 0.3 .. 63.0 62.0 77.0 ..
Malaysia 18.1 62.3 24.0 3,800 770 .. 7.6 5.2 96.0 99.0 100.0 ..
Mongolia 13.4 7.0 74.5 1,370 8 .. 4.1 2.9 51.0 53.0 100.0 57.9
Myanmar 6.3 48.6 19.0 3,989 5 .. 0.3 5.0 76.0 78.0 93.0 ..
Papua New Guinea 3.1 63.4 2.5 3,839 120 .. 0.3 .. 45.0 33.0 87.0 ..
Philippines 10.9 25.7 40.1 3,232 140 .. 0.9 7.9 74.0 92.0 93.0 40.9
Samoa 3.4 60.4 23.7 .. 1 .. 0.9 12.9 98.0 96.0 96.0 ..
Solomon Islands 0.1 79.1 3.0 3,500 .. .. 0.4 18.0 .. .. .. ..
Thailand 20.1 37.1 38.7 2,938 125 .. 4.2 4.8 96.0 95.0 97.0 27.0
Timor-Leste 6.1 49.9 25.2 2,451 .. .. 0.2 11.8 47.0 60.0 91.0 ..
Tuvalu 0.4 33.3 33.3 .. .. 1 .. .. 85.0 97.0 98.0 ..
Vanuatu 4.3 36.1 15.3 554 .. .. 0.4 24.1 57.0 87.0 98.0 ..
Vietnam 6.2 44.5 33.1 5,161 402 .. 1.5 3.7 76.0 93.0 99.0 35.2
EUROPE & CENTRAL ASIA 7.5 38.6 27.8 2,239 39 .. 7.8 8.7 84.4 90.6 98.8 ..
Albania 9.8 28.3 43.9 4,762 46 7,438 1.3 13.8 94.0 94.0 96.0 ..
Armenia 8.0 9.2 61.6 2,074 29 .. 1.8 5.7 90.0 97.0 99.0 ..
Azerbaijan 7.1 11.3 57.6 2,019 14 .. 5.4 6.4 82.0 71.0 88.0 ..
Belarus 7.2 42.6 44.0 2,827 281 48,100 6.5 4.1 93.0 99.0 100.0 ..
Bosnia & Herzegovina 0.6 42.8 41.7 3,858 25 .. 8.3 4.6 95.0 98.0 100.0 ..
Bulgaria 9.2 36.2 46.3 3,665 167 53,100 6.6 4.9 100.0 100.0 100.0 ..
Georgia 3.7 39.5 36.1 1,271 43 .. 1.2 6.0 95.0 96.0 100.0 ..
Kazakhstan 2.5 1.2 77.2 804 2 .. 15.1 2.5 97.0 90.0 99.0 ..
b
Kosovo .. .. 52.4 .. .. .. .. .. .. .. .. ..
206 Table 7 – MDG 7: Ensure Environmental Sustainability I Bread for the World Institute
- 3. Table 7
MDG 7: Ensure Environmental Sustainability
Land use 2009-2010 Agriculture 2007-2010 Energy use 2007-2010 Water, sanitation and shelter 2007-2010
cereal yield Co2 GDP per unit pop. with rural pop. urban pop.
nationally agricultural (kg per fertilizer emissions of energy use access to with access with access
protected forest area land area hectare of consumption number of (metric (constant 2005 improved to improved to improved slum pop.
land area (% (% of land (% of land harvested (kg per hectare tractors in ton(s) per PPP $ per kg of sanitation water source water source (% of urban
of land area) area) area) land) of arable land) use capita) oil equivalent) facilities (%) (%) (%) pop.)
CONTINUED: EUROPE & CENTRAL ASIA
Kyrgyz Republic 6.9 5.0 55.4 2,604 21 .. 1.2 3.7 93.0 85.0 99.0 ..
Latvia 18.0 53.9 29.5 2,667 65 59,562 3.3 6.9 .. 96.0 100.0 ..
Lithuania 14.5 34.5 42.9 2,667 45 117,580 4.5 6.0 .. .. 98.0 ..
Macedonia, FYR 4.9 39.6 40.2 3,329 57 53,606 5.8 6.7 88.0 99.0 100.0 ..
Moldova 1.4 11.7 75.2 2,696 9 35,984 1.3 3.8 85.0 93.0 99.0 ..
Montenegro 13.3 40.4 38.2 3,494 .. .. 3.1 7.1 90.0 96.0 99.0 ..
Romania 7.1 28.6 58.8 3,331 48 176,841 4.4 6.7 .. .. 99.0 ..
Russian Federation 9.1 49.4 13.2 1,844 16 329,980 12.0 3.0 70.0 92.0 99.0 ..
Serbia 6.0 31.0 57.8 4,959 134 5,844 6.8 4.8 92.0 98.0 99.0 ..
Tajikistan 4.1 2.9 33.9 2,721 47 .. 0.5 5.5 94.0 54.0 92.0 ..
Turkey 1.9 14.7 50.6 2,727 96 .. 4.0 8.7 90.0 99.0 100.0 13.0
Turkmenistan 3.0 8.8 69.4 3,289 .. .. 9.7 1.7 98.0 .. 97.0 ..
Ukraine 3.5 16.8 71.2 2,727 30 333,529 7.0 2.3 94.0 98.0 98.0 ..
Uzbekistan 2.3 7.7 62.6 4,516 193 .. 4.6 1.5 100.0 81.0 98.0 ..
LATIN AMERICA & CARIBBEAN 20.2 47.0 35.8 3,919 92 .. 2.8 8.2 78.7 80.9 97.9 ..
Argentina 5.5 10.7 51.3 4,937 25 .. 4.8 7.2 .. .. 98.0 20.8
Belize 27.9 61.1 6.7 3,252 130 .. 1.3 10.9 90.0 99.0 98.0 18.7
Bolivia 18.5 52.8 34.1 2,333 6 .. 1.3 6.7 27.0 71.0 96.0 47.3
Brazil 26.3 61.4 31.3 4,055 125 .. 2.1 7.6 79.0 85.0 100.0 26.9
Chile 16.6 21.8 21.2 6,822 596 53,915 4.4 7.4 96.0 75.0 99.0 ..
Colombia 20.9 54.5 38.3 3,895 497 .. 1.5 11.9 77.0 72.0 99.0 14.3
Costa Rica 20.9 51.0 35.3 3,730 827 .. 1.8 9.5 95.0 91.0 100.0 ..
Cuba 6.4 27.0 62.5 1,940 14 72,602 2.8 .. 91.0 89.0 96.0 ..
Dominican Republic 22.2 40.8 51.1 4,234 27 .. 2.2 9.5 83.0 84.0 87.0 14.8
Ecuador 25.1 39.7 30.3 3,117 187 .. 1.9 8.9 92.0 89.0 96.0 ..
El Salvador 0.8 13.9 74.5 2,806 107 .. 1.0 7.2 87.0 76.0 94.0 ..
Guatemala 30.6 34.1 41.0 2,299 107 .. 0.9 6.1 78.0 87.0 98.0 38.7
Guyana 5.0 77.2 8.5 2,471 20 .. 2.0 4.3 84.0 93.0 98.0 33.2
Haiti 0.3 3.7 66.8 980 .. .. 0.3 4.0 17.0 51.0 85.0 70.1
Honduras 18.2 46.4 28.5 1,094 62 .. 1.2 5.9 77.0 79.0 95.0 ..
Jamaica 18.9 31.1 41.5 1,172 58 .. 4.5 5.7 80.0 88.0 98.0 ..
Mexico 11.1 33.3 52.9 3,499 52 238,830 4.3 8.3 85.0 91.0 97.0 14.4
Nicaragua 36.7 25.9 42.8 2,086 22 .. 0.8 4.6 52.0 68.0 98.0 45.5
Panama 18.7 43.7 30.0 2,131 47 .. 2.0 13.2 .. .. 97.0 ..
Paraguay 5.4 44.3 52.6 3,457 66 25,823 0.7 5.5 71.0 66.0 99.0 ..
Peru 13.6 53.1 16.8 3,899 105 .. 1.4 14.4 71.0 65.0 91.0 36.1
Suriname 11.6 94.6 0.5 4,232 65 1,013 4.7 4.7 83.0 81.0 97.0 ..
Uruguay 0.3 10.0 84.6 4,251 131 36,465 2.5 9.6 100.0 100.0 100.0 ..
Venezuela, RB 53.8 52.5 24.3 4,038 200 .. 6.1 4.8 .. .. .. ..
.. Data not availble.
0 Zero, or rounds to zero at the displayed number of decimal places.
a Data refers to 2006
b Data refers to 2007
c Data refers to 2008
d Data refers to 2009
e Data refers to 2010
f Data refers to 2011
Note: South Sudan is not included due to insufficient information.
Sources for tables on page 215.
www.bread.org/institute I 2013 Hunger Report 207