More Related Content
Similar to Adolescent brain 2 (20)
Adolescent brain 2
- 1. In vivo evidence for
post-adolescent brain
maturation in frontal and
striatal regions
Elizabeth R. Sowell1, Paul M. Thompson1, Colin J.
Holmes1, Terry L. Jernigan2 and Arthur W. Toga1
1 Laboratory of Neuro Imaging, Department of Neurology, University of
California, Los Angeles, 710 Westwood Plaza, Room 4-238, Los Angeles,
California 90095-1769, USA
2 Department of Veterans Affairs Medical Center and Departments of
Psychiatry and Radiology, University of California, San Diego, School of
Medicine, La Jolla, California 90095, USA
Correspondence should be addressed to E.R.S. (esowell@loni.ucla.edu)
We spatially and temporally mapped brain maturation between
adolescence and young adulthood using a whole-brain, voxel-
by-voxel statistical analysis of high-resolution structural mag-
netic resonance images (MRI). The
pattern of brain maturation during
these years was distinct from earlier
development, and was localized to
large regions of dorsal, medial and
orbital frontal cortex and lenticular
nuclei, with relatively little change in
any other location. This spatial and
temporal pattern agrees with conver-
gent findings from post-mortem stud-
ies of brain development and the
continued development over this age
range of cognitive functions attributed
to frontal structures.
A thorough understanding of
human brain development from birth
through adolescence to adulthood is
essential to our understanding cogni-
tive development, yet relatively little is
known about normal brain matura-
tion. Post-mortem studies show that
myelination, a cellular maturational
event, begins near the end of the sec-
ond trimester of fetal development and
extends well into the third decade of
life and beyond1,2. Such autopsy studies
reveal a temporally and spatially sys-
tematic sequence of myelination, pro-
gressing from inferior to superior and
from posterior to anterior; that is,
brain stem and cerebellar regions
myelinate before cerebral hemispheres,
and frontal lobes myelinate last1. This
process may reflect regional patterns of
functional maturation. Unfortunately,
post-mortem studies typically include
low numbers of subjects in childhood,
adolescence and young adulthood
because few specimens are available,
and their interpretations are compli-
cated by concomitant disease.
In an earlier study using MRI and a voxel-by-voxel image
analysis technique (voxel-based morphometry of whole-brain
gray matter)3, we found that cortical changes between childhood
and adolescence were confined to dorsal brain regions and were
most prominent in the parietal lobes. Findings from an earlier
volumetric study prompted us to try these methods4. These
results were complemented by another study assessing white mat-
ter change5 and generally agreed with expectations based on post-
mortem studies of cellular brain maturation. The relative
prominence of changes in the parietal cortex as compared with
frontal cortex, however, was surprising given the known poste-
rior–anterior progression of maturational cellular events. We had
expected brain image analysis to reflect considerable frontal mat-
uration by age 16.
Here we assessed postadolescent brain maturation by study-
ing a group of normal, young adults, 23–30 years of age, as well
as 12–16-year-olds studied previously3. We anticipated that the
pattern of brain maturation between adolescence and adulthood
would differ from that observed between childhood and ado-
lescence. Specifically, we anticipated more maturational changes
in the frontal lobes than in other cortical regions because, in
addition to the post-mortem findings of delayed frontal matu-
ration, converging evidence from elec-
trophysiological6 and cerebral
glucose-metabolism7 studies reveals
relatively late frontal maturation.
Additionally, neuropsychological stud-
ies of normal development show that
performance on tasks involving the
frontal lobes continues to improve
into adolescence8. Despite abundant
empirical evidence for postadolescent
frontal lobe development, the spatial
and temporal progression of matura-
tion into the frontal lobes has yet to
be shown in vivo.
Adolescents (age range, 12–16;
mean 13.8 ± 1.6 years; n = 10, 5 male),
and young adults (23 to 30 years; mean
age, 25.6 ± 2.0 years; n = 10, 5 male)
were studied. Adolescents had been
recruited as normal controls for a neu-
rodevelopmental research center and
the young adults as controls for neu-
ropsychiatric studies of adult patients.
Subjects were all right handed and
were thoroughly screened for medical,
neurological and psychiatric disorders.
Informed consent was obtained from
all subjects and/or their parents.
High-resolution MRI brain images
were acquired for each subject in the
same magnet. We used an imaging
protocol with a gradient-echo (SPGR)
T1-weighted series with TR = 24 ms,
TE = 5 ms, NEX = 2, flip angle = 45°, a
field of view of 24 cm and section
thickness of 1.2 mm, with no gaps.
Previously detailed image-analysis
methods3 are briefly summarized here.
First-image volumes were resliced into
a standard orientation, making it eas-
ier to define cerebral and non-cerebral
scientific correspondence
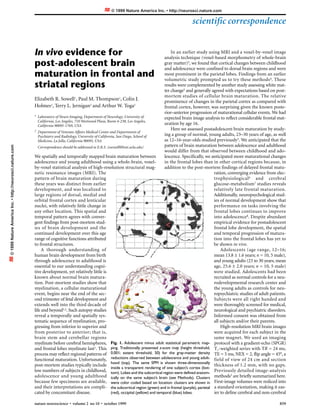
nature neuroscience • volume 2 no 10 • october 1999 859
Fig. 1. Adolescent minus adult statistical parametric map-
ping. Traditionally presented z-score map (height threshold,
0.001; extent threshold, 50) for the gray-matter density
reductions observed between adolescence and young adult-
hood (top). The same SPM is shown three-dimensionally
inside a transparent rendering of one subject’s cortex (bot-
tom). Lobes and the subcortical region were defined anatom-
ically on the same subject’s brain (see Methods). Clusters
were color coded based on location: clusters are shown in
the subcortical region (green) and in frontal (purple), parietal
(red), occipital (yellow) and temporal (blue) lobes.
© 1999 Nature America Inc. • http://neurosci.nature.com©1999NatureAmericaInc.•http://neurosci.nature.com
- 2. regions. Three-dimensional digital filtering was applied to each
volume to reduce signal-value variability due to radio-frequency
inhomogeneity artifacts. Each image set was subjected to semi-
automated tissue segmentation to classify voxels as gray matter,
white matter or cerebrospinal fluid (CSF) based on signal value.
Nonbrain tissue and cerebellar structures were subtracted from
each image. For statistical parametric mapping (SPM) analyses,
each subject’s brain volume was scaled into a standard space using
an automated 12-parameter linear transformation9.
For importation into SPM96 software10, the
skull-stripped, tissue-segmented supratentori-
al image sets were binarized to include only
gray-matter voxels. Binary gray-matter volumes
were then smoothed with an 8-mm FWHM
isotropic Gaussian kernel to create a spectrum
of intensities that represented gray-matter ‘den-
sity’. However, note that here ‘density’ refers not
to cell packing, but to the amount of gray mat-
ter labeled by the segmentation procedure per
unit volume. Cell packing or specific laminar
changes either could not be measured by MRI
or were lost during tissue classification.
Statistical analyses were conducted with
SPM96. We used a simple voxel-by-voxel con-
trast to compare the average gray-matter map
for adolescents to that for young adults, focus-
ing on the negative effects of age on gray-mat-
ter. We tested for regional differences in the
location of voxels that segmented as gray mat-
ter in adolescents and either white matter or
CSF in young adults (presumably representa-
tive of increasing myelination). Voxels that were
different between groups (p < 0.001) and clus-
tered in groups of 50 or more voxels were con-
sidered significant. To correct for multiple
statistical comparisons, an initial significance
level was assigned to the SPM by modeling the
residuals as isotropic stationary Gaussian fields
with homogeneous smoothness across the brain
volume. We also applied a nonparametric sta-
tistical approach, in case theoretical assump-
tions were violated in our sample11. Here
adolescents and adults were randomly assigned
to groups for 20 additional SPM analyses. All
results were significant at the p < 0.05 level
under both nondistributional and stationary
random-process statistical models.
To test the hypothesis that differences
between adolescents and adults are greater in
860 nature neuroscience • volume 2 no 10 • october 1999
frontal regions, several brain regions (frontal, temporal, parietal
and occipital lobes and a subcortical region) were manually
defined on one image set, aided by a brain-surface rendering in
which central and lateral sulci could be easily identified; where
available, cortical gyri were used to separate lobar regions. Sig-
nificance for each lobe and the subcortical region was assessed
by counting the number of significant voxels per unit volume in
each region of the SPM and comparing this distribution to the
null hypothesis (that all regions would be uniform) using a chi-
squared test.
The SPM of differences between adolescents and adults
observed here (Fig. 1) contrasted with the SPM of differences
between childhood and adolescence3. Specifically, parietal, tem-
poral and occipital lobes showed little maturational change; as
predicted, dorsal, medial and lateral regions of the frontal lobes
showed large group differences. A large cluster was also seen in
the subcortical region. Significant changes were observed in
0.014% of frontal lobes, 0.002% of parietal lobes, 0.007% of tem-
poral lobes, 0.005% of occipital lobes and 0.076% of the subcor-
tical region. A chi-squared test confirmed that these results were
statistically significant (χ2 = 180, p < 0.001). Table 1 contains
Talairach coordinates of the most significant voxels in the five
largest clusters. Significant group differences were mapped onto
an averaged brain (Fig. 2). In permutation tests
used to assess the overall significance of the SPM,
the mean number of significant clusters for the
20 randomized tests was 7.4 (range, 0–16), com-
pared with 44 significant clusters in the omnibus
group test (p < 0.05; permutation test).
In regions of frontal cortex, we observed
reduction in gray matter between adolescence
and adulthood, probably reflecting increased
myelination in peripheral regions of the cortex
that may improve cognitive processing in adult-
hood. This was predicted by post-mortem1,2,
electrophysiological6, positron-emission tomog-
raphy7 and neuropsychological8 studies of nor-
mal cognitive and neurological development.
Neuropsychological studies show that the frontal
lobes are essential for such functions as response
inhibition, emotional regulation, planning and
organization12. Many of these aptitudes contin-
ue to develop between adolescence and young
adulthood. On the other hand, the parietal asso-
ciation cortices are involved in spatial relations
and sensory functions, and the lateral temporal
lobes are involved in auditory and language pro-
cessing, aspects of cognitive development that
are largely mature by adolescence13. Thus,
observed regional patterns of static versus plas-
tic maturational changes between adolescence
and adulthood are consistent with cognitive
development.
The striatal changes observed, primarily in
the putamen and globus pallidus, probably result
from some combination of regressive events,
myelination and iron deposition14. Their func-
tional significance in the postadolescent brain
may seem somewhat more difficult to assess than
that of frontal lobe changes, given that striatal
structures are involved in motor function that is
likely fully developed by late adolescence. How-
ever, striatal motor functions are mediated by
scientific correspondence
Fig. 2. Voxels showing significant
changes in gray matter between ado-
lescents and adults, mapped onto an
averaged brain. Note the clear stri-
atal and more prominent frontal
reductions in gray-matter density.
Red shades correspond to the high-
est z-statistic values and green to the
lowest.
Table 1.Voxel coordinates in Talairach space and
associated z scores for the most significant voxels in the
five largest clusters in the adolescent-minus-adult SPM.
Cluster size Talairach coordinates z score
(mm3) x y z (mm)
9271 40 –9 15 5.11
5774 –11 2 –7 5.82
2470 –19 50 40 4.65
1047 22 10 64 4.24
1325 –32 –52 –15 3.92
© 1999 Nature America Inc. • http://neurosci.nature.com©1999NatureAmericaInc.•http://neurosci.nature.com
- 3. nature neuroscience • volume 2 no 10 • october 1999 861
Brain development
during childhood and
adolescence: a
longitudinal MRI study
Jay N. Giedd1, Jonathan Blumenthal1, Neal O. Jeffries2,
F. X. Castellanos1, Hong Liu1, Alex Zijdenbos3,
Tomás˘ Paus3, Alan C. Evans3 and Judith L. Rapoport1
1 Child Psychiatry Branch, National Institute of Mental Health, Building 10,
Room 4C110, 10 Center Drive, MSC 1367, Bethesda, Maryland 20892, USA
2 Biometry Branch, National Institute of Neurological Disease and Stroke, Federal
Building, Room 7C06, 7550 Wisconsin Avenue, Bethesda, Maryland, 20892, USA
3 Montreal Neurological Institute, McGill University, 3801 University Street,
Montreal, Quebec H3A 2B4, Canada
Correspondence should be addressed to J.N.G. (jgiedd@helix.nih.gov)
Pediatric neuroimaging studies1–5, up to now exclusively cross sec-
tional, identify linear decreases in cortical gray matter and increas-
es in white matter across ages 4 to 20. In this large-scale
longitudinal pediatric neuroimaging study, we confirmed linear
increases in white matter, but demonstrated nonlinear changes in
cortical gray matter, with a preadolescent increase followed by a
postadolescent decrease. These changes in cortical gray matter
were regionally specific, with developmental curves for the frontal
and parietal lobe peaking at about age 12 and for the temporal
lobe at about age 16, whereas cortical gray matter continued to
increase in the occipital lobe through age 20.
The subjects for this study were healthy boys and girls partici-
pating in an ongoing longitudinal pediatric brain-MRI project at
the Child Psychiatry Branch at the National Institute of Mental
Health. Subjects were recruited from the community as previous-
ly described, using phone screening, questionnaires mailed to par-
ents and teachers and face-to-face physical and psychological
testing; approximately one in six volunteers were accepted5. At least
1 scan was obtained from each of 145 healthy subjects (89 male). Of
these, 65 had at least 2 scans, 30 had at least 3 scans, 2 had at least
4 scans and 1 had 5 scans, acquired at approximately two-year
intervals. The age range was from 4.2 to 21.6 years. There were no
significant sex differences for age, Tanner stage, ethnicity, socioe-
conomic status, height, weight or handedness.
All subjects were scanned on the same GE 1.5 Tesla Signa scan-
ner using the same three-dimensional, spoiled-gradient, recalled
echo in the steady state (3D SPGR) imaging protocol, with an
axial-slice thickness of 1.5 mm, a time-to-echo of 5 ms, a repeti-
tion time of 24 ms, flip angle of 45°, a 192 ( 256 acquisition matrix,
1 excitation and a field of view of 24 cm. A clinical neuroradiolo-
gist evaluated all scans; no gross abnormalities were reported.
Volumes of white and cortical gray matter were quantitative-
ly analyzed by combining a technique using an artificial neural
network to classify tissues based on voxel intensity with non-lin-
ear registration to a template brain for which these tissue regions
had been manually defined7. This technique supplemented MRI
signal-intensity information with predetermined brain anatomy
and provides lobar (frontal, parietal, temporal and occipital) par-
cellation of cortical gray- and white-matter volumes.
We used previously described statistical analysis techniques
that combine cross-sectional and longitudinal data8. These lon-
gitudinal methods are more sensitive to detecting individual
growth patterns, even in the presence of large interindividual
variation9. We assessed if there was significant change with age, if
developmental curves differed by sex and/or region and whether
the developmental curves were linear or quadratic.
The volume of white matter increased linearly with age
(Fig. 1; Table 1), increasing less in females than in males. The net
increase across ages 4 to 22 was 12.4%. Curves for white-matter
development did not significantly differ among various lobes. In
contrast, changes in volume of cortical gray matter were non-
linear and regionally specific. Gray matter in the frontal lobe
increased during pre-adolescence with a maximum size occur-
ring at 12.1 years for males and 11.0 years for females, followed by
a decline during post-adolescence that resulted in a net decrease
in volume across this age span. Parietal-lobe gray matter followed
a similar pattern, increasing during pre-adolescence to a maxi-
mum size at age 11.8 years for males and 10.2 years for females,
followed by decline during postadolescence and a net decrease
scientific correspondence
RECEIVED 17 MAY; ACCEPTED 12 AUGUST 1999
1. Yakovlev, P. I. & Lecours, A. R. in Regional Development of the Brain in Early
Life (ed. Minkowski, A.) 3–70 (Blackwell Scientific, Oxford, 1967)
2. Benes, F. M., Turtle, M., Khan, Y. & Farol, P. Arch. Gen. Psychiatry 51, 477–484
(1994).
3. Sowell, E. R. et al. Neuroimage 9, 587–597 (1999).
4. Jernigan, T. L., Trauner, D. A., Hesselink, J. R. & Tallal, P. A. Brain 114,
2037–2049 (1991).
5. Paus, T. et al. Science 283, 1908–1911 (1999).
6. Hudspeth, W. J. & Pribram, K. H. Int. J. Psychophysiol. 21, 19–29 (1990).
7. Chugani, H. T., Phelps, M. E. & Mazziotta, J. C. Ann. Neurol. 22, 487–497
(1987).
8. Levin, H. S. et al. Dev. Neuropsychol. 7, 377–395 (1991).
9. Woods, R. P., Grafton, S. T., Holmes, C. J., Cherry, S. R. & Mazziotta, J. C.
J. Comput. Assist. Tomogr. 22, 139–152 (1998).
10. Friston, K. J. et al. Hum. Brain Mapp. 2, 189–210 (1995).
11. Worsley, K. J. et al. Hum. Brain Mapp. 8 (in press).
12. Fuster, J. M. The Prefrontal Cortex: Anatomy, Physiology, and Neuropsychology
of the Frontal Lobe, 2nd edn (Raven, New York, 1989).
13. Cohen, M. J., Branch, W. B., Willis, W. G., Yeyandt, L. L. & Hynd, G. W. in
Handbook of Neuropsychological Assessment: A Biopsychosocial Perspective
(eds. Puente, A. E. & McCaffrey, R. J.) 49–79 (Plenum, New York, 1992).
14. Connor, J. R. & Menzies, S. L. Glia 17, 83–93 (1996).
15. Rolls, E. T. Rev. Neurol. (Paris) 150, 648–660 (1994).
the frontal cortex15. Striatal structures are involved in cognitive
functions such as learning, which is linked to frontal system func-
tion15 and improves throughout adolescence8. This suggests tem-
poral and functional relationships between simultaneous
postadolescent reductions in gray-matter density in frontal and
striatal regions.
Thus, we describe in-vivo documentation for a temporal and
spatial progression of postadolescent maturation into the frontal
lobes, highlighting the potential importance of frontal/striatal
maturation to adult cognition.
ACKNOWLEDGEMENTS
We thank the McConnell Brain Imaging Center at the Montreal Neurological
Institute and the SPM software developers at the Wellcome Department of Cognitive
Neurology. Finally, we thank David Kornsand for assistance in anatomical analyses
and John Bacheller for artwork. This study was supported by grants P50 NS22343,
and R01 HD 23854, and NIMH NRSA grant 5T32 MH16381, NSF DBI 9601356,
the NCRR (P41 RR13642), NINDS (NS38753) and the pediatric supplement of the
Human Brain Project, funded jointly by NIMH and NIDA (P20 MH/DA52176).
© 1999 Nature America Inc. • http://neurosci.nature.com©1999NatureAmericaInc.•http://neurosci.nature.com