Binocular balance in_normal_vision_and_its.9
•
2 likes•517 views

Terapias visuales para todas las edades

Recommended
Recommended
More Related Content
What's hot
What's hot (16)
Viewers also liked
Viewers also liked (16)
Similar to Binocular balance in_normal_vision_and_its.9
Similar to Binocular balance in_normal_vision_and_its.9 (20)
More from Yesenia Castillo Salinas
More from Yesenia Castillo Salinas (20)
Recently uploaded
Recently uploaded (20)
Binocular balance in_normal_vision_and_its.9
- 1. ORIGINAL ARTICLE Binocular Balance in Normal Vision and Its Modulation by Mean Luminance Peng Zhang*, William Bobier† , Benjamin Thompson‡ , and Robert F. Hess‡ ABSTRACT Purpose. To better understand the neural basis of sensory dominance in the normal population, we applied a recently established test designed to quantify the degree of suppression in amblyopia to participants with normal binocular vision. Methods. This test quantifies the degree of dichoptic imbalance in coherent motion sensitivity by manipulating the contrast of stimuli seen by the two eyes. The contrast at which balanced dichoptic motion sensitivity occurs is referred to as the “balance point” and is an estimate of the degree of suppression. We apply the same logic to the measurement of sensory dominance by measuring the distribution of “balance points” within the normal population. Results. We show that although most subjects are balanced or only weakly imbalanced, a minority is strongly imbalanced. To ascertain the site of sensory dominance, we assessed the degree to which normal sensory balance can be modulated by changing the interocular mean luminance. We found that mismatches in mean luminance between the two eyes had a pronounced effect on the balance point determination. Conclusions. Because cells in the lateral geniculate nucleus exhibit a strong modulation to sustained changes in the mean light level, this may suggests that the inhibitory circuits underlying sensory eye dominance are located at a precortical site. (Optom Vis Sci 2011;88:1072–1079) Key Words: eye dominance, binocular balance, mean luminance T he current model of binocular vision involves inhibitory as well as excitatory connections.1 Although the excitatory combina- tion of the signals from the two eyes is well known and thought to occur in the early layers of the striate cortex,2 the inhibitory influ- ences have only recently been appreciated by psychophysicists.3 There is, however, a long history of inhibitory binocular interactions in the neurophysiological literature, especially in the lateral geniculate nu- cleus (LGN)4–6 and cortex.7 For a balanced binocular system, that is one that does not exhibit a sensory ocular dominance both the excit- atory and inhibitory interocular influences are in balance. Any imbal- ance will produce a sensory dominance that has potential clinical implications.8 For example, the management of monovision associ- ated with contact lenses, refractive, and cataract surgery benefits greatly from a knowledge of sensory dominance,9–12 something that we presently do not assess in the clinic. Motor dominance, which is measured clinically has been shown to be uncorrelated with sensory dominance.13 There is a need for an accurate assessment of sensory dominance in the clinic. Suppression associated with amblyopia is the end result of a fully imbalanced binocular system. In this case, there is an attenuation of the monocular signal, and a resultant strong suppressive influence from the fixing eye’s input on that of the amblyopic eye. Mansouri et al.14 proposed a method by which the degree of imbalance in these signals could be measured psychophysically. They used a global mo- tion stimulus in which signal elements moving in a coherent direction were presented to one eye and noise elements moving in a random direction were presented to the other eye. Performance was quantified by the signal/noise ratio associated with correct identification of the signal elements’ direction. Binocular combination was quanti- fied by the extent to which the threshold varied depending on which eye saw the signal and which eye saw the noise. By manip- ulating the interocular contrast, balanced performance (where it did not matter which eye saw the signal and which saw the noise) on this motion task could be restored, suggesting that under the right conditions (appropriate interocular contrast), the two eyes can work together. They proposed that the contrast ratio deter- mined in this way would be a good measure of the degree of imbalance before excitatory summation and advocated its use in cases of amblyopia to quantify the degree of suppression. *BSc † PhD, FAAO ‡ PhD School of Optometry, University of Waterloo, Ontario, Canada (PZ, WB), Department of Optometry and Vision Science, University of Auckland, New Zea- land (BT), and the Department of Ophthalmology, McGill University, Quebec, Canada (RFH). 1040-5488/11/8809-1072/0 VOL. 88, NO. 9, PP. 1072–1079 OPTOMETRY AND VISION SCIENCE Copyright © 2011 American Academy of Optometry Optometry and Vision Science, Vol. 88, No. 9, September 2011
- 2. If one views suppression in amblyopes as an extreme version of normal sensory dominance, then a similar approach could be taken to quantify the degree of sensory dominance in normals. Li et al.,8 ap- plied an abbreviated version of this same approach in a group of normal observers to better understand ocular dominance. Li et al.8 proposed that the degree to which the aforementioned inhibitory in- teractions are balanced provides an explanation for and a means of measuring sensory dominance. They measured the degree of sensitiv- ity imbalance for stimuli of equal contrast (i.e., the extent to which it matters which eye sees the noise and which eye sees the signal) and found that this was well correlated with the extent to which an observer’s performance was constant across a range of clinical eye dominance measures. Those with a small sensitivity imbalance exhib- ited variability across a range of clinical eye dominance tests, whereas those with a stronger imbalance showed a greater consistency across clinical tests. They also reported that the normal population is com- posed of two dominance groups, one with mild dominance (the ma- jority) and one with strong dominance. The previous application of this approach to the investigation of eye dominance in the normal population involved the use of stim- uli of only one contrast level (i.e., a high contrast) that was the same in both eyes. This was done to make the measurements convenient and practical in a clinical setting. However, because this previous study did not measure the interocular contrast at which balanced dichoptic performance was obtained in the normal visual system (as originally suggested by Mansouri et al.14 ), it relies on the as- sumption that there is a linear relationship between the extent of the initial dichoptic sensitivity imbalance (dichoptic sensitivity ra- tio for stimuli of equal high contrast) and the interocular contrast ratio required to balance dichoptic performance. In this study, we set out with two aims. The first was to test this assumption by quantifying dominance within the normal population intermsofmeasurementsofafullrangeofinterocularcontrastssothat the interocular contrast corresponding to balanced dichoptic perfor- mance (term the balance point) could be obtained. The second was to assess whether balanced performance is susceptible to changes in the luminance as well as the contrast between the eyes. The reason why it is of interest to investigate whether a change in the interocular luminance alters the balance point measured with our contrast-varying paradigm is because luminance effects gen- erally occur at precortical levels and this would then bear on the possible site of this balancing operation. For example, cells in the LGN do respond to changes in the mean light level as well as the contrast15 and even though the input from each eye is kept separate in the laminar structure of the LGN, inhibitory interocular interactions have been reported between cells from different lamina.4,5,16 –18 The balance between these subcortical signals may underlie sensory dominance. METHODS Subjects Twenty-five naive observers ages ranged from 19 to 36 years, recruited from the School of Optometry, University of Water- loo were included in the study. Informed consent was obtained before the tests, and the study was approved by the Office of Research Ethics (ORE 15,721) of University of Waterloo. Before the tasks, each subject underwent a series of clinical tests to ensure that the inclusion criteria were met. These included normal vision with 20/20 or better after a subjective refraction; the absence of any binocular deficits (i.e., amblyopia, strabismus); no oculomotor abnormalities such as strabismus; no ocular surgery history; and stereoacuity of Ͻ50 s of arc. Exclusion criteria in- cluded any history of a binocular vision disorder involving a con- stant or intermittent tropia. Unilateral and alternate cover tests were performed on the ob- servers to ensure the absence of strabismus, and the Modified- Thorington-test was used to measure their phoria level. Visual acuity was assessed with computerized Test Chart 2000 Pro on logarithm of the minimum angle of resolution scale; and stereoa- cuity was measured with Randot Stereo graded circle test. Eye Dominance Assessment Before the observers started the motion coherence tasks, their motor ocular dominance was assessed. Four tests were performed in this study to determine motor dominance. The Hole-in-Card Test (The Dolman Method) Observers were instructed to hold a card with both hands about 40 cm from their eyes, and align a target at 6 m through the hole in the card with both eyes open. The experimenter then determined dominance by asking participants to alternatively close each eye to determine which eye was aligned with the target. The Hole-in-Cone Test (A Modification of Dolman Method) A cone was made out of a sheet of A4 size paper and observers were asked to hold it with both hands with the base of the cone in front of their eyes. Through the hole at the cone’s apex, the ob- servers aligned a 6 m distant target with both eyes open. The experimenter then determined the dominance by asking observers to alternatively close each eye to determine which eye was aligned with the target. The Point-a-Finger Test (The Porta Test) Observers were instructed to extend both arms and put one thumb over the other. They were then asked to align their thumbs to a 6 m distant target with both eyes both. Dominance was determined by alternatively closing each eye to determine the sighting eye. The Worth-4-Dot Test A standard Worth-4-dot test was performed at near (0.4 m) and far distances (6 m). The observers wore anaglyphic glasses and were presented with four dots from a flashlight to measure their sup- pression. Each of the clinical dominance tests provides only a crude binary estimate of dominance. Each test was done twice and in all cases, there was agreement between the two measures. Modulation of Binocular Balance in Normal Vision—Zhang et al. 1073 Optometry and Vision Science, Vol. 88, No. 9, September 2011
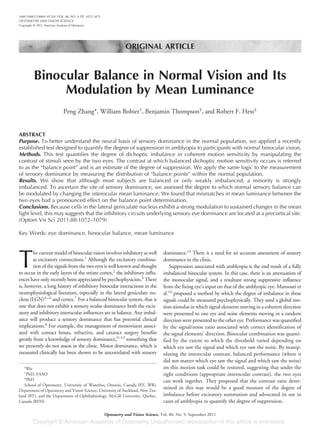
- 3. Dichoptic Motion Thresholds Apparatus Stimuli were presented using a MacBook Pro laptop computer running Matlab (Mathworks, Natick, MA) and Psychophysics Toolbox, Version 3.19 The stimuli were displayed using a Z800 duel pro headmounted display (eMagin Corporation, Hopewell Junction, NY). This headmounted display model contains two OLED screens, one for each eye. The screens have a high lumi- nance, a linear luminance response profile and refresh simultane- ously at 60 Hz therefore avoiding motion smear. The device also allows for different stimuli to be presented to each eye. To achieve this, each frame of the dichoptic stimulus was computed as a single image with a resolution of 600 ϫ 1600 pixels. A Matrox DuelaHead2Go external video board was then used to split each frame between the two headmounted display screens at a resolu- tion of 600 ϫ 800 pixels per screen. A photometer (United De- tector Technology) was used to ensure equal luminance of the two screens and to perform gamma correction. Stimuli and Task Stimuli were random dot kinematograms based on those used by Mansouri et al.14 (Fig. 1). One hundred dots [with dot lumi- nance modulation varied according to ͫ(Ldots Ϫ Lbackground) (Ldots ϩ Lbackground)ͬwere displayed on a mean luminance background of 50 cd/m2 . Each dot had a radius of 0.5° and moved at 6°/s. The dots had a limited lifetime whereby on any single frame, each dot had a 5% chance of disappearing and being redrawn in a new spatial position. Dots were presented within a circular display aperture with a radius of 11.1° that was framed by a solid black square outline to aid fusion. To avoid interaction of the stimulus dots with the central dark fixation dot (radius 0.35°), stimulus dots did not enter the central region of the display aperture (radius 2°). Dots that passed through this central region disappeared and were redrawn on the opposite side of the central area with the appropriate temporal delay to maintain a constant speed. When stimulus dots reached the edge of the display aperture, they were wrapped around. Stimuli were shown for 1 s. In each trial, one eye was presented with a population of “signal” dots that all moved in the same direction (left or right). The other eye was presented with the noise dots that moved in random di- rections. The task was to indicate the motion direction of the signal dots. The total number of dots were fixed (i.e., 100) and the ratio of the signal dotsگnoise dots was varied with our psychophysical procedure. To measure the threshold number of signal dots re- quired for 79% correct performance (the motion coherence threshold), the number of signal dots was varied on a trial-by-trial basis using a 3-down 1-up staircase procedure with a proportional step size of 50% before the first reversal and 25% thereafter. The starting point for each staircase was 100 signal dots and 0 noise dots. When dots were removed from the signal population, they were added to the noise population and vice versa. Each staircase consisted of six reversals and the last five reversals were averaged to estimate threshold. During each set of measurements, 10 staircases were randomly interleaved. This allowed for threshold measure- ments to be made at five contrast offsets between the two eyes with signal presented to either the dominant or non-dominant eye (based on clinical sighting tests). The contrast of the dots in the non-dominant eye was fixed at a high contrast (80–100%). The contrast of the dots in the dominant eye was varied across the following contrast ratios (1, 0.5, 0.25, and 0.125). Each full set of measurements took ϳ20 min to complete and the measurements were repeated twice to ensure accurate thresholds were obtained. FIGURE 1. The stimuli used for dichoptic motion coherence threshold measurements. In this schematic representation, all the dots in the left eye are moving to the left and constitute the signal dot population. The dots in the right eye are moving in random directions and constitute the noise population. Arrows are for illustration purposes and were not presented in the actual stimulus. (Reproduced from Li, et al. (2010). Invest Ophthalmol Vis Sci. 2010 Dec;51(12):6875–81. Copyright Invest Ophthalmol Vis Sci.) 1074 Modulation of Binocular Balance in Normal Vision—Zhang et al. Optometry and Vision Science, Vol. 88, No. 9, September 2011
- 4. The data relating to the relationship between interocular contrast and dichoptic performance was subjected to a linear fit (orthogonal linear regression) and the balance point derived from the contrast corresponding to the intersection of the linear fits to the data for the dominant and non-dominant eyes.20 Each participant was familiarized with the stimuli and task using a demonstration program where stimuli were presented continu- ously and the proportion of signal and noise dots could be con- trolled using the up and down arrow keys on the laptop keyboard. Once participants were familiar with the task, motion coherence threshold measurements began. Each set of threshold measure- ments began with two square stimulus frames presented separately to each eye with nonius lines next to the fixation marks. Using the arrow keys on the laptop keyboard, participants could adjust the position of the stimulus in the non-dominant eye to ensure that the images in the two eyes were perfectly aligned and fused. The participant then pressed a key to initiate the threshold measure- ments. The left and right arrow keys on the laptop keyboard were used to report the percept of leftward and rightward signal dot motion, respectively. The testing was self-paced with each stimulus being shown 250 ms after the response to the preceding trial. Rationale for the Balance Point Measurement We wanted to use an approach for which it was clear when and to what extent information was being combined between the eyes. We decided to use a signal/noise approach where the signal was presented to one eye and the noise to the other. If the information is rigidly combined between the two eyes, then an obvious decre- ment in performance would result because the noise in one eye would make it harder to detect the signal in the other eye. In our case, the signal was a group of randomly placed dots all moving in the same direction. The subject’s task was to detect this motion direction. The noise consisted of spatially intermingled dots, each of which moved at the same speed but in a random direction (Fig. 1). If the threshold for determining the signal direction was limited by the noise, then information must have been combined binocu- larly. In a perfectly balanced visual system (i.e., with no sensory dominance), this argument does not depend on which eye sees the noise and which eye sees the signal. However, if there is an imbal- ance, noise in the dominant eye will be more effective than if seen through the non-dominant eye. Our method of quantifying the degree of imbalance was to vary the interocular contrast until there is balanced performance, that is when it no longer matters (i.e., equal performance) which eye sees the signal and which eye sees the noise. Thus, we measured the dichoptic threshold ratio (i.e., the ratio between the direction detection performance measured in terms of a signal/noise ratio for when the signal is in one eye and the noise in the other compared with vice versa) as a function of the interocular contrast of the stimuli (be they signal in some cases and noise in other cases) seen by each eye. (The work of Mansouri et al.14 shows how this approach was developed from research into suppression.) Statistical Procedures Balance points were calculated for each participant by determin- ing the intersection of linear fits to both the dominant eye and non-dominant eye motion coherence thresholds as a function of the contrast shown to the dominant eye. A dominant eye threshold was measured when the signal dots were seen by the dominant eye and the noise dots by the non-dominant eye. A non-dominant eye threshold was measured when the non-dominant eye saw the signal dots. A description of the rationale for this technique is provided above and an example dataset is provided in the first paragraph of the results section. Motion coherence threshold dominance ratios8 were calculated using only the thresholds for which both eyes were presented with the same contrast and were calculated using the following formula: (non-dominant eye threshold Ϫ dominant eye threshold)/ (non-dominant eye threshold ϩ dominant eye threshold) Therefore, 0 indicates no difference between the eyes, a positive value indicates a lower threshold for the dominant eye (i.e., better performance by the dominant eye) and a negative value indicates a lower threshold for the non-dominant eye. One-Sample Kolmogorov-Smirnov Tests were used to test that our independent variables were normally distributed. As both the balance point data and the motion coherence threshold dominance ratio data were normally distributed, one sample t-tests were used to assess whether these measures differed from unity between the eyes (i.e., a ratio of 1 for the balance point data or a dominance ratio of 0 for the motion coherence threshold dominance ratio data). A Pearson product moment correlation coefficient was also calculated to assess whether the two measures of eye dominance were correlated. The non-parametric Spearman rho test was used to assess the relationships between variables that did not meet the assumptions for parametric tests. Neutral Density Filters The mean luminance of one eye was varied by the use of Kodak Wratten neutral density filters that were placed in front of the non-dominant eye. The filter values used varied from 1 ND (lu- minance reduction of a factor of 10) to 3 ND (reduction of a factor of 1000). The mean luminance was 50 cd/m2 so that in the most extreme case of 3 ND, the filter restricted vision to the upper mesopic level. Time was allocated for sufficient dark adaptation before testing; however, because the subjects previous light expo- sure was restricted to moderate indoor lighting, this could be rel- atively short (i.e., 5 min). RESULTS Fig. 2 shows an example measurement of the balance point using the approach outlined above. Here, the dichoptic threshold for motion direction detection (% signal elements) is plotted against the interocular contrast ratio for the case where the signal was presented to the dominant (right) eye (open circles) and noise to the non-dominant (left) eye as opposed to vice versa (filled triangles). The contrast presented to the non-dominant eye re- mains fixed whereas the contrast presented to the dominant eye varies from being the same as the contrast shown to the non- dominant eye (interocular contrast ratio of 1) to 20% of the con- trast shown to the non-dominant eye (ratio of 0.2). Each data set Modulation of Binocular Balance in Normal Vision—Zhang et al. 1075 Optometry and Vision Science, Vol. 88, No. 9, September 2011
- 5. has been fit with a linear function using orthogonal linear regres- sion and the point of intersection represents the contrast imbal- ance, our measure of the degree of sensory imbalance, at which it did not matter which eye saw the signal and which eye saw the noise, thresholds were the same. This is marked with the solid black arrow in Fig. 2. In this case, as the contrast of the signal is decreased in the dominant eye, performance deteriorates for the dominant eye and improves for the non-dominant eye. At the balance point, which for this participant was an interocular con- trast ratio of 0.8, the contrast reduction of the dominant eye has neutralized its initial advantage (i.e., the sensory dominance). This result suggests that the right eye is the dominant eye and that the degree of dominance is equivalent to a contrast reduction of 20%. The first question we address concerns the relationship between the dichoptic threshold ratio previously measured in normals,8 and the interocular contrast ratio associated with balanced dichop- tic performance (termed the balance point). The mean contrast ratio at balance point was 0.88 (SD, 0.18) indicating that, on average, the dominant eye required 88% contrast when the non- dominant eye was presented with 100% contrast to achieve di- choptically matched motion coherence thresholds. This bias in contrast ratios toward the dominant eye was reliable for the group, i.e., the ratios were reliably less than one, t(23) ϭ 3.4, p ϭ 0.003. Consistent with this result is the finding that when both eyes were shown the same contrast, the average motion coherence threshold dominance ratio was 0.04 (SD, 0.22) indicating a slight, but in this case non-significant (p Ͼ 0.05), bias toward the dominant eye. Therefore, as a group, our sample of observers with normal binoc- ular vision had well-balanced interocular inhibition for this task. The distribution of contrast ratios at balance point is shown in Fig. 3. It is clear that most of the balance points are close to unity indicating well-balanced interocular inhibition. Some values were greater than unity demonstrating that our dichoptic motion coher- ence test does not always indicate the same eye dominance as the sighting tests used to categorize eyes as dominant vs. non-dominant before running the balance point procedure. This is consistent with previous findings for individuals with relatively weak eye dominance.8 There were also three participants who demonstrated more pronounced contrast imbalances between the two eyes with intero- cular contrast ratios of 0.7 and below, suggesting a stronger imbal- ance between the eyes in favor of the dominant eye. The strength of the imbalance is measured in terms of interocular contrast and thus is an indirect measure. The distribution of the dominance ratios for motion coherence thresholds when the same contrast was shown to each eye is shown in Fig. 4. Again, the distribution is bimodal with most participants showing balanced performance between the eyes and a minority of participants showing a stronger imbalance in favor of the dominant eye. There was a significant correlation between the contrast ratios at balance point and the motion coher- ence dominance ratios when both eyes saw the same contrast (r ϭ Ϫ0.79, p Ͻ 0.001; n ϭ 24, Fig. 4), indicating good agreement between these two measures of interocular suppression. The pat- tern of eye dominance whereby most observers have weak domi- nance with a minority exhibiting more pronounced dominance is consistent with previous reports.8,10,13,21,22 FIGURE 3. The distribution of contrast ratios that gave matched dichotpic motion coherence threshold ratios. A value of 1 indicates a perfect balance between the eyes whereby the same contrast was required by both eyes for matched dichoptic motion coherence thresholds. A value Ͻ1 indicates that the dominant eye required less contrast than the non-dominant eye and a value of Ͼ1 indicates that the dominant eye required more contrast than the non-dominant eye. FIGURE 4. The distribution of motion coherence threshold dominance ratios when the same contrast was presented to both eyes. A dominance ratio of 0 indicates balanced performance between the two eyes. A positive domi- nance ratio indicates that the dominant eye thresholds were lower than the non-dominant eye thresholds (i.e., less signal dots were required when the noise was presented to the non-dominant eye than when the noise was presented to the dominant eye). Negative dominance ratios indicate the opposite relationship. FIGURE 2. Example data from a single participant illustrating the technique used to determine the balance point contrast ratio. A full description of this procedure is provided in the text. 1076 Modulation of Binocular Balance in Normal Vision—Zhang et al. Optometry and Vision Science, Vol. 88, No. 9, September 2011
- 6. The mean motion coherence thresholds, in % signal dots, were 21.1 (SD, 9.6) and 18.6 (SD, 8.1) for the dominant and non- dominant eyes, respectively, when stimuli were shown to each eye at the same contrast. The average motion coherence threshold at the balance point was 20.0 (SD, 7.0). As would be expected for a populationwithnormalbinocularvisualfunction,wedidnotfindany correlations between the balance point measure and interocular acuity difference or the type or magnitude of any phoria. The second question concerns the possible site (or locus along the visual pathway) of the suppressive effects measured here. In particular, we wondered if we could simulate the type of mild suppression one sees in the normal population and the type of severe suppression one seesinamblyopiabyreducingthemeanluminancetooneeye.Wedid this using neutral density filters fitted into light-tight goggles so that the contrast of stimuli would be unaffected. Because cells in the visual cortex are relatively unresponsive to sustained changes in mean lumi- nance compared with their counterparts in the lateral geniculate,6 such a simulation would suggest potential geniculate involvement in the inhibitory circuit. In a subset of our observers with normal binocular function, we were able to replicate the strong imbalance between the two eyes that has previously been reported for observers with amblyo- pia14,23,24 using the neutral density filter technique. The results for one example observer are shown in Fig. 6 where the motion coher- ence thresholds for each eye are plotted as a function of the intero- cular contrast ratio. Linear fits using orthogonal linear regression were then made for each dataset and the intersection of the fits (indicated by the solid arrows) is the point at which equal perfor- mance was achieved between the two eyes. Panel A shows the thresholds for this participant without an ND filter. Under these conditions, there is a normal balance between the two eyes. Panels B to D show the results when a 1 log unit, 2 log unit, and 3 log unit neutral density filter was placed over the non-dominant eye. It is clear that the balance point is gradually shifted toward lower dom- inant eye contrasts (smaller interocular contrast ratios), until for FIGURE 5. The relationship between the motion coherence threshold dominance ratio when the same contrast was presented to both eyes (y axis) and the contrast ratio at the balance point (x axis). The line of best fit found using orthogonal linear regression is shown by the dashed line. FIGURE 6. The measurement of the balance point when neutral density filters are placed before the non-dominant eye. The motion coherence threshold (% signal dots) is plotted against the contrast presented to the dominant eye (non-dominant eye contrast is fixed at 100%). Results are shown for when the dominant eye sees the signal and for when the non-dominant eye sees the signal. Each data set is fitted with a linear function. The contrast corresponding to the intersection of these linear functions represents the balance point measure. As the neutral density filter increases, the balance point is progressively displaced to lower contrasts. Data were from one representative participant with normal binocular vision. Modulation of Binocular Balance in Normal Vision—Zhang et al. 1077 Optometry and Vision Science, Vol. 88, No. 9, September 2011
- 7. the 3 log unit filter the linear fits no longer converge within the range of interocular contrasts provided. This pattern of results is indicative of a gradual increase in the imbalance between the two eyes. Similar results were collected for a group of five normal ob- servers in which the balance point was derived for a series of neutral density filters (0, 1, 2, and 3 ND) fitted in front of the non- dominant eye. These neutral density filter results for a group of normal participants are shown in Fig. 7. The data in Fig. 7 for a group of normal observers shows how the interocular contrast ratio (corresponding to balanced dichoptic performance) varies with the magnitude of mean luminance reduc- tion (over a range of 3 log units or ϫ1000) in the non-dominant eye. There is an orderly reduction in the contrast of the stimuli seen by the dominant eye required to balance the suppressive effects induced by the reduced mean luminance in the non-dominant eye. In other words, a change in interocular mean luminance can cause strong interocular suppressive effects, similar to that previously reported in amblyopia.14 DISCUSSION Ocular dominance is a measure that is clinically useful in determining the suitability of monovision for contact lens wear,21 cataract surgery,10 and for the correction of presbyopia using re- fractive surgery.12,25 It is sometimes determined by alternating a plus 1.5 D lens in front of each eye and determining which eye tolerates the blur best. That eye is taken as the non-dominant eye. Other times, a test of motor dominance is used. The basis of these tests are poorly understood, as sensory dominance correlates with neither motor dominance13,21,26,27 nor monocular visual sensitiv- ity.13 Li et al.8 sought an explanation in terms of a recently pro- posed model of binocular combination,1 which incorporates both inhibitory and excitatory interactions. In particular, they won- dered whether ocular dominance is determined by the extent to which the contralateral inhibitory signals are balanced and they provided support for the hypothesis in terms of the dichoptic sen- sitivity ratio using a motion coherence task. They found a strong correlation between this measure and a more traditional clinical test for sensory dominance and went on to show that the normal population is composed of two overlapping dominance groups, whereby the majority of participants (61%) showed weak domi- nance but a significant minority (39%) showed strong dominance. Their conclusion was based only on the measurement of the di- choptic coherence ratio for stimuli of equal contrast as the measure- ments were optimized for clinical utility. To provide a more complete picture of the role that interocular inhibitory interactions may play in eye dominance, we measured both the balance point, i.e., the contrast ratio at which the dichoptic coherence ratio is at unity,14 as well as the threshold ratio at matched high contrast in a group of binocularly normal individuals. Confirming the results of Li et al.,8 we found a significant correlation between these two measures and provided fur- ther support for the existence of two dominance distributions in the normal population. This was characterized by the majority of subjects exhibiting balanced or weak dominance but a minority exhibiting strong dominance. Knowing the strength of sensory dominance has potentialclinicalvaluethoughatpresentitsmeasurementisnotpartof standard clinical practice. Because dominance cannot be predicted solely on the basis of monocular sensitivity,13 its site along the visual pathway must be at a stage where neurons receive binocular input. The striate cortex and in particular layer 4 is where binocular combination first takes place and it represents the obvious candidate. However, the role of the LGN cannot be discounted because there are reports of inhib- itory binocular interactions between cells from right and left eye laminae4,5,16–18 and also because the feedback from layer 6 of the striate cortex to the geniculate is known to affect both right and right eye inputs.28,29 One striking difference between cells in the LGN and cortex relates to their response to the mean light level. Geniculate cells having a high resting level are very responsive to sustained changes in mean luminance whereas cortical cells have virtually no resting level15 and are not sensitive to changes in mean luminance (but see ref 30). We wondered whether changes in the mean interocular light level could affect the dominance when the interocular contrast was unchanged. If dominance was exclusively cortical, one would not expect such a stimulus manipulation to have much effect; however, if dominance also involves the LGN, mean luminance differences between the eyes could well modulate dominance. We found that changes in mean luminance (where stimulus contrast is unaltered) do systematically affect our mea- surement of the balance point and hence our estimation of domi- nance; the larger the interocular ratio of mean luminance, the greater the change in dominance. This is also the case for suppres- sion in strabismic amblyopia where changes in mean luminance and contrast have been linked to the suppressed function.31 One might hypothesize that in normals, although the excitatory com- bination of left and right eye input takes place in the cortex, the inhibitory contralateral effects may occur at the level the LGN. ACKNOWLEDGMENTS This work was supported by a CIHR (MT53346) grant (to RFH). Received November 4, 2010; accepted April 14, 2011. FIGURE 7. Balance point data as a function of the strength of neutral density filter placed over the non-dominant eye. The interocular contrast ratio corre- sponding to the balance point (Fig. 6) is plotted against the value of the neutral density filter (log units). As shown in the individual example in Fig. 6, results for the group of five subjects show a similar displacement to lower contrast ratios as the value of the neutral density filter increases. The dashed line is the best linear fit. 1078 Modulation of Binocular Balance in Normal Vision—Zhang et al. Optometry and Vision Science, Vol. 88, No. 9, September 2011
- 8. REFERENCES 1. Meese TS, Georgeson MA, Baker DH. Binocular contrast vision at and above threshold. J Vis 2006;6:1224–43. 2. Hubel DH, Wiesel TN. Ferrier lecture. Functional architecture of macaque monkey visual cortex. Proc R Soc Lond B Biol Sci 1977; 198:1–59. 3. Meese TS, Hess RF. Low spatial frequencies are suppressively masked across spatial scale, orientation, field position, and eye of origin. J Vis 2004;4:843–59. 4. Sanderson KJ, Bishop PO, Darian-Smith I. The properties of the binocular receptive fields of lateral geniculate neurons. Exp Brain Res 1971;13:178–207. 5. Sanderson KJ, Darian-Smith I, Bishop PO. Binocular corresponding receptive fields of single units in the cat dorsal lateral geniculate nu- cleus. Vision Res 1969;9:1297–303. 6. Schroeder CE, Tenke CE, Arezzo JC, Vaughan HG, Jr. Binocularity in the lateral geniculate nucleus of the alert macaque. Brain Res 1990; 521:303–10. 7. Tsumoto T. Inhibitory and excitatory binocular convergence to vi- sual cortical neurons of the cat. Brain Res 1978;159:85–97. 8. Li J, Lam CS, Yu M, Hess RF, Chan LY, Maehara G, Woo GC, Thompson B. Quantifying sensory eye dominance in the normal visual system: a new technique and insights into variation across tra- ditional tests. Invest Ophthalmol Vis Sci 2010;51:6875–81. 9. Evans BJ. Monovision: a review. Ophthalmic Physiol Opt 2007;27: 417–39. 10. Handa T, Mukuno K, Uozato H, Niida T, Shoji N, Minei R, Nitta M, Shimizu K. Ocular dominance and patient satisfaction after monovision induced by intraocular lens implantation. J Cataract Re- fract Surg 2004;30:769–74. 11. Schor C, Erickson P. Patterns of binocular suppression and accom- modation in monovision. Am J Optom Physiol Opt 1988;65: 853–61. 12. Wright KW, Guemes A, Kapadia MS, Wilson SE. Binocular function and patient satisfaction after monovision induced by myopic photo- refractive keratectomy. J Cataract Refract Surg 1999;25:177–82. 13. Suttle C, Alexander J, Liu M, Ng S, Poon J, Tran T. Sensory ocular dominance based on resolution acuity, contrast sensitivity and align- ment sensitivity. Clin Exp Optom 2009;92:2–8. 14. Mansouri B, Thompson B, Hess RF. Measurement of suprathreshold binocular interactions in amblyopia. Vision Res 2008;48:2775–84. 15. Troyer TW, Krukowski AE, Miller KD. LGN input to simple cells and contrast-invariant orientation tuning: an analysis. J Neuro- physiol 2002;87:2741–52. 16. Xue JT, Ramoa AS, Carney T, Freeman RD. Binocular interaction in the dorsal lateral geniculate nucleus of the cat. Exp Brain Res 1987; 68:305–10. 17. Pape HC, Eysel UT. Binocular interactions in the lateral geniculate nucleus of the cat: GABAergic inhibition reduced by dominant affer- ent activity. Exp Brain Res 1986;61:265–71. 18. Rodieck RW, Dreher B. Visual suppression from nondominant eye in the lateral geniculate nucleus: a comparison of cat and monkey. Exp Brain Res 1979;35:465–77. 19. Brainard DH. The Psychophysics Toolbox. Spat Vis 1997;10:433–6. 20. Black JM, Thompson B, Maehara G, Hess RF. A compact clinical instrument for quantifying suppression. Optom Vis Sci 2011;88: E334–43. 21. Seijas O, Gomez de Liano P, Gomez de Liano R, Roberts CJ, Piedra- hita E, Diaz E. Ocular dominance diagnosis and its influence in monovision. Am J Ophthalmol 2007;144:209–16. 22. Yang E, Blake R, McDonald JE, II. A new interocular suppression technique for measuring sensory eye dominance. Invest Ophthalmol Vis Sci 2009;51:588–93. 23. Hess RF, Mansouri B, Thompson B. A new binocular approach to the treatment of amblyopia in adults well beyond the critical period of visual development. Restor Neurol Neurosci 2010;28:793–802. 24. Hess RF, Mansouri B, Thompson B. A binocular approach to treat- ing amblyopia: antisuppression therapy. Optom Vis Sci 2010;87: 697–704. 25. Jain S, Arora I, Azar DT. Success of monovision in presbyopes: review of the literature and potential applications to refractive surgery. Surv Ophthalmol 1996;40:491–9. 26. Handa T, Mukuno K, Uozato H, Niida T, Shoji N, Shimizu K. Effects of dominant and nondominant eyes in binocular rivalry. Op- tom Vis Sci 2004;81:377–83. 27. Kommerell G, Schmitt C, Kromeier M, Bach M. Ocular prevalence versus ocular dominance. Vision Res 2003;43:1397–403. 28. Freeman RD, Tsumoto T. An electrophysiological comparison of convergent and divergent strabismus in the cat: electrical and visual activation of single cortical cells. J Neurophysiol 1983;49:238–53. 29. Tsumoto T, Freeman RD. Effects of strabismus on development of cortico-geniculate projections in the kitten. Exp Brain Res 1981;44: 337–9. 30. Geisler WS, Albrecht DG, Crane AM. Responses of neurons in pri- mary visual cortex to transient changes in local contrast and lumi- nance. J Neurosci 2007;27:5063–7. 31. Maehara G, Thompson B, Mansouri B, Hess RF. The roles of con- trast and luminance in amblyopic suppression. J Vision 2009;9:1055. Robert F. Hess The Department of Ophthalmology McGill University 687 Pine Avenue West Rm H4-14 Montreal, Quebec H3A 1A1 Canada e-mail: robert.hess@mcgill.ca Modulation of Binocular Balance in Normal Vision—Zhang et al. 1079 Optometry and Vision Science, Vol. 88, No. 9, September 2011