Cost and schedule risk modelling - Range analysis
•
6 likes•1,759 views

Many of the methods and tools used to model project cost uncertainty have their roots in the time before computers were generally available to support projects. These manual techniques have become embedded in current practice, with all their limitations and shortcomings. They are now regarded as de facto standards simply because they have been in use since before many people working in the field were born but they are inefficient and can be misleading.

Recommended
Recommended
More Related Content
What's hot
What's hot (20)
Similar to Cost and schedule risk modelling - Range analysis
Similar to Cost and schedule risk modelling - Range analysis (20)
Recently uploaded
Recently uploaded (20)
Cost and schedule risk modelling - Range analysis
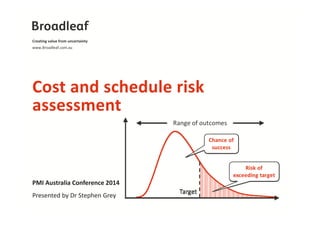
- 1. Creating value from uncertainty www.Broadleaf.com.au Cost and schedule risk assessment PMI Australia Conference 2014 Presented by Dr Stephen Grey
- 2. PMI Australia conference 2014 2 Theme A lot of quantitative risk assessment is unnecessarily cumbersome and soaks up effort without adding value to a project. The approaches used often make it very hard to think clearly and realistically about a project.
- 3. PMI Australia conference 2014 3 Modelling Reality Belief Model Project Σ
- 4. PMI Australia conference 2014 4 Describing a model Assumptions Sources of Dependencies uncertainty Cost
- 5. The requirement PMI Australia conference 2014 5
- 6. PMI Australia conference 2014 Requirement Inputs $ Project Σ Target Duration Risk of exceeding target
- 7. The candidates PMI Australia conference 2014 7
- 8. PMI Australia conference 2014 8 Three methods Risk events • List risks • Probability and impact (range of variation) • Add them up Line items • Line items from estimate (summary) • Range of variation in line item • Add them up Risk factors • Cost or duration estimating relationships • Uncertainty in inputs to relationships (ranges) • Simulate the effect on the base case
- 9. PMI Australia conference 2014 9 Similarities Model RelaƟonships in the model ≡ RelaƟonship in reality? Is the link between inputs and reality easily understood? Almost any attention to project risk will be beneficial Some are more cost‐effective than others
- 10. Risk event model Risk Probability Impact P x I Risk 1 P1 I1 P1 x I1 Risk 2 P2 I2 P2 x I2 Risk 3 P3 I3 P3 x I3 Risk 4 P4 I4 P4 x I4 … … … Risk n Pn In Pn x In Total ΣPi x Ii Monte Carlo simulation PMI Australia conference 2014 10
- 11. PMI Australia conference 2014 11 Modelling based on risk events Σ Risk Probability Impact P x I Risk 1 P1 I1 P1 x I1 Risk 2 P2 I2 P2 x I2 Risk 3 P3 I3 P3 x I3 Risk 4 P4 I4 P4 x I4 … … … Risk n Pn In Pn x In Total ΣPi x Ii Target Risk of exceeding target Monte Carlo simulation
- 12. Line item modelling WBS Item Labour Materials Total Contingency Annnn $ $ $ $ Bnnnn $ $ $ $ Cnnnn $ $ $ $ Dnnnn $ $ $ $ … … … … … Znnnn $ $ $ $ Total Σ$ Σ$ Monte Carlo simulation PMI Australia conference 2014 12
- 13. PMI Australia conference 2014 13 Line item modelling Σ WBS Item Labour Materials Total Contingency Annnn $ $ $ $ Bnnnn $ $ $ $ Cnnnn $ $ $ $ Dnnnn $ $ $ $ … … … … … Znnnn $ $ $ $ Total Σ$ Σ$ Target Risk of exceeding target Monte Carlo simulation
- 14. Risk factors model Cost estimating relationships (e.g. Cost = Quantity x Unit rate) Project estimate summary Labour Facilities Super‐vision Materials Sub‐contracts Services Expenses Total Earthworks 1234567 1234567 1234567 1234567 1234567 1234567 1234567 ? Concrete 1234567 1234567 1234567 1234567 1234567 1234567 1234567 ? … 1234567 1234567 1234567 1234567 1234567 1234567 1234567 ? Overheads 1234567 1234567 1234567 1234567 1234567 1234567 1234567 ? Project Total ? ? ? ? ? ? ? ? Uncertainty about quantities of concrete (m3) Uncertainty about rates for cost of concrete ($/m3) PMI Australia conference 2014 14 Simulated cost = Base estimate x (1 + ΔQuantity) x (1 + ΔRate)
- 15. Simulated cost = Base estimate x (1 + ΔQuantity) x (1 + ΔRate) Σ Σ PMI Australia conference 2014 15 Risk factor modelling Target Risk of exceeding target Project estimate summary Labour Facilities Super‐vision Materials Sub‐contracts Services Expenses Total Earthworks 1234567 1234567 1234567 1234567 1234567 1234567 1234567 ? Concrete 1234567 1234567 1234567 1234567 1234567 1234567 1234567 ? … 1234567 1234567 1234567 1234567 1234567 1234567 1234567 ? Overheads 1234567 1234567 1234567 1234567 1234567 1234567 1234567 ? Project Total ? ? ? ? ? ? ? ? Uncertainty about quantities of concrete (m3) Uncertainty about rates for cost of concrete ($/m3) Σ
- 16. Making it work PMI Australia conference 2014 16
- 17. PMI Australia conference 2014 17 Risk event Variation in cost if the event occurs Variation in cost if the event occurs No effect Probability = 33% Probability = 67% Min =$2M Likely=$4M Max=$8M No effect Probability = 33% Probability = 67% Min =$2M Likely=$4M Max=$8M Inputs Project Σ Outputs
- 18. PMI Australia conference 2014 18 Risk event model Inputs Project Σ Outputs Inputs Project Σ Outputs Inputs Project Σ Outputs Inputs Project Σ Outputs Inputs Project Σ Outputs Inputs Project Σ Outputs Inputs Project Σ Outputs Inputs Project Σ Outputs Inputs Project Σ Outputs Target Risk of exceeding target Common factors, overlaps and interactions
- 19. PMI Australia conference 2014 19 Line item range Cost line item Inputs Σ Outputs
- 20. PMI Australia conference 2014 20 Line item model Target Risk of exceeding target Common dependencies and correlations
- 21. Cost drivers PMI Australia conference 2014 21 Risk factor model Risk factors Inputs Σ Outputs Risk factor Target Risk of exceeding target
- 22. Risk factor example (partial) Small IT development project Professional services $ Software scale Team productivity Professional services rates Duration Overhead rates ($/month) Overhead $ Market rates for licenses Number of users Design decision Option 1 Option 2 Installed Contingency assessment license cost $ methods & trends 22
- 23. Electrical & instrumentation Steel, mechanical & piping Concrete Earthworks Risk factor example (partial) Mineral processing plant construction Earthworks direct labour $ Earthworks quantity Labour productivity Labour rates Option 1 Bulk material cost $ Bulk material rates Design decision Lump sum value Option 2 Major equipment item cost $ $/m3 Contingency assessment methods & trends 23
- 24. Assessing input parameters PMI Australia conference 2014 24
- 25. PMI Australia conference 2014 25 Describing a range Common practice 1. Start in the middle and work out 2. Explain reason for choosing numbers Anchoring bias Confirmation bias 3 1 2 Outcome
- 26. PMI Australia conference 2014 26 Describing a range Good practice 1. Establish context • Assumptions • Sources of uncertainty • Pessimistic and optimistic scenarios Pre‐empt confirmation 2. Start with the extremes and work in Break anchoring
- 27. PMI Australia conference 2014 27 Describing a range Common practice Assumptions Sources of uncertainty Scenarios 2 3 1 Outcome
- 28. PMI Australia conference 2014 28 Summary Modelling using risk factors is generally simpler and more realistic than using structures based on risk events or line item ranging Context setting and methods to limit anchoring are required to get realistic assessments of uncertain values’ ranges It need not be hard work!
- 29. PMI Australia conference 2014 29 Contact Dr Stephen Grey Associate Director Grey@Broadleaf.com.au +61 412 223 256 If you would like further information about this topic please contact us. For further information visit www.Broadleaf.com.au © 2014 Broadleaf Capital International Pty Ltd. All rights reserved.