More Related Content Similar to Water quality and land cover change analysis in East Tennessee watersheds (20) 1. RESEARCH POSTER PRESENTATION DESIGN © 2012
www.PosterPresentations.com
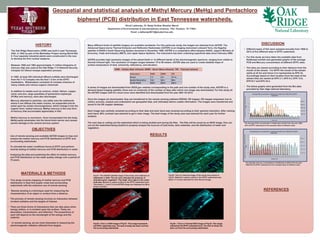
INTRODUCTION
MATERIALS & METHODS
RESULTS
RESULTS Contd.
Shruti Lakkaraju*, Maruthi Sridhar B. Bhaskar
Department of Environmental & Interdisciplinary sciences, TSU, Houston, TX 77004.
Email: s.lakkaraju9612@student.tsu.edu
OBJECTIVES
• ASTER provides high-resolution images of the planet Earth in
14 different bands of the electromagnetic spectrum, ranging
from visible to thermal infrared light. Band 1-3 are the visible
region, Band 4-9 are the near infrared and infrared region, Band
10-14 fall under the thermal region.
• A series of images were downloaded from USGS.gov website
corresponding to the path and row number of the study area. For
this study 12 ASTER images were downloaded from the year
2001 till 2013.
CONCLUSION
• The vegetation cover in the study area decreased from 16637 to
16169 acres and the impervious surface cover increased from
2263 to 2631 acres during the period of 2004 to 2007.
• Our results indicate that there is an increase in the impervious
area along the Lower EFPC resulting in higher turbidity and Hg
concentrations compared to upper EFPC.
• Our chemical analysis showed higher concentrations of Hg and
As(Arsenic). Also the Hg concentrations in the samples were
correlated to the turbidity levels in the water.
Water Quality and Land Cover Change Analysis in East Tennessee watersheds.
• A total of 27 water samples were collected from the EFPC in
summer of 2015.
• The sampling locations were recorded with a handheld GPS
unit and the samples were transported to Texas Southern
University for chemical analysis.
• The water turbidity was recorded using a portable turbidity
meter. The water samples were filtered using a filter paper
and acid digested with 5% HNO3 and then analyzed using
ICP-MS.
• Chemical analysis
• All the 12 images were transferred to the remote sensing software
ERDAS, ER mapper for further analysis. ER mapper empowers
one to collect, process, analyze and understand raw geospatial data,
and ultimately deliver usable information.
• Out of the 12 images downloaded and processed two of the images
from the year 2004 and 2007 were completely cloud free. These
two images were used to analyze the land cover change at EFPC
watershed.
• The next step is cutting out the watershed which is being studied
and saving the files. The files will be saved as an NDVI
(Normalized Difference Vegetation Index) image. One can cut out
the watershed being studied to properly analyze the sources of heat
sinks, dark materials, and the distribution of water and vegetation.
Formula: (Band 3-Band 2) / (Band 3 + Band 2)
• The Dark Object Subtracted (DOS) NDVI images of the study area
were processed from the cloud free ASTER images of 2004 and
2007. They are shown in Fig.04.
• The Oak Ridge Reservation (ORR) was built in east Tennessee,
USA, in 1942 as part of the Manhattan Project during World
War II. Between 1950 and 1963 approximately 11 million
kilograms of mercury (Hg) was used at the Oak Ridge Y-12
National Security Complex.
• There are 5 watersheds located in and around the oak ridge Y-12
complex. EFPC (East Fork Poplar Creek) watershed has
received wastewaters and pollutants from the Y-12 complex,
which is located on the headwaters of the stream.
• Waste waters consisted of heavy metals such as uranium, nickel,
lithium, copper, silver, zinc, and large quantities of mercury.
• Test the water quality and to analyze the various nutrient and
heavy metal concentrations.
• Use of remote sensing and available ASTER images to map and
analyze the land cover change and predict the hot spots of
mercury pollution.
• This study involves mapping of mercury distribution in East fork
poplar creek and surrounding watersheds with the use of remote
sensing.
• Remote sensing is a technique used for measuring the
characteristics of an object or surface from a distance. In remote
sensing, we are most interested in measuring the electromagnetic
radiation reflected from targets.
• Remote Sensing Image analysis
Fig.01: Map showing EFPC watershed and creek with all
the water sampling locations.
Fig.05: Mercury concentration at various water sampling
locations in EFPC watershed.
Fig.06: Turbidity of the water samples at EFPC watershed.
Fig.02: Water samples
collected from EFPC.
Fig.03: Turbidity meter.
(LaMotte 2020we)
A. 2004 EFPC B. 2004 Vegetation C. 2004 Urban Area
D. 2007 EFPC E. 2007 Vegetation F. 2007 Urban area
Fig.04: ASTER satellite imagery: A) The pseudo color image of EFPC watershed, September 2004. B) NDVI image with a mask of 0.2 for
vegetation. C) NDVI image of watershed with a mask of 0.75 for the urban area. D) Pseudo color image of EFPC watershed, June 2007.
E) NDVI image of the watershed with a mask of 0.2 for vegetation. F) NDVI image of the watershed with a mask of 0.75 for the urban
area.