6 pma salehuddin - pareto assignment
•Download as DOC, PDF•
3 likes•1,622 views

Pareto

Recommended
More Related Content
What's hot
Similar to 6 pma salehuddin - pareto assignment
Similar to 6 pma salehuddin - pareto assignment (20)
More from Capt(Rtd) Salehuddin Abdul Kadir
More from Capt(Rtd) Salehuddin Abdul Kadir (14)
Recently uploaded
Recently uploaded (20)
6 pma salehuddin - pareto assignment
- 1. SELECTING IMPROVEMENT SUBJECTS USING PARETO CHARTS & STRATIFICATION 1.0 INTRODUCTION The Pareto Principle is named after Vilfredo Pareto, a 19th century economist who concluded that a large share of wealth in Italy is owned by a small percentage of the population. The distribution of wealth for 20% of Italians possesses 80% of the wealth. This basic principle is then translated into the Pareto Chart and widely used as one of the many quality tools. Pareto Charts are extremely useful because they can be used to identify those factors that have the greatest cumulative effect on the system, and thus screen out the less significant factors in an analysis. The Pareto Chart is most effective when the data are stratified into categories in terms of impact, e.g., time or cost, versus just the count of occurrences to look at the situation from other angles before making any decision. Making problem solving decisions isn’t the only use of the Pareto Principle. Since Pareto Charts convey information in a way that can be used to set priorities, it can also be utilized for many practical applications. Starlight Homes is a building contractor specializing in upscale homes in the Southwest. Before each new home is sold, Starlight conducts final inspection of the home and repairs any defects. In addition, Starlight receives a list of defects to be corrected compiled by the buyers before the sale. Starlight Home lead supervisor, Ricardo, has concluded that even if it would cost less to do the work right in the first place rather than going back to fix the defects. In an effort to reduce costs, improve the quality of Starlight’s homes and reduce the number of complaints after the sale, Ricardo has assembled data from his final inspections and the defects list for the last 20 homes sold. 2.0 OBJECTIVE Based on the assignment questions, the objectives for this assignment are: a) Construct a Pareto to illustrate the defect types by number of defects and answer the following: i) Which two defect types appear to be the most significant? ii) Should Ricardo focus his attention on these two categories of defects? 1
- 2. b) Stratify the Pareto Chart by cost and answer the following: i) Which two or three defect types are the most significant in terms of cost? ii) Was Ricardo justified in stratification before making a decision? 3.0 METHODOLOGY Methodology is the manner, method, procedure, way or approach that will be used to attain, achieve, and accomplish the objective of this assignment. Two Pareto Charts will be constructed to answer the questions related to the charts. Additional Pareto Charts should be produced if further relevant stratification of the data can help make a better decision. The Pareto Charts can assist Ricardo to reduce cost and improve the quality of Starlight’s housing projects in the future. 4.0 PARETO CHART BASED ON DEFECT OCCURRENCE First of all, the occurrences are sorted from largest to smallest. Next is to calculate the cumulative occurrence for the defects. Based on the cumulative occurrence, a cumulative percentage is then calculated. The data for defect occurrence is per Figure 4.0A. The Pareto Chart based on defect occurrence is per Figure 4.0B. DEFECT TYPE OCCURRENCE CUMULATIVE OCCURRENCE CUMULATIVE PERCENT Interior Paint 61 61 22% Woodwork 46 107 39% Plumbing 33 140 51% Caulking 28 168 61% Electrical 25 193 70% Landscaping 16 209 76% Doors 14 223 81% Damaged Walls 13 236 86% Cabinetry 12 248 90% HVAC 11 259 94% Fixtures 7 266 96% Exterior Paint 5 271 98% Roof 3 274 99% Masonry 2 276 100% Figure 4.0A – Data for Defect Occurrence 2
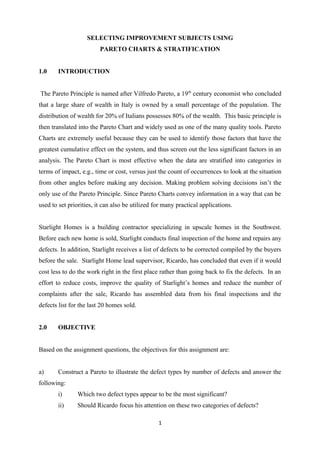
- 3. Figure 4.0B – Pareto Chart Based on Defect Occurrence Based on the Pareto Chart the following questions can be answered: a) Which two defect types appear to be the most significant? The two defect types that appear most significant are Interior Paint and Woodwork. The two categories of defect make up 39% of defect occurrences. b) Should Ricardo focus his attention on these two categories of defects? These two categories will improve the QUALITY by focusing on the two most occurred defects but not necessarily reduce the COST. Therefore, it is best to also stratify the Pareto Chart using average cost per defect before making any decision. 5.0 PARETO CHART BASED ON COST OF EACH DEFECT The average cost per defect is sorted from largest to smallest. Next is to calculate the cumulative cost for the defects. Based on the cumulative cost, a cumulative percentage is then calculated. The data for average cost per defect is per Figure 5.0A. The Pareto Chart based on cost is per Figure 5.0B. 3
- 4. DEFECT TYPE AVERAGE COST PER DEFECT ($) CUMULATIVE COST CUMULATIVE COST PERCENTAGE Masonry 290 290 30% Damaged Walls 126 416 44% HVAC 110 526 55% Cabinetry 88 614 64% Plumbing 78 692 72% Electrical 74 766 80% Roof 72 838 88% Landscaping 34 872 91% Fixtures 31 903 95% Exterior Paint 25 928 97% Doors 11 939 98% Caulking 7 946 99% Woodwork 5 951 100% Interior Paint 4 955 100% Figure 5.0A – Data for Average Cost per Defect Figure 5.0B – Pareto Chart Based on Average Cost per Defect Based on the Pareto Chart the following questions can be answered: a) Which two or three defect types are the most significant in terms of cost? The three defect types that appear most significant for average cost per repair event are Masonry, Damaged Walls and HVAC. The three categories of defect make up 55% of cost per repair event. 4
- 5. b) Was Ricardo justified in stratification before making a decision? These three categories will improve the COST per repair event by focusing on the three highest costs per defect but not necessarily improve the QUALITY (reduced number of defects). Therefore, Ricardo’s decision based on the second level of stratification is only justified if Ricardo is only concerned about lowering COST. Another viable option for Ricardo is to stratify the Pareto Chart by combining variables of total defect occurrence and total cost of repair for each defect to view the problem from another paradigm. 6.0 RECOMMENDATION - PARETO CHART BASED ON TOTAL COST OF DEFECTS The two different variables of defect occurrence and cost per defect are used together in order to produce a total cumulative cost that is sorted from largest to smallest. Based on the total cumulative cost, a cumulative percentage is then calculated. The data for variables are per Figure 6.0A. The Pareto Chart produced is per Figure 6.0B. DEFECT TYPE OCCURRENCE AVERAGE COST PER OCCURENCE ($) TOTAL COST ($) CUMULATIVE COST CUMULATIVE PERCENTAGE Plumbing 33 78 2574 2574 24% Electrical 25 74 1850 4424 41% Damaged Walls 13 126 1638 6062 56% HVAC 11 110 1210 7272 67% Cabinetry 12 88 1056 8328 77% Masonry 2 290 580 8908 82% Landscaping 16 34 544 9452 87% Interior Paint 61 4 244 9696 89% Woodwork 46 5 230 9926 92% Fixtures 7 31 217 10143 94% Roof 3 72 216 10359 96% Caulking 28 7 196 10555 97% Doors 14 11 154 10709 99% Exterior Paint 5 25 125 10834 100% Figure 6.0A – Data for Total Cost of Defects 5
- 6. Figure 6.0B – Pareto Chart Based on Total Cost of Defects 6.0 FINDINGS Based on the recommendation, the three defect types that appear most significant for total cost of defects are Plumbing, Electrical and Damaged Walls. The three categories of defect make up 56% of total cost of defects. These three categories to focus on are a better decision if Ricardo wants to improve the QUALITY and COST because it considers the number of defect occurrence and total cost of each defect occurrence. The differences of categories from each Pareto Chart are shown in Figure 7.0A. SIGNIFICANT CATEGORIES FROM PARETO CHART BASED ON: DEFECT OCCURENCE COST PER DEFECT TOTAL COST FOR EACH DEFECT 1. Interior Paint Masonry Plumbing 2. Woodwork Damaged Walls Electrical 3. Plumbing HVAC Damaged Walls Figure 7.0 – Comparison of Significant Categories for Different Pareto Charts 7.0 CONCLUSION 6
- 7. As a conclusion, Ricardo’s first Pareto Chart will only improve the QUALITY of Starlight’s homes. The second Pareto Chart will reduce COST which is what Ricardo used in making the decision to focus on two or three categories from the second level stratification. The recommended third Pareto Chart will improve both QUALITY and COST of Starlight homes. Ricardo should have considered further stratification of relevant variables like the third Pareto Chart to achieve the intent and effort to reduce COSTS and improve QUALITY that will contribute in lesser complaints from future buyers. Therefore, the Pareto Chart is most effective when relevant variables of stratification are used before making any decisions.. REFERENCE 7
- 8. 1. Hj. Ir. Mohd Hanaffi Bin Ayob. Lecture Notes. 2013 2. Prof. Ir. Dr. Sha’ri. Lecture Notes. 2013 3. Goetsch D. Implementing TQM. Pearson/Prentice Hall. 1995 4. Juran. Quality Control Handbook. 5th edition. Mcgraw Hill. 1999. 5. Tari J. Components of Successful Total Quality Management. TQM Magazine. Vol 17 Issue 2. 20015 6. Nguyen F. Using Total Quality Management. Scopus Articlebase. 2008. 7. Pomoni C. The Basics of Total Quality Management. Web of Science. 2010. 8. Saha A. Introduction and an Overview of Implementing Total Quality Management. University of New York. Feb 2008. 8