SlideShare a Scribd company logo
1 of 2
Download to read offline
Which countries outperform compared to population in producing the best football talent at U-21?
 by Siggi Eyjolfsson - Technical director, The Icelandic F.A.           U-21 2007 (Q/F) 20%, U-21 2009 (Q/F) 40%, U-21 2011 (Q/) 40%
Source: UEFA U-21 national team coefficent ranking (released 18/1 2011) and Population Reference Bureau (www.prb.org). Population Mid 2010.
                                 Total           Population       Outperforms+                                        Total          Population Outperforms+
                    UEFA         Population rank within Underperforms-                                 UEFA           Population rank within Underperforms-
                    Coefficient in millions Europe                     (A-E)                           Coefficient in millions Europe                (A-E)
 1 England              37,459            51,5                6         5        27 Slovakia               25,201              5,4        27-28      0-1
 2 Spain                36,608            47,1                7         5        28 Moldova                24,546              4,1           34       6
 3 Netherlands          34,863            16,6            11            8        29 Finland                23.820              5,4        27-28      1-2
 4 Italy                34,378            60,5                5         1        30 Armenia                23.607              3,1           38       8
 5 Sweden               34,172             9,4            19            14       31 North. Ireland         23,102              1,8           43       12
 6 Czech Republic       34,167            10,5            16            10       32 Poland                 23,101             38,2            9      23
 7 Russia               32,672           141,9                1         6        33 Montenegro             22,845             0,63           46       13
 8 Serbia               32,392             7,3            25            17       34 Georgia                22,236              4,6           31       3
 9 Germany              32,372            81,6                2         7        35 Latvia                 21,749              2,2           40       5
10 Romania              31,135            21,5            10            0        36 Norway                 21,576              4,9           30       6
11 Switzerland          31,099             7,8            22            11       37 Slovenia               20,326              2,1        41-42      4-5
12 Wales                30,792              3             39            27       38 Rep. of Ireland        20,246              4,5           32       6
13 Belarus              30,555             9,5            18            5        39 Bulgaria               19,901              7,5           24       15
14 France               30,307             63                 4         10       40 Bosnia and Herz.       19,351              3,8           35       5
15 Ukraine              30,067            45,9                8         7        41 FYROM                  18,826              2,1        41-42      0-1
16 Israel               29,797             7,6            23            7        42 Albania                18,566              3,2           37       5
17 Turkey               29,141            73,6                3         14       43 Faroe Islands          16,976             0,05           51       8
18 Austria              29,102             8,4            21            3        44 Cyprus                 16,776              1,1           45       1
19 Portugal             29,023            10,7            15            4        45 Lithuania                 16,55            3,3           36       9
20 Denmark              28,785             5,6            26            6        46 Kazahkstan             15,976             16,3           12      34
21 Belgium              28,326            10,8            14            7        47 Estonia                15,411              1,3           44       3
22 Croatia              27,402             4,4            33            11       48 Azerbaijan             12,326              9,1           20      28
23 Hungary              26,927             10             17            6        49 Andorra                11,433             0,08           50       1        Black countries outperform
24 Scotland             26,747             5,2            29            5        50 San Marino             10,901             0,03           53       3        Red countries underperform
25 Greece               26,491            11,3            13            12       51 Luxembourg             10,625             0,51           47       4
26 Iceland              26,232            0,32            49            23       52 Malta                  10,551             0,42           48       4
                                                                                 53 Liechtenstein             8,325           0,04           52       1
Best countries in Europe in creating U-21 talent 2007-2011 compared to population are therefore as follows:

 1 Wales              27                  21 Slovenia          4-5              41 Russia        6
 2 Iceland            23                  22   San Marino       3               42 Norway        6
 3 Serbia             17                  23   Austria          3               43 Belgium       7
 4 Sweden             14                  24   Finland         1-2            44-45 Ukraine      7
 5 Montenegro         13                  25   Italy            1             44-45 Germany      7
 6 Northern Ireland   12                  26   Cyprus           1               46 Lithuania     9
7-8 Croatia           11                  27   Andorra          1               47 France       10
7-8 Switzerland       11                  28   Slovakia        0-1              48 Greece       12
 9 Czech Republic     10                  29   Romania          0               49 Turkey       14
10-12
    Netherlands        8                  30   FYROM           0-1              50 Bulgaria     15
10-12
    Faroe Islands      8                  31   Liechtenstein    1               51 Poland       23
10-12
    Armenia            8                  32   Estonia          3               52 Azerbaijan   28
13 Israel              7                  33   Georgia          3               53 Kazahkstan   34
14-15
    Denmark            6                  34   Portugal         4
14-15
    Moldova            6                  35   Malta            4
16-20
    England            5                  36   Luxembourg       4
16-20
    Spain              5                  37   Albania          5
16-20
    Scotland           5                  38   Bosnia and Herz. 5
16-20
    Belarus            5                  39   Rep. of Ireland  6
16-20
    Latvia             5                  40   Hungary          6

    Black countries outperform
    Red countries underperform

More Related Content

Viewers also liked (6)

Be Like A Coach - Mark Siwik and Jim Tressel
Be Like A Coach - Mark Siwik and Jim TresselBe Like A Coach - Mark Siwik and Jim Tressel
Be Like A Coach - Mark Siwik and Jim Tressel
 
DFB Youth Development Program
DFB Youth Development ProgramDFB Youth Development Program
DFB Youth Development Program
 
Small sided games_book
Small sided games_bookSmall sided games_book
Small sided games_book
 
Playing the 4 2-3-1 (Updated 9-29-15)
Playing the 4 2-3-1 (Updated 9-29-15)Playing the 4 2-3-1 (Updated 9-29-15)
Playing the 4 2-3-1 (Updated 9-29-15)
 
Liverpool FC - Coaching Manual
Liverpool FC - Coaching ManualLiverpool FC - Coaching Manual
Liverpool FC - Coaching Manual
 
Book print & go soccer practice plans
Book   print & go soccer practice plansBook   print & go soccer practice plans
Book print & go soccer practice plans
 

Similar to U 21 talent development compared to population - siggi eyjolfsson (1)

1997internationaljobsatisfaction
1997internationaljobsatisfaction1997internationaljobsatisfaction
1997internationaljobsatisfaction
Ramana Reddy
 
Reporte final - Votos de Mexicanos en el extranjero - IFE
Reporte final - Votos de Mexicanos en el extranjero - IFEReporte final - Votos de Mexicanos en el extranjero - IFE
Reporte final - Votos de Mexicanos en el extranjero - IFE
Marcos Eduardo Villa Corrales
 
R qa1203 anx9a
R qa1203 anx9aR qa1203 anx9a
R qa1203 anx9a
adyaner
 
Linked In Slideshow
Linked In SlideshowLinked In Slideshow
Linked In Slideshow
WorldCity
 
Engineering Infrastructure for Machine Design and Small Scale Manufacturing f...
Engineering Infrastructure for Machine Design and Small Scale Manufacturing f...Engineering Infrastructure for Machine Design and Small Scale Manufacturing f...
Engineering Infrastructure for Machine Design and Small Scale Manufacturing f...
Government of Ekiti State, Nigeria
 
Population list of the world
Population list of the worldPopulation list of the world
Population list of the world
Susheel Mittal
 
Wine Production In Depth
Wine Production In DepthWine Production In Depth
Wine Production In Depth
MGM Sommelier
 

Similar to U 21 talent development compared to population - siggi eyjolfsson (1) (20)

1997internationaljobsatisfaction
1997internationaljobsatisfaction1997internationaljobsatisfaction
1997internationaljobsatisfaction
 
Gnipc
GnipcGnipc
Gnipc
 
Gnipc
GnipcGnipc
Gnipc
 
Gdp ppp
Gdp pppGdp ppp
Gdp ppp
 
Gdp
GdpGdp
Gdp
 
Reporte final - Votos de Mexicanos en el extranjero - IFE
Reporte final - Votos de Mexicanos en el extranjero - IFEReporte final - Votos de Mexicanos en el extranjero - IFE
Reporte final - Votos de Mexicanos en el extranjero - IFE
 
Jjoo 1912
Jjoo 1912Jjoo 1912
Jjoo 1912
 
R qa1203 anx9a
R qa1203 anx9aR qa1203 anx9a
R qa1203 anx9a
 
Book1
Book1Book1
Book1
 
Which countries are best in the world in A- national team football by Siggi E...
Which countries are best in the world in A- national team football by Siggi E...Which countries are best in the world in A- national team football by Siggi E...
Which countries are best in the world in A- national team football by Siggi E...
 
Linked In Slideshow
Linked In SlideshowLinked In Slideshow
Linked In Slideshow
 
Engineering Infrastructure for Machine Design and Small Scale Manufacturing f...
Engineering Infrastructure for Machine Design and Small Scale Manufacturing f...Engineering Infrastructure for Machine Design and Small Scale Manufacturing f...
Engineering Infrastructure for Machine Design and Small Scale Manufacturing f...
 
Data
DataData
Data
 
Perú en la IMO hasta el 2020, Internacionales de Matemáticas
Perú en la IMO hasta el 2020, Internacionales de MatemáticasPerú en la IMO hasta el 2020, Internacionales de Matemáticas
Perú en la IMO hasta el 2020, Internacionales de Matemáticas
 
Aliyah Statistics 3.10
Aliyah Statistics 3.10Aliyah Statistics 3.10
Aliyah Statistics 3.10
 
MRC: Caustic & Chlorine Outlook in Russia /Eastern Europe, Kiev, 4 th Russia ...
MRC: Caustic & Chlorine Outlook in Russia /Eastern Europe, Kiev, 4 th Russia ...MRC: Caustic & Chlorine Outlook in Russia /Eastern Europe, Kiev, 4 th Russia ...
MRC: Caustic & Chlorine Outlook in Russia /Eastern Europe, Kiev, 4 th Russia ...
 
Population list of the world
Population list of the worldPopulation list of the world
Population list of the world
 
Wine Production In Depth
Wine Production In DepthWine Production In Depth
Wine Production In Depth
 
Megaworld Media Kit
Megaworld Media KitMegaworld Media Kit
Megaworld Media Kit
 
1. 2016 17
1. 2016 171. 2016 17
1. 2016 17
 

More from Robin.Russell

Presentation for gff
Presentation for gffPresentation for gff
Presentation for gff
Robin.Russell
 
Assessment or training based learning
Assessment or training  based learningAssessment or training  based learning
Assessment or training based learning
Robin.Russell
 
European Goalscorers
European GoalscorersEuropean Goalscorers
European Goalscorers
Robin.Russell
 
Spanish football Data
Spanish football DataSpanish football Data
Spanish football Data
Robin.Russell
 
Attracting volunteers pdf
Attracting volunteers pdfAttracting volunteers pdf
Attracting volunteers pdf
Robin.Russell
 
Euro u 19-summary (2)
Euro u 19-summary (2)Euro u 19-summary (2)
Euro u 19-summary (2)
Robin.Russell
 
Lma leadership & management model 2
Lma leadership & management model 2Lma leadership & management model 2
Lma leadership & management model 2
Robin.Russell
 
Hw presentation nscaa final less video
Hw presentation nscaa final less videoHw presentation nscaa final less video
Hw presentation nscaa final less video
Robin.Russell
 

More from Robin.Russell (20)

About potentialing
About potentialingAbout potentialing
About potentialing
 
Potentialing cover 3[4] (1)
Potentialing cover 3[4] (1)Potentialing cover 3[4] (1)
Potentialing cover 3[4] (1)
 
Final event showguide
Final event showguideFinal event showguide
Final event showguide
 
Street soccer
Street soccerStreet soccer
Street soccer
 
FC Lille KPI's
FC Lille KPI's FC Lille KPI's
FC Lille KPI's
 
Cal south 2012
Cal south 2012Cal south 2012
Cal south 2012
 
EPP
EPPEPP
EPP
 
Presentation for gff
Presentation for gffPresentation for gff
Presentation for gff
 
Assessment or training based learning
Assessment or training  based learningAssessment or training  based learning
Assessment or training based learning
 
2011 cl finalist
2011 cl finalist2011 cl finalist
2011 cl finalist
 
European Goalscorers
European GoalscorersEuropean Goalscorers
European Goalscorers
 
Spanish football Data
Spanish football DataSpanish football Data
Spanish football Data
 
Attracting volunteers pdf
Attracting volunteers pdfAttracting volunteers pdf
Attracting volunteers pdf
 
Euro u 19-summary (2)
Euro u 19-summary (2)Euro u 19-summary (2)
Euro u 19-summary (2)
 
How can iceland produce so many professional players sept 2010 (1)
How can iceland produce so many professional players sept 2010 (1)How can iceland produce so many professional players sept 2010 (1)
How can iceland produce so many professional players sept 2010 (1)
 
How can iceland produce so many professional players sept 2010
How can iceland produce so many professional players sept 2010How can iceland produce so many professional players sept 2010
How can iceland produce so many professional players sept 2010
 
10 grassroots soccer trends for the next 10 years
10 grassroots soccer trends for the next 10 years10 grassroots soccer trends for the next 10 years
10 grassroots soccer trends for the next 10 years
 
Lma leadership & management model 2
Lma leadership & management model 2Lma leadership & management model 2
Lma leadership & management model 2
 
Hw presentation nscaa final
Hw presentation nscaa finalHw presentation nscaa final
Hw presentation nscaa final
 
Hw presentation nscaa final less video
Hw presentation nscaa final less videoHw presentation nscaa final less video
Hw presentation nscaa final less video
 

U 21 talent development compared to population - siggi eyjolfsson (1)

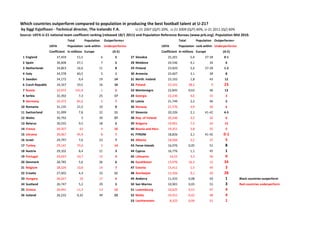
  • 1. Which countries outperform compared to population in producing the best football talent at U-21? by Siggi Eyjolfsson - Technical director, The Icelandic F.A. U-21 2007 (Q/F) 20%, U-21 2009 (Q/F) 40%, U-21 2011 (Q/) 40% Source: UEFA U-21 national team coefficent ranking (released 18/1 2011) and Population Reference Bureau (www.prb.org). Population Mid 2010. Total Population Outperforms+ Total Population Outperforms+ UEFA Population rank within Underperforms- UEFA Population rank within Underperforms- Coefficient in millions Europe (A-E) Coefficient in millions Europe (A-E) 1 England 37,459 51,5 6 5 27 Slovakia 25,201 5,4 27-28 0-1 2 Spain 36,608 47,1 7 5 28 Moldova 24,546 4,1 34 6 3 Netherlands 34,863 16,6 11 8 29 Finland 23.820 5,4 27-28 1-2 4 Italy 34,378 60,5 5 1 30 Armenia 23.607 3,1 38 8 5 Sweden 34,172 9,4 19 14 31 North. Ireland 23,102 1,8 43 12 6 Czech Republic 34,167 10,5 16 10 32 Poland 23,101 38,2 9 23 7 Russia 32,672 141,9 1 6 33 Montenegro 22,845 0,63 46 13 8 Serbia 32,392 7,3 25 17 34 Georgia 22,236 4,6 31 3 9 Germany 32,372 81,6 2 7 35 Latvia 21,749 2,2 40 5 10 Romania 31,135 21,5 10 0 36 Norway 21,576 4,9 30 6 11 Switzerland 31,099 7,8 22 11 37 Slovenia 20,326 2,1 41-42 4-5 12 Wales 30,792 3 39 27 38 Rep. of Ireland 20,246 4,5 32 6 13 Belarus 30,555 9,5 18 5 39 Bulgaria 19,901 7,5 24 15 14 France 30,307 63 4 10 40 Bosnia and Herz. 19,351 3,8 35 5 15 Ukraine 30,067 45,9 8 7 41 FYROM 18,826 2,1 41-42 0-1 16 Israel 29,797 7,6 23 7 42 Albania 18,566 3,2 37 5 17 Turkey 29,141 73,6 3 14 43 Faroe Islands 16,976 0,05 51 8 18 Austria 29,102 8,4 21 3 44 Cyprus 16,776 1,1 45 1 19 Portugal 29,023 10,7 15 4 45 Lithuania 16,55 3,3 36 9 20 Denmark 28,785 5,6 26 6 46 Kazahkstan 15,976 16,3 12 34 21 Belgium 28,326 10,8 14 7 47 Estonia 15,411 1,3 44 3 22 Croatia 27,402 4,4 33 11 48 Azerbaijan 12,326 9,1 20 28 23 Hungary 26,927 10 17 6 49 Andorra 11,433 0,08 50 1 Black countries outperform 24 Scotland 26,747 5,2 29 5 50 San Marino 10,901 0,03 53 3 Red countries underperform 25 Greece 26,491 11,3 13 12 51 Luxembourg 10,625 0,51 47 4 26 Iceland 26,232 0,32 49 23 52 Malta 10,551 0,42 48 4 53 Liechtenstein 8,325 0,04 52 1
  • 2. Best countries in Europe in creating U-21 talent 2007-2011 compared to population are therefore as follows: 1 Wales 27 21 Slovenia 4-5 41 Russia 6 2 Iceland 23 22 San Marino 3 42 Norway 6 3 Serbia 17 23 Austria 3 43 Belgium 7 4 Sweden 14 24 Finland 1-2 44-45 Ukraine 7 5 Montenegro 13 25 Italy 1 44-45 Germany 7 6 Northern Ireland 12 26 Cyprus 1 46 Lithuania 9 7-8 Croatia 11 27 Andorra 1 47 France 10 7-8 Switzerland 11 28 Slovakia 0-1 48 Greece 12 9 Czech Republic 10 29 Romania 0 49 Turkey 14 10-12 Netherlands 8 30 FYROM 0-1 50 Bulgaria 15 10-12 Faroe Islands 8 31 Liechtenstein 1 51 Poland 23 10-12 Armenia 8 32 Estonia 3 52 Azerbaijan 28 13 Israel 7 33 Georgia 3 53 Kazahkstan 34 14-15 Denmark 6 34 Portugal 4 14-15 Moldova 6 35 Malta 4 16-20 England 5 36 Luxembourg 4 16-20 Spain 5 37 Albania 5 16-20 Scotland 5 38 Bosnia and Herz. 5 16-20 Belarus 5 39 Rep. of Ireland 6 16-20 Latvia 5 40 Hungary 6 Black countries outperform Red countries underperform