1. 2010 Euro U-19 Championship
Summary of Selected Data
All data provided on UEFA website
Matches played: 135
Goals: 409 Scored/Conceded
Average goals per match: 3 (Or, 1.5 per team per match)
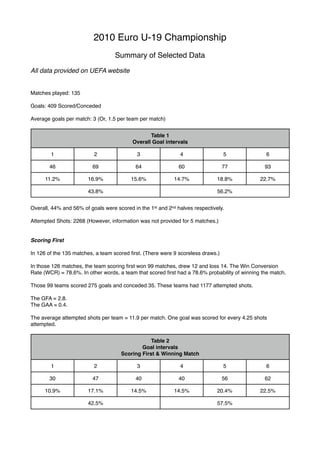
Table 1
Overall Goal intervals
1 2 3 4 5 6
46 69 64 60 77 93
11.2% 16.9% 15.6% 14.7% 18.8% 22.7%
43.8% 56.2%
Overall, 44% and 56% of goals were scored in the 1st and 2nd halves respectively.
Attempted Shots: 2268 (However, information was not provided for 5 matches.)
Scoring First
In 126 of the 135 matches, a team scored first. (There were 9 scoreless draws.)
In those 126 matches, the team scoring first won 99 matches, drew 12 and loss 14. The Win Conversion
Rate (WCR) = 78.6%. In other words, a team that scored first had a 78.6% probability of winning the match.
Those 99 teams scored 275 goals and conceded 35. These teams had 1177 attempted shots.
The GFA = 2.8.
The GAA = 0.4.
The average attempted shots per team = 11.9 per match. One goal was scored for every 4.25 shots
attempted.
Table 2
Goal intervals
Scoring First & Winning Match
1 2 3 4 5 6
30 47 40 40 56 62
10.9% 17.1% 14.5% 14.5% 20.4% 22.5%
42.5% 57.5%
2. Table 2 shows the 6-15ʼ intervals in which the 275 goals were scored by the 99 teams which scored first and
won the match.
Winning at Half-Time
In 82 of the 126 matches, a team was winning at half-time. 74 of those teams won the match. In the
remaining 8 matches, there were 4 draws and 4 losses. The WCR = 90.2%. That is, teams winning at HT
had a 90.2% probability of winning the match.
The 74 winning teams scored 239 goals, conceded 33 and had 892 attempted shots.
The GFA = 3.2
The GAA = 0.4
The average attempted shots per team = 12.1. One goal was scored for 3.7 attempted shots.
Table 3
Goal intervals
Winning at HT & Winning Match
1 2 3 4 5 6
31 49 42 28 40 49
13.0% 20.5% 17.6% 11.7% 16.7% 20.5%
51.05% 48.95%
Observe the significant shift in percentage of goals scored in each half compared to Tables 1 and 2.
Win Probability vis-a-vis Goals Scored
Table 4
Win Probability
0 Goals 1 Goal 2 Goals 3 Goals 4 Goals 5+ Goals
D L W D L W D L W D L W D L W D L
12 70 24 24 35 30 2 9 26 2 1 20 0 0 15 0 0
82 83 41 29 20 15
Probability of Winning (Draw for 0 Goals)
15% 29% 73% 90% 100% 100%
Of the 135 matches played, 24 resulted in 1-0 results. Not an uncommon result on many a Saturday
afternoon. However, the probability of winning in the EURO U-19 tournament from scoring 1 goal was 29%.
Many teams strive for 2 goals and that 2nd goal significantly increases a teamʼs chance of winning from 29%
to 73%. But so does scoring 3 goals. Teams that scored 3 goals per match in the EURO U-19 tournament
won 90% of their matches.
3. (This finding is similar to that gained from EURO U-17, the 2009-10 Champions League and the FIFA 2010
World Cup. The data from these competitions will be collated and summarized at a later date.)
Two Goals by HT
Thirty-nine teams scored a minimum of two goals by half-time and went on to win the match. Two other
teams in a 3-3 draw both scored two goals by half-time and are included in the data in this section.
The 41 teams scored 161 goals for an average of 3.9 goals/match. They conceded, on average 0.8 goals/
match.
Table 5
Goal intervals
Winning Teams Scoring 2 or More Goals by HT
1 2 3 4 5 6
23 46 25 16 23 28
14.3% 28.6% 15.5% 9.9% 14.3% 17.4%
58.4% 41.6%
The percentages for the 1st and 2nd Halves in Table 5 are almost a mirror image with those in Table 1.
The objective of a football match is to WIN! The data from the UEFA U-19 tournament, and others, suggests
that scoring three goals sharply increases the probability of winning.
Scoring the first goal of the match and winning at HT are also strong indicators for a winning result. It also
seems that an ʻattacking mentalityʼ, derived from a ʻplaying-to-winʼ attitude, from the opening KO plays an
important role in securing the first goal of the match and a lead at HT. Supplementing an early lead with a
second goal before HT almost guarantees a winning result.