Database Performance of Intel Cache Acceleration Software
•
1 like•1,523 views

When compared to the no-cache solution results, the Intel solution increased database performance in our tests by up to 65 percent using a real-world database workload. Additionally, the Intel solution provided 7 percent greater database performance when compared to the competing solution. This means that with the Intel solution, administrators can give their databases an extra boost to improve performance for end users, especially when RAM upgrades and additional storage are no longer feasible options.

Recommended
Recommended
More Related Content
What's hot
What's hot (20)
Similar to Database Performance of Intel Cache Acceleration Software
Similar to Database Performance of Intel Cache Acceleration Software (20)
More from Principled Technologies
More from Principled Technologies (20)
Recently uploaded
Recently uploaded (20)
Database Performance of Intel Cache Acceleration Software
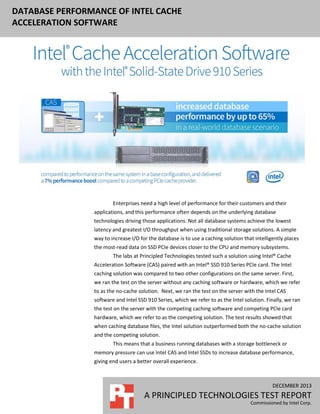
- 1. DATABASE PERFORMANCE OF INTEL CACHE ACCELERATION SOFTWARE Enterprises need a high level of performance for their customers and their applications, and this performance often depends on the underlying database technologies driving those applications. Not all database systems achieve the lowest latency and greatest I/O throughput when using traditional storage solutions. A simple way to increase I/O for the database is to use a caching solution that intelligently places the most-read data on SSD PCIe devices closer to the CPU and memory subsystems. The labs at Principled Technologies tested such a solution using Intel® Cache Acceleration Software (CAS) paired with an Intel® SSD 910 Series PCIe card. The Intel caching solution was compared to two other configurations on the same server. First, we ran the test on the server without any caching software or hardware, which we refer to as the no-cache solution. Next, we ran the test on the server with the Intel CAS software and Intel SSD 910 Series, which we refer to as the Intel solution. Finally, we ran the test on the server with the competing caching software and competing PCIe card hardware, which we refer to as the competing solution. The test results showed that when caching database files, the Intel solution outperformed both the no-cache solution and the competing solution. This means that a business running databases with a storage bottleneck or memory pressure can use Intel CAS and Intel SSDs to increase database performance, giving end users a better overall experience. DECEMBER 2013 A PRINCIPLED TECHNOLOGIES TEST REPORT Commissioned by Intel Corp.
- 2. OVERVIEW OF DATABASE TESTING First, the database workload using the no-cache solution was tested on the server. Then we tested the database workload using the Intel solution. Finally, we replaced the Intel solution with the competing solution and tested the configuration using the same workload parameters. We define each scenario in more detail below. We used the same server hardware when testing all three scenarios. We ran three hardware and software combinations with a TPC-E-like workload to simulate a realistic database solution. “No-cache” solution - First we ran a TPC-E-like database workload with a no-cache solution (no caching device or caching software). Intel solution - Next, we ran a TPC-E-like database workload with the Intel solution (Intel CAS and Intel SSD 910 Series). When running with the Intel solution, we configured the caching solution to pin the database file of the targeted database to cache. Competing solution - Finally, we ran a TPC-E-like database workload with the competing solution (competing PCIe cache device and competing cache software). When running with the competing solution, we configured the solution to cache the same database file. In the following sections, we present the results of our testing. For more information on the database benchmark and the Intel cache solution used for this report, see the section What We Tested. For additional information on how we tested the database workload, see Appendix B. For detailed information on the hardware used for testing, see Appendix C. WHAT WE FOUND: DATABASE TESTING In each test, a 60GB database was used and the tests were run with 20 virtual users. These parameters created a moderate load on the server without saturating the CPU and the network. Benchmark Factory reports in transactions per second (TPS) handled by the database application. With TPS, we can see per-second performance over the course of the test period. In this section, we present results in TPS and the overall TPS average over the course of a 90-minute test window. The two cache configurations had different workload profiles, so for fairness of comparison we collected 90 minutes of data for each solution, using the earliest peak TPS performance as our data collection starting point for each solution. Database Performance of Intel Cache Acceleration Software A Principled Technologies test report 2
- 3. No-cache solution First, a no-cache test was run with no caching software or hardware installed. We created an operating system image with Microsoft® Windows Server® 2008 R2 and SQL Server 2008 R2 SP2. In subsequent tests, we used the same clean image for the Intel solution and competing solution to ensure that all the operating system and SQL settings were identical. After a 90-minute test measurement period, the no-cache solution averaged 485 TPS and CPU averaged 43 percent utilization. Transactions per second, no-cache solution 800 700 600 500 TPS Figure 1: TPS for the nocache solution over a 90-minute period. 400 300 200 100 0 1 500 1,000 1,500 2,000 2,500 3,000 3,500 4,000 4,500 5,000 Seconds Intel Solution - Intel CAS with Intel SSD 910 Series After the no-cache test, we installed and configured Intel CAS and installed the Intel SSD 910 Series in the server, to test the Intel solution. We formatted the Intel SSD as a striped four-disk NTFS volume using Windows Disk Management. We then configured Intel CAS to use this volume for read-only caching and pinned our database file for caching. By default, one-level caching is enabled and, according to current Intel documentation, should stay enabled for best performance when caching SQL Server data files. After a 90-minute test, the Intel solution averaged 786 TPS and CPU utilization averaged 42 percent, an increase of 62 percent over the no-cache solution (see Figure 2). Database Performance of Intel Cache Acceleration Software A Principled Technologies test report 3
- 4. Transactions per second, Intel solution one-level cache 1,200 1,000 800 TPS Figure 2: TPS for Intel solution onelevel cache over a 90minute period. 600 400 200 0 1 500 1,000 1,500 2,000 2,500 3,000 3,500 4,000 4,500 5,000 Seconds Competing solution – Competing software with competing PCIe device For our final scenario, the competing solution, we configured the server using competing caching software and a PCIe SSD device from a competing provider. Prior to configuring the caching solution, we reverted the system to our clean baseline image to ensure that both caching solutions started with the same operating system settings. After a 90-minute test, the competing solution averaged 746 TPS and CPU utilization averaged 43 percent. Thus, the Intel solution, with 800 TPS, achieved 7 percent greater TPS than the competing solution, which averaged just 746 TPS over the 90-minute test period. Database Performance of Intel Cache Acceleration Software A Principled Technologies test report 4
- 5. Transactions per second - competing solution 1,200 1,000 800 TPS Figure 3: TPS for the competing solution over a 90-minute period. 600 400 200 0 1 500 1,000 1,500 2,000 2,500 3,000 3,500 4,000 4,500 5,000 Seconds WHAT WE TESTED About Intel Cache Acceleration Software Intel Cache Acceleration Software offloads “hot” I/O from primary storage to local high-performance media, allowing faster access to the data most frequently used. On the first read, data is retrieved from primary storage and copied to the Intel Cache Acceleration Software cache. Next, a second read promotes data to system memory and subsequent reads are returned at high-performance RAM or SSD/Flash speed. All writes are written synchronously to both the primary storage and the cache. Only the active parts of files are cached, and the newly identified active data evicts stale data by utilizing a proprietary eviction algorithm once the cache is full. For more information, see www.intel.com/content/www/us/en/software/intelcache-acceleration-software.html. About Intel Solid-State Drive 910 Series The Intel Solid-State Drive 910 Series brings storage performance to the server CPU through the PCIe bus, with up to 2 gigabytes per second (GB/s) sequential read and 1.5 GB/s sequential write bandwidth. The Intel SSD 910 Series combines rugged 25nanometer Intel NAND Flash Memory with innovative SSD management techniques. For more information, see www.intel.com/content/www/us/en/solid-statedrives/solid-state-drives-910-series.html. Database Performance of Intel Cache Acceleration Software A Principled Technologies test report 5
- 6. About Benchmark Factory for Databases To measure database performance, we used the Benchmark Factory for Databases tool, which lets you conduct database workload replay, industry-standard benchmark testing, and scalability testing. It enables you to deploy changes to your database environment with confidence by reducing the risks associated with patches, upgrades, migrations, and adjustments to configurations. We used an OLTP database test in Benchmark Factory to run a TPC-E-like workload, and tuned the workload to drive for maximum performance from each solution. Our Benchmark Factory for Databases workload consisted of a TPC-E, scale 7, 60GB database. We set a pre-sampling length of five minutes and a sampling length of one-and-a-half hours. For more information on Benchmark Factory, visit www.quest.com/benchmarkfactory/. IN CONCLUSION When compared to the no-cache solution results, the Intel solution increased database performance in our tests by up to 65 percent using a real-world database workload. Additionally, the Intel solution provided 7 percent greater database performance when compared to the competing solution. This means that with the Intel solution, administrators can give their databases an extra boost to improve performance for end users, especially when RAM upgrades and additional storage are no longer feasible options. Database Performance of Intel Cache Acceleration Software A Principled Technologies test report 6
- 7. APPENDIX A – ADDITIONAL TESTING WITH IOMETER In addition to the database tests, we used the Iometer utility to test six hardware and software combinations. Note that the hardware and software combinations are different from those used in the database testing. Additionally, the Iometer workload and the TPC-E-like database workload are not directly comparable, as they used different toolsets and the IO pattern between the two are different. Below is a summary of the Iometer scenarios we tested. 1. “No-cache” solution - We ran an Iometer workload with a no-cache solution (no caching device or caching software). 2. Intel solution (non-cache OS volume) – We ran an Iometer workload with the Intel CAS software and the Intel SSD 910 Series, using the hardware as a raw block device. 3. Intel solution (caching) – We ran an Iometer workload with the Intel CAS software and the Intel SSD 910 Series, using the solution as a cache. 4. Mixed solution (caching) – We ran an Iometer workload with the Intel CAS software and the competing PCIe device, using the solution as a cache. 5. Competing solution (non-cache OS volume) – We ran an Iometer workload with the competing software and the competing PCIe device, using the solution as a raw block device. 6. Competing solution (caching) – We ran an Iometer workload with the competing software and the competing PCIe device, using the solution as a cache. Iometer measures input/output (I/O) on single and clustered systems. Iometer performs I/O operations on a system in order to stress the system, and then records the performance of and system stress created by these I/O operations. Iometer can create and measure workloads on a single system or on networked systems. We used Iometer to simulate an OLTP workload at the 8KB block size and 100 percent random read. For more details about Iometer, see http://sourceforge.net/projects/iometer/. For each scenario, we configured Iometer with the following settings: One worker 10GB maximum disk size 100 percent random reads 8KB transfer request size Align I/Os on 8KB 60 one-minute tests For the raw device tests, we used Windows Disk Management to initialize and format the SSD devices. We then selected the volume as the Iometer worker target. For the caching-enabled and baseline runs, we selected the data volume as the worker target and configured each caching software solution to cache the data volume. Figure 4 summarizes our results for all scenarios. Database Performance of Intel Cache Acceleration Software A Principled Technologies test report 7
- 8. Iometer 8K 100% Random Read 140,000 120,000 Intel solution (caching) Mixed solution (caching) 100,000 Intel solution (non-cache OS volume) IOPS 80,000 60,000 Competing solution (caching) 40,000 Competing solution (noncache OS volume) 20,000 No-cache solution 0 1 3 5 7 9 11 13 15 17 19 21 23 25 27 29 31 33 35 37 39 41 43 45 47 49 51 53 55 57 59 Minutes Figure 4: IOPS for six Iometer scenarios every minute over a one-hour period. Using Iometer, the Intel solution (caching) outperformed the no-cache solution by nearly 40 times the IOPS, while also achieving a 59 percent increase in iops over the competing solution (caching) (see Figure 5). Database Performance of Intel Cache Acceleration Software A Principled Technologies test report 8
- 9. Iometer one-hour average IOPs 140,000 120,000 No-cache solution 100,000 Intel solution (caching) IOPS 80,000 Mixed solution (caching) 60,000 Competing solution (caching) 40,000 20,000 3,027 118,630 118,832 74,665 - Figure 5: Iometer average for no-cache solution, Intel solution (caching), Mixed solution (caching), and Competing solution (caching). Database Performance of Intel Cache Acceleration Software A Principled Technologies test report 9
- 10. APPENDIX B – TESTING AND SETUP DETAILS Test bed overview For our tests, we used a Dell® PowerEdge™ R720 with 32 GB of RAM and two Intel Xeon® E5-2680 processors. For our private network, we cabled two of the onboard NICs from the R720 to a Dell PowerConnect™ 5448 switch and connected our controller system running our Benchmark Factory client to the same switch. For our onboard storage, we used eight 146GB 15K SAS hard drives and split them into three RAID groups for the following: One RAID 1 pair for OS image with Intel CAS installed and SQL log files One RAID 1 pair for OS image with installed caching software from a competing competitor and SQL log files A four-disk RAID 10 for our database files We used the Dell PERC utility to modify which volumes we used to boot. Between each test configuration, we powered down the server and installed the proper SSD card into the system. To ensure that the systems were configured the same for each product test, we left the system BIOS settings at default and installed each card into the same PCIe slot each time we switched caching platforms. Below, we outline the steps we took for the rest of the OS setup and software installs. Competing cache solution The competing cache solution we used did not allow publication of the results; therefore, we do not disclose the specifics of the solution or hardware. Where possible, we took every measure to ensure fairness between the two platforms. Detailed test setup We installed a fresh copy of Windows Server 2008 R2 Enterprise Edition on the server. Windows Server 2008 R2 Enterprise Edition and SQL Server 2008 R2 Installing Windows Server 2008 R2 Enterprise Edition 1. Boot the server, and insert the Windows Server 2008 R2 installation DVD in the DVD-ROM drive. 2. At the Language Selection Screen, click Next. 3. Click Install Now. 4. Select Windows Server 2008 R2 Enterprise (Full Installation), and click Next. 5. Click the I accept the license terms check box, and click Next. 6. Click Custom. 7. Click Drive options (advanced). 8. Ensure you select the proper drive, and click New. 9. Click Apply. 10. Click Next. 11. At the User’s password must be changed before logging on warning screen, click OK. 12. Type Password1 as the new password in both fields, and click the arrow to continue. Database Performance of Intel Cache Acceleration Software A Principled Technologies test report 10
- 11. 13. At the Your password has been changed screen, click OK. Installing system updates in Windows Server 2008 R2 We installed all available updates on each server using the Windows Update feature. Installing SQL Server 2008 R2 on the server 1. Insert the installation DVD for SQL Server 2008 R2 (X64) into the DVD drive. 2. If auto play does not begin the installation, navigate to the SQL Server 2008 R2 DVD, and double-click. 3. If a .NET installation prompt appears, click Yes to enable the .NET Framework Core role. 4. At the SQL Server Installation Center screen, click Installation. 5. Click New installation or add features to an existing installation. 6. At the Setup Support Rules screen, click OK. 7. At the Product Key screen, specify the free Enterprise edition evaluation, and click Next. 8. At the License Terms screen, accept the license terms, and click Next. 9. At the Setup Support Files screen, click Install. 10. At the Setup Support Rules screen, click Next. 11. At the Setup Role screen, choose SQL Server Feature Installation, and click Next. 12. At the SQL Server 2008 R2 Feature Selection screen, select the following features: Database Engine Services, Full-Text Search, Client Tools Connectivity, Client Tools Backwards Compatibility, Management Tools – Basic, Management Tools – Complete, and click Next. 13. At the Installation Rules screen, click Next. 14. At the Instance Configuration screen, leave the defaults, and click Next. 15. At the Disk Space Requirements screen, click Next. 16. At the Server Configuration screen, choose the service account, fill in a password if necessary, and click Next. 17. At the Database Engine Configuration screen, select Mixed Mode, fill in a password for the system administrator (sa) account, click Add Current User, and click Next. 18. At the Error Reporting screen, click Next. 19. At the Installation Configuration Rules screen, click Next. 20. At the Installation screen, click Install. 21. At the Complete screen, click Close. 22. Install service pack 2. 23. Run Windows Updates. Intel CAS Installing and Configuring Intel CAS (Intel OS image only) For our testing, we installed and configured Intel CAS version 2.5.0.9043. 1. Run the IntelCacheAccelerationSoftware_x64_09043-2010.exe. 2. Once the installer loads, click Next. Database Performance of Intel Cache Acceleration Software A Principled Technologies test report 11
- 12. 3. Accept the license agreement, and click Next. 4. Leave the default install location, and click Next. 5. If the cache card is installed and already formatted as a Windows volume, click the Configure Cache Volume box, select the proper Windows volume, and click Next. Otherwise, click Next. 6. Click Install. 7. Once the installation is complete, click Finish. 8. Open the Intel CAS dashboard. 9. Ensure that the proper cache drive is selected. 10. Under Cache List, click Include. 11. Type in the desired folder or file location to be cached. In our testing, we cached our entire data drive by entering >F:dataBMF.mdf. 12. Click OK. 13. Click Apply. 14. Restart the Intel CAS service. Setting up the benchmark We used a client server running Windows Server 2008 R2 and installed SQL Server 2008 R2 Management tools and Benchmark Factory for Databases. Creating a database on the server under test 1. On the server under test, launch Microsoft SQL Server Management Studio. 2. Log into the default instance using the appropriate credentials. 3. Right-click Databases, and select New Database. 4. Enter BMF for the database name. 5. Set the Initial Size of the data file to 20,480 MB, and the log file size to 10,240 MB. Place the data file on the data volume and the log file at C:log. 6. To begin the database creation, click OK. Installing Benchmark Factory for Databases 6.9.1 1. Navigate to the Benchmark Factory for Databases 6.9.1 installation media and launch the installer. 2. At the first screen of the install wizard, click Next. 3. At the License Agreement screen, accept the license terms, and click Next. 4. At the Destination Folder screen, select an installation path, and click Next. 5. At the Ready to Install the Program screen, click Install. 6. After the wizard completes, click Finish. Configuring Benchmark Factory for Databases 6.9.1 1. In Windows, launch Benchmark Factory for Databases. 2. If the User Experience Feedback window pops up, select the No, thank you radio button and click OK. 3. When the Load Scenario Wizard screen pops up, click Next. Database Performance of Intel Cache Acceleration Software A Principled Technologies test report 12
- 13. 4. At the Select Load Scenario screen, select Industry standard benchmarks (TPC-C, TPC-E, TPC-H…), and click Next. 5. At the Select Benchmark screen, select TPC-E, and click Next. 6. At the Select Profile screen, click New. 7. At the Welcome screen, click Next. 8. At the Driver Selection screen, select Microsoft SQL Server (ODBC) from the drop-down menu, and click Next. 9. At the Connection Information screen, click Add DSN. 10. Select System Data Source, and click Next. 11. Select SQL Server Native Client 10.0, and click Next. 12. Click Finish. 13. Type Test for the file data source name. 14. For Which SQL Server do you want to connect to?, enter the IP address of the database and click Next. 15. For How should SQL Server verify the authenticity of the login ID? Select With SQL Server authentication using a login ID and password entered by the user, enter the username and password, and click Next. 16. At the next screen, check the Change the default database to checkbox and select BMF from the drop-down menu. Click Next. 17. Click Finish. 18. Click Test Data Source… 19. Click OK. 20. Click OK. 21. Select Test from the drop-down menu for the Data Source Name. Enter the login ID and password specified earlier, and click Next. 22. Enter a Profile Name, and click Next. 23. Click Finish. 24. At the Select Profile screen, click Next. 25. At the Benchmark Scale screen, change Benchmark Scale to 7 and click Next. 26. At the Measurement Intervals screen, click Delete All to remove the default selected user loads, enter 20 under Add Single User Load, and click Add. Click Next. 27. At the Select new job to screen, select Create new Benchmark Factory Job, and click Next. 28. At the end of the Load Scenario Wizard, click Finish. 29. Right-click the newly created job, and click Copy. 30. Click the Paste button above the list of jobs. You should see identical copies of the newly created job. Rename the first to TPC-E Job – Create, and the second to TPC-E Job – Test. 31. On TPC-E Job – Create, right-click TPC-E Transaction Mix, and click Remove. Click Yes to confirm. 32. On TPC-E Job – Test, right-click Create Objects for TPC-E, and click Remove. Click Yes to confirm. 33. Right-click TPC-E Job – Create, and click Run Job. 34. Once Benchmark Factory completes the TPC-E database creation, logon to the server under test and run a full database backup in SQL Server. Running the benchmark Database Performance of Intel Cache Acceleration Software A Principled Technologies test report 13
- 14. 35. We used the following steps to run each Benchmark Factory test run. 1. On the server under test, drop the old TPC-E database. 2. Restore the TPC-E database from the backup file created in the previous steps. 3. Once the restore is complete, reboot the server under test. 4. Once the server under test completes the reboot, prepare any desired Performance Monitor counters. 5. Ensure that the caching software is caching the proper database files. 6. Start the Performance Monitor counters. 7. On the Benchmark Factory client, select the TPC-E Job –Test profile, and click Run Job. 8. Once the test completes, stop the performance counters, and collect all the necessary test data from the server under test and the Benchmark Factory client. 9. Prepare the server under test for the next test configuration. Iometer testing Installing and configuring Iometer 1. Download the Iometer 2006.07.27 package for Windows from www.iometer.org/doc/downloads.html. 2. Copy the file to the server under test. 3. Double-click the installer, and click Run. 4. At the Welcome window, click Next. 5. At the License Agreement window, click I Agree. 6. At the Choose Components window, leave the defaults selected, and click Next. 7. At the Choose Install Location window, change the Destination Folder to C:Iometer 2006.07.27, and click Install. 8. When the installation completes, click Finish. Setting up the Iometer workload We used the following settings for each test: 1. Open Iometer.exe. 2. For the access specification: a. Create the access specification to match the configurations in Figure 6. Access specification name and block size % read 8K 100% Random Reads 100 % write 0 % random % sequential 100 0 Figure 6: Access specification details for our Iometer tests. b. Verify that the access specification has the following additional settings: i. Under Transfer Request Size, enter 8KB ii. Under Burstiness, set Transfer Delay to 0ms, and set Burst Length to one I/O. iii. Under Align I/Os, select 8KB. iv. Under Reply Size, select No Reply. Database Performance of Intel Cache Acceleration Software A Principled Technologies test report 14
- 15. c. To get a gradual view of the cache performance, we added 60 tests of these specifications to the Assigned Access Specifications. With one-minute runs, we were able to graph performance every one minute for one hour. d. Under Topology, select the computer name, and click the Start a New Disk Worker on Selected Manager button and assign the worker the desired target volume (either the external database LUN or the raw SSD device under test). e. Under Disk Targets, set the number of Outstanding I/Os to 256. f. Set the Maximum disk size to 20,971,520 sectors (10GB). g. Under Results Display, make sure that Iometer has selected Start of Test. h. Under Test Setup, set the Run Time to one minute. i. Save the configuration. 3. Exit Iometer. Running the Iometer tests 1. Reboot the system. 2. After logging in, double-click the saved Iometer icf configuration file. 3. Ensure that Iometer is set to the desired target and specifications. 4. Start the workload, and allow time for Iometer to create the test file and for each cache solution to fully cache the Iometer file. 5. Stop the workload. 6. Start collecting performance monitor data. 7. Start the Iometer workload. 8. After all access specifications finish running, remove the result file and performance monitor data from the server. 9. Repeat steps for each of the scenarios mentioned in the main body of the report. Database Performance of Intel Cache Acceleration Software A Principled Technologies test report 15
- 16. APPENDIX C – SYSTEM CONFIGURATION INFORMATION Figure 7 provides detailed configuration information for the test systems. System Power supplies Total number Vendor and model number Wattage of each (W) Cooling fans Total number Vendor and model number Dimensions (h x w) of each Volts Amps General Number of processor packages Number of cores per processor Number of hardware threads per core System power management policy CPU Vendor Name Model number Stepping Socket type Core frequency (GHz) Bus frequency L1 cache L2 cache L3 cache Platform Vendor and model number Motherboard model number BIOS name and version BIOS settings Memory module(s) Total RAM in system (GB) Vendor and model number Type Speed (MHz) Speed running in the system (MHz) Timing/Latency (tCL-tRCD-tRP-tRASmin) Size (GB) Number of RAM module(s) Chip organization Dell PowerEdge R720 2 Dell E1100E-S0 1100 6 AVC DBTC0638B2U 2.5" x 2.5" 12 1.2 2 8 2 Balanced Intel Xeon E5-2680 C1 FCLGA2011 2.70 8 GT/s 32 KB + 32 KB (per core) 256 KB (per core) 20 MB Dell PowerEdge R720 0M1GCR Dell 1.6.0 (03/07/2013) Defaults 32 Hynix HMT31GR7BFR4C-PB D3 AC PC3-12800R 1,600 1,600 11-11-11-30 8 4 Dual-sided Database Performance of Intel Cache Acceleration Software A Principled Technologies test report 16
- 17. System Rank Operating system Name Build number File system Kernel Language Graphics Vendor and model number Graphics memory (MB) Driver RAID controller Vendor and model number Firmware version Driver version Cache size (MB) Hard drives Vendor and model number Number of drives Size (GB) RPM Type Intel flash card Vendor and model number Firmware version Driver version SSD size Ethernet adapters Vendor and model number Type Driver Optical drive(s) Vendor and model number Type USB ports Number Type Dell PowerEdge R720 Dual Windows Server 2008 R2 Enterprise SP1 7601 NTFS ACPI x64-based PC English Matrox® G200eR 8 Matrox Graphics Inc. 2.4.1.0 (09/08/2011) PERC H710P Mini 3.130.05-2086 DELL 6.801.5.0 (07/31/2013) 1 GB Seagate® ST9146852SS 8 146 15,000 SAS Intel SSD 910 Series 800GB PCIe card 1200D006A424 Microsoft 6.1.7600.16385 (06/21/2006) 800 GB Intel Gigabit 4P I350 rNDC Integrated Intel 12.7.28.0 (05/13/2013) TEAC DV-28SW DVD-ROM 5 2.0 Figure 7: Detailed configuration information for the test systems. Database Performance of Intel Cache Acceleration Software A Principled Technologies test report 17
- 18. ABOUT PRINCIPLED TECHNOLOGIES Principled Technologies, Inc. 1007 Slater Road, Suite 300 Durham, NC, 27703 www.principledtechnologies.com We provide industry-leading technology assessment and fact-based marketing services. We bring to every assignment extensive experience with and expertise in all aspects of technology testing and analysis, from researching new technologies, to developing new methodologies, to testing with existing and new tools. When the assessment is complete, we know how to present the results to a broad range of target audiences. We provide our clients with the materials they need, from market-focused data to use in their own collateral to custom sales aids, such as test reports, performance assessments, and white papers. Every document reflects the results of our trusted independent analysis. We provide customized services that focus on our clients’ individual requirements. Whether the technology involves hardware, software, Web sites, or services, we offer the experience, expertise, and tools to help our clients assess how it will fare against its competition, its performance, its market readiness, and its quality and reliability. Our founders, Mark L. Van Name and Bill Catchings, have worked together in technology assessment for over 20 years. As journalists, they published over a thousand articles on a wide array of technology subjects. They created and led the Ziff-Davis Benchmark Operation, which developed such industry-standard benchmarks as Ziff Davis Media’s Winstone and WebBench. They founded and led eTesting Labs, and after the acquisition of that company by Lionbridge Technologies were the head and CTO of VeriTest. Principled Technologies is a registered trademark of Principled Technologies, Inc. All other product names are the trademarks of their respective owners. Disclaimer of Warranties; Limitation of Liability: PRINCIPLED TECHNOLOGIES, INC. HAS MADE REASONABLE EFFORTS TO ENSURE THE ACCURACY AND VALIDITY OF ITS TESTING, HOWEVER, PRINCIPLED TECHNOLOGIES, INC. SPECIFICALLY DISCLAIMS ANY WARRANTY, EXPRESSED OR IMPLIED, RELATING TO THE TEST RESULTS AND ANALYSIS, THEIR ACCURACY, COMPLETENESS OR QUALITY, INCLUDING ANY IMPLIED WARRANTY OF FITNESS FOR ANY PARTICULAR PURPOSE. ALL PERSONS OR ENTITIES RELYING ON THE RESULTS OF ANY TESTING DO SO AT THEIR OWN RISK, AND AGREE THAT PRINCIPLED TECHNOLOGIES, INC., ITS EMPLOYEES AND ITS SUBCONTRACTORS SHALL HAVE NO LIABILITY WHATSOEVER FROM ANY CLAIM OF LOSS OR DAMAGE ON ACCOUNT OF ANY ALLEGED ERROR OR DEFECT IN ANY TESTING PROCEDURE OR RESULT. IN NO EVENT SHALL PRINCIPLED TECHNOLOGIES, INC. BE LIABLE FOR INDIRECT, SPECIAL, INCIDENTAL, OR CONSEQUENTIAL DAMAGES IN CONNECTION WITH ITS TESTING, EVEN IF ADVISED OF THE POSSIBILITY OF SUCH DAMAGES. IN NO EVENT SHALL PRINCIPLED TECHNOLOGIES, INC.’S LIABILITY, INCLUDING FOR DIRECT DAMAGES, EXCEED THE AMOUNTS PAID IN CONNECTION WITH PRINCIPLED TECHNOLOGIES, INC.’S TESTING. CUSTOMER’S SOLE AND EXCLUSIVE REMEDIES ARE AS SET FORTH HEREIN. Database Performance of Intel Cache Acceleration Software A Principled Technologies test report 18