SlideShare a Scribd company logo
1 of 6
Download to read offline
GMG Defensive Beta Overall Morningstar RtgTM
Morningstar Cat Standard Index Incept
(131) Multialternative (MF) S&P 500 08-14-09
Morningstar Analyst RtgTM
Total Assets Category Index Type
__ $23.9 mil Barclays Aggregate Bond MF
Performance 06-30-2013
Quarterly Returns 1st Qtr 2nd Qtr 3rd Qtr 4th Qtr Total %
2011 4.37 -1.39 -13.70 7.45 -4.57
2012 11.07 -3.99 5.14 -1.72 10.20
2013 5.68 -0.58 __ __ 5.07
Trailing Returns 1 Yr 3 Yr 5 Yr 10 Yr Incept
Load-adj Mthly 8.57 9.65 __ __ 5.14
Std 06-30-2013 8.57 __ __ __ 5.14
Total Return 8.57 9.65 __ __ 5.14.................................................................................................
+/- Std Index -12.03 -8.80 __ __ __
+/- Cat Index 9.26 6.14 __ __ __
.................................................................................................
% Rank Cat 13 3 __ __ __
.................................................................................................
No. in Cat 234 131 67 5 __
7-day Yield __
.................................................................................................
Performance Disclosure
The Overall Morningstar Rating is based on risk-adjusted
returns, derived from a weighted average of the three-,
five-, and ten-year (if applicable) Morningstar metrics.
The performance data quoted represents past performance
and does not guarantee future results. The investment
return and principal value of an investment will fluctuate
thus an investor's shares, when redeemed, may be worth
more or less than their original cost.
Current performance may be lower or higher than return
data quoted herein. For performance data current to the most
recent month-end, please call 877-464-3111 or visit
www.thebetafund.com.
Fees and Expenses
Sales Charges
Front-End Load %
Deferred Load %
NA
NA
Fund Expenses
Management Fees %
12b1 Expense %
Prospectus Gross Exp Ratio %
1.00
0.25
2.40
Risk and Return Profile
3 Yr 5 Yr 10 Yr
131 funds 67 funds 5 funds
MorningstarRatingTM
5 __ __
Morningstar Risk High __ __
Morningstar Return High __ __
3 Yr 5 Yr 10 Yr
Standard Deviation 12.64 __ __
Mean 9.65 __ __
Sharpe Ratio 0.79 __ __
MPT Statistics Standard Index Best Fit Index
Mstar Lifetime Mod 2035
Alpha -5.93 -2.89
Beta 0.89 0.90
R-Squared 91.19 93.59
12-Month Yield __
30-day SEC Yield __
Potential Cap Gains Exp 15.00% Assets
Operations
Family: GMG Objective: Growth Minimum IRA Purchase: $0
Manager: Krivicich/Pursche/Goldberg/KerstingTicker: MPDAX Min Auto Investment Plan: $1,000
Tenure: 3.9 Years Minimum Intitial Purchase: $1,000 Purchase Constraints: NA
Investment Style
Equity
Stock %__ __ __ __ __ __ __ 16 85 89 91 92
.....................................................................................................................................................................................................................
.....................................................................................................................................................................................................................
.....................................................................................................................................................................................................................
.....................................................................................................................................................................................................................
.....................................................................................................................................................................................................................
.....................................................................................................................................................................................................................
.....................................................................................................................................................................................................................
4k
10k
20k
40k
60k
80k
100k
Growth of $10,000
GMG Defensive Beta
$12,143
Category Average
$11,158
Standard Index
$17,064
Performance Quartile
(within category)
History2002 2003 2004 2005 2006 2007 2008 2009 2010 2011 2012 06-13
__ __ __ __ __ __ __ 10.09 10.99 10.39 11.45 12.03
__ __ __ __ __ __ __ __ 8.92 -4.57 10.20 5.07
NAV
Total Return %
__ __ __ __ __ __ __ __ -6.14 -6.68 -5.80 -8.75
__ __ __ __ __ __ __ __ 2.38 -12.41 5.98 7.51............................................................................................................................................................................................................................................................................
__ __ __ __ __ __ __ __ 25 76 11 __
............................................................................................................................................................................................................................................................................
3 5 8 9 24 41 63 105 140 175 203 272
+/- Standard Index
+/- Category Index
% Rank Cat
No. of Funds in Cat
Portfolio Analysis 01-31-2013
Composition % Long % Short% Net %
Cash 5.0 0.0 5.0
U.S. Stocks 70.8 0.0 70.8
Non-U.S. Stocks 21.1 0.0 21.1
Bonds 2.9 0.0 3.0
Other 0.1 0.0 0.1.................................................................................................
Total 100.0 0.0 100.0
Equity Style
Value Blend Growth
SmallMidLarge
Portfolio Port Rel Rel
Statistics Avg Index Cat
P/E Ratio TTM 16.8 1.02 1.08
P/C Ratio TTM 9.9 1.00 1.11
P/B Ratio TTM 2.9 1.23 1.52
Geo Avg Mkt 66945 1.13 3.75
Cap $mil
Fixed-Income Style
Ltd Mod Ext
LowMedHigh
Avg Eff Duration __
Avg Eff Maturity __
Avg Credit Quality __
Avg Wtd Coupon 6.41
Avg Wtd Price 105.96
Credit Analysis NA Bond %
AAA __
AA __
A __
.................................................................................................................
BBB __
BB __
B __
.................................................................................................................
Below B __
NR/NA __
Regional Exposure Stocks % Rel Std Index
Americas 95.6 0.97
Greater Europe 4.4 2.59
Greater Asia 0.0 __
Share Chg Share 42 Total Stocks % Net
since Amount 0 Total Fixed-Income Assets
10-31-2012 30% Turnover Ratio
35,677
4,950
3,430
11,275
1,280
Gmg Fund Limited Spc
Visa, Inc.
International Business Machin
Express Scripts
Apple Inc
17.86
3.40
3.03
2.62
2.54..............................................................................................................................
770
6,050
2,000
6,900
10,150
Google, Inc. Class A
Exxon Mobil Corporation
Amazon.com Inc
Tupperware Brands Corporation
CVS Caremark Corp
2.53
2.37
2.31
2.29
2.26..............................................................................................................................
5,130
4,970
5,300
7,000
14,100
Caterpillar Inc
Monsanto Company
Deere & Co
Crown Castle International Co
AT&T Inc
2.20
2.19
2.17
2.15
2.14
Sector Weightings Stocks % Rel Std Index
h Cyclical 20.3 0.62
r Basic Materials 4.0 1.29
t Consumer Cyclical 9.3 0.79
y Financial Services 6.9 0.44
u Real Estate 0.2 0.09
j Sensitive 54.3 1.31
i Communication Services 8.3 2.02
o Energy 9.2 0.88
p Industrials 13.7 1.36
a Technology 23.2 1.40
k Defensive 25.4 0.97
s Consumer Defensive 13.2 1.28
d Healthcare 12.1 0.96
f Utilities 0.1 0.03
...................................................................................................................................................
...................................................................................................................................................
Page 1 of 6Release date 06-30-2013
© 2013 Morningstar, Inc. All rights reserved. The information, data, analyses and opinions contained herein (1) include the confidential and proprietary information of Morningstar, (2) may include, or be derived from, account information
provided by your financial advisor which cannot be verified by Morningstar, (3) may not be copied or redistributed, (4) do not constitute investment advice offered by Morningstar, (5) are provided solely for informational purposes and
therefore are not an offer to buy or sell a security, and (6) are not warranted to be correct, complete or accurate. Except as otherwise required by law, Morningstar shall not be responsible for any trading decisions, damages or other
losses resulting from, or related to, this information, data, analyses or opinions or their use. This report is supplemental sales literature. If applicable it must be preceded or accompanied by a prospectus, or equivalent, and disclosure statement.
Please read the prospectus carefully.
Disclosure for Standardized and Tax Adjusted Returns
The performance data quoted represents past performance and does not
guarantee future results. The investment return and principal value of an
investment will fluctuate thus an investor's shares, when redeemed, may be
worth more or less than their original cost. Current performance may be lower or
higher than return data quoted herein. For performance data current to the most
recent month-end please visit http://advisor.morningstar.com/familyinfo.asp.
An investment in a money market fund is not insured or guaranteed by the FDIC or
any other government agency. The current yield quotation more closely reflects the
current earnings of the money market fund than the total return quotation. Although
money markets seek to preserve the value of your investment at $1.00 per share, it
is possible to lose money by investing in the fund.
Standardized Returns assume reinvestment of dividends and capital gains. It
depicts performance without adjusting for the effects of taxation, but are
adjusted to reflect sales charges and ongoing fund expenses. If adjusted for
taxation, the performance quoted would be significantly reduced. For variable
annuities, additional expenses will be taken in account, including M&E risk charges,
fund-level expenses such as management fees and operating fees, and policy-level
administration fees, charges such as surrender, contract and sales charges.
After-tax returns are calculated using the highest individual federal marginal
income tax rates, and do not reflect the impact of state and local taxes. Actual
after tax returns depend on the investor's tax situation and may differ from
those shown. The after tax returns shown are not relevant to investors who
hold their fund shares through tax-deferred arrangements such as 401(k) plans
or an IRA. After-tax returns exclude the effects of either the alternative
minimum tax or phase-out of certain tax credits. Any taxes due are as of the
time the distributions are made, and the taxable amount and tax character
of each distribution is as specified by the fund on the dividend declaration
date. Due to foreign tax credits or realized capital losses, after-tax returns
may be greater than before tax returns. After-tax returns for exchange-traded
funds are based on net asset value.
Annualized returns 06-30-2013
Standardized Returns (%) 7-day
Yield
1Yr 5Yr 10Yr Since
Inception
Inception
Date
Max Front
Load %
Max Back
Load %
Net Exp
Ratio %
Gross Exp
Ratio %
GMG Defensive Beta -- 8.57 -- -- 5.14 08-14-09 NA NA 1.65 1
2.40
Standard & Poor's 500 -- 20.60 7.01 7.30 -- --
Barclay's Agg Bond Index -- -0.69 5.19 4.52 -- --
MSCI EAFE Index Ndtr_D -- 18.62 -0.63 7.67 -- --
3 Month T-Bill -- 0.09 0.20 1.69 -- --
1. Contractual waiver that expires 11/30/2013.
Returns after Taxes (%) on Distribution on Distribution and Sales of Shares
1Yr 5Yr 10Yr Since
Inception
Inception
Date
1Yr 5Yr 10Yr Since
Inception
GMG Defensive Beta 8.57 -- -- 5.06 08-14-09 4.85 -- -- 3.95
Page 2 of 6
© 2013 Morningstar, Inc. All rights reserved. The information, data, analyses and opinions contained herein (1) include the confidential and proprietary information of Morningstar, (2) may include, or be derived from, account information
provided by your financial advisor which cannot be verified by Morningstar, (3) may not be copied or redistributed, (4) do not constitute investment advice offered by Morningstar, (5) are provided solely for informational purposes and
therefore are not an offer to buy or sell a security, and (6) are not warranted to be correct, complete or accurate. Except as otherwise required by law, Morningstar shall not be responsible for any trading decisions, damages or other
losses resulting from, or related to, this information, data, analyses or opinions or their use. This report is supplemental sales literature. If applicable it must be preceded or accompanied by a prospectus, or equivalent, and disclosure statement.
Please read the prospectus carefully.
Mutual Fund Detail Report
Disclosure Statement
The Mutual Fund Detail Report is to be used as supplemental sales literature,
and therefore must be preceded or accompanied by the fund's current prospec-
tus and a disclosure statement. Please read the prospectus carefully. In all
cases, this disclosure statement should accompany the Mutual Fund Detail
Report. Portfolio information is based on the most recent information
available to Morningstar.
Morningstar Associates, LLC, a regsitered investment advisor and wholly
owned subsidiary of Morningstar, Inc., provides various institutional in-
vestment consulting services, including asset allocation advice to invest-
ment advisors who have or will be creating a fund-of-fund/asset allocation
product. However, despite the fact that such a relationship may exist, the
information displayed for those products will not be influenced as they are
objective measures and/or derived by quantitative driven formulas (i.e.,
Morningstar Rating). For more information on these Morningstar relationships,
please visit the Release Notes section of this product.
Morningstar is not a FINRA-member firm.
Pre-inception Returns
The analysis in this report may be based, in part, on adjusted historical
returns for periods prior to the fund's actual inception. These calculated
returns reflect the historical performance of the oldest share class of the
fund, adjusted to reflect the fees and expenses of this share class. These
fees and expenses are referenced in the report's Performance section.
When pre-inception data are presented in the report, the header at the
top of the report will indicate this. In addition, the pre-inception
data included in the report will appear in italics.
While the inclusion of pre-inception data provides valuable insight into
the probable long-term behavior of newer share classes of a fund, investors
should be aware that an adjusted historical return can only provide an
approximation of that behavior. For example, the fee structures between a
retail share class will vary from that of an institutional share class, as
retail shares tend to have higher operating expenses and sales charges.
These adjusted historical returns are not actual returns. Calculation
methodologies utilized by Morningstar may differ from those applied by other
entities, including the fund itself.
Performance
The performance data given represents past perfomance and should not be
considered indicative of future results. Principal value and investment return
will fluctuate, so that an investor's shares when redeemed may be worth more or
less than the original investmant. Fund portfolio statistics change over time.
The fund is not FDIC-insured, may lose value and is not guaranteed by a bank or
other financial institution.
Total return reflects performance without adjusting for sales charges or
the effects of taxation, but is adjusted to reflect all actual ongoing fund
expenses and assumes reinvestment of dividends and capital gains. If adjusted
for sales charges and the effects of taxation, the performance quoted would
be reduced.
Standardized Total Return is reflected as of month- and quarter-end time
periods. It depicts performance without adjusting for the effects of taxation,
but is adjusted for sales charges, all ongoing fund expenses, and assumes
reinvestment of dividends and capital gains. If adjusted for the effects of
taxation, the performance quoted would be reduced. The sales charge used in
the calculation was obtained from the fund's most recent prospectus and/or
shareholder report available to Morningstar. Standardized returns never
include pre-inception history.
Morningstar % Rank within Morningstar Category does not account for a fund's
sales charge (if applicable). Rankings will not be provided for periods less
than one year.
Growth of $10,000
The graph compares the growth of $10,000 in a fund with that of an index and
with that of the average for all funds in its Morningstar category. The total
returns are not adjusted to reflect sales charges or the effects of taxation,
but are adjusted to reflect actual ongoing fund expenses, and assume
reinvestment of dividends and capital gains. If adjusted, sales charges would
reduce the performance quoted. The index is an unmanaged portfolio of
specified securities and cannot be invested in directly. The index and
the category average do not reflect any initial or ongoing expenses.
A fund's portfolio may differ significantly from the securities in the index.
The index is chosen by Morningstar.
If pre-inception data is included in the analysis, it will be graphed.
Morningstar Analyst Rating
The Morningstar Analyst Rating is not a credit or risk rating. It is a subjective
evaluation performed by the mutual fund analysts of Morningstar, Inc.
Morningstar evaluates funds based on five key pillars, which are process,
performance, people, parent, and price. Morningstar's analysts use this five
pillar evaluation to identify funds they believe are more likely to outperform over
the long term on a risk-adjusted basis. Analysts consider quantitative and
qualitative factors in their research, and the weighting of each pillar may vary.
The Analyst Rating ultimately reflects the analyst's overall assessment and is
overseen by Morningstar's Analyst Rating Committee. The approach serves not
as a formula but as a framework to ensure consistency across Morningstar's
global coverage universe.
The Analyst Rating scale ranges from Gold to Negative, with Gold being the
highest rating and Negative being the lowest rating. A fund with a Gold rating
distinguishes itself across the five pillars and has garnered the analysts' highest
level of conviction. A fund with a Silver rating has notable advantages across
several, but perhaps not all, of the five pillars-strengths that give the analysts a
high level of conviction. A Bronze-rated fund has advantages that outweigh the
disadvantages across the five pillars, with sufficient level of analyst conviction
to warrant a positive rating. A fund with a Neutral rating isn't seriously flawed
across the five pillars, nor does it distinguish itself very positively. A Negative
rated fund is flawed in at least one if not more pillars and is considered an
inferior offering to its peers. Analyst Ratings are reevaluated at least every 14
months.
For more detailed information about Morningstar's Analyst Rating,
including its methodology, please go to http://corporate.morningstar.com
/us/documents/MethodologyDocuments/
AnalystRatingforFundsMethodology.pdf. The Morningstar Analyst
Rating should not be used as the sole basis in evaluating a mutual
fund. Morningstar Analyst Ratings are based on Morningstar's current
expectations about future events; therefore, in no way does Morningstar
represent ratings as a guarantee nor should they be viewed by
an investor as such. Morningstar Analyst Ratings involve unknown
risks and uncertainties which may cause Morningstar's expectations
Page 3 of 6
© 2013 Morningstar, Inc. All rights reserved. The information, data, analyses and opinions contained herein (1) include the confidential and proprietary information of Morningstar, (2) may include, or be derived from, account information
provided by your financial advisor which cannot be verified by Morningstar, (3) may not be copied or redistributed, (4) do not constitute investment advice offered by Morningstar, (5) are provided solely for informational purposes and
therefore are not an offer to buy or sell a security, and (6) are not warranted to be correct, complete or accurate. Except as otherwise required by law, Morningstar shall not be responsible for any trading decisions, damages or other
losses resulting from, or related to, this information, data, analyses or opinions or their use. This report is supplemental sales literature. If applicable it must be preceded or accompanied by a prospectus, or equivalent, and disclosure statement.
Please read the prospectus carefully.
not to occur or to differ significantly from what we expected.
Risk and Return
The Morningstar Rating is calculated for funds with at least a three-year
history. It is calculated based on a Morningstar Risk-Adjusted Return
measure that accounts for variation in a fund's monthly performance,
placing more emphasis on downward variations and rewarding consistent
performance. The top 10% of funds in each category receive 5 stars, the
next 22.5% receive 4 stars, the next 35% receive 3 stars, the next 22.5%
receive 2 stars and the bottom 10% receive 1 star. The Overall Morningstar
Rating for a mutual fund is derived from a weighted average of the
performance figures associated with its three-, five- and 10-year (if
applicable) Morningstar Rating metrics.
Please note that some Morningstar proprietary calculations, including the
Morningstar Rating, may be calculated based on adjusted historical returns
(pre-inception returns). If the extended performance rating is in effect,
the "stars" are represented as unshaded stars. For each mutual fund with
at least a three-year history, Morningstar calculates a Morningstar Rating
based on a Morningstar Risk-Adjusted Return measure that accounts for
variation in a fund's adjusted monthly performance, placing more emphasis
on downward variations and rewarding consistent performance. The top 10%
of funds in each category receive 5 stars, the next 22.5% receive 4 stars,
the next 35% receive 3 stars, the next 22.5% receive 2 stars and the bottom
10% receive 1 star. This investment's independent Morningstar Rating metric
is then compared against the open-end mutual fund universe's actual
performance breakpoints to determine its extended performance rating. The
Overall Morningstar Rating for a mutual fund is derived from a weighted
average of the actual performance figures associated with its three-, five-
and 10-year (if applicable) Morningstar Rating metrics.
Morningstar Return rates a mutual fund's performance relative to other funds
in its Morningstar Category. It is an assessment of a fund's excess return
over a risk-free rate (the return of the 90-day Treasury Bill), after
adjusting for all applicable loads and sales charges, in comparison with the
mutual funds in its Morningstar Category. In each Morningstar Category, the
top 10% of funds earn a High Morningstar Return (HIGH), the next 22.5% Above
Average (+AVG), the middle 35% Average (AVG), the next 22.5% Below Average
(-AVG), and the bottom 10% Low (LOW). Morningstar Return is measured for up
to three time periods (three-, five-, and 10 years). These separate measures
are then weighted and averaged to produce an overall measure for the mutual
fund. Funds with less than three years of performance history are not rated.
Morningstar Risk evaluates a mutual fund's downside volatility relative to
that of other funds in its Morningstar Category. It is an assessment of the
variations in a fund's monthly returns, with an emphasis on downside
variations, in comparison with the mutual funds in its Morningstar Category.
In each Morningstar Category, the 10% of funds with the lowest measured risk
are described as Low Risk (LOW), the next 22.5% Below Average (-AVG), the
middle 35% Average (AVG), the next 22.5% Above Average (+AVG), and the top
10% High (HIGH). Morningstar Risk is measured for up to three time periods
(three-, five-, and 10 years). These separate measures are then weighted and
averaged to produce an overall measure for the mutual fund. Funds with less
than three years of performance history are not rated.
If pre-inception returns are included in this analysis, the risk and return
profile data calculated on the basis of these returns will appear in italics.
Risk Measures
The risk measures below are calculated for funds with at least a three-
year history.
Standard deviation is a statistical measure of the volatility of the fund's
returns.
Mean represents the annualized geometric return for the period shown.
The Sharpe ratio uses standard deviation and excess return to determine
reward per unit of risk.
Alpha measures the difference between a fund's actual returns and its
expected performance, given its level of risk (as measured by beta).
Alpha is often seen as a measure of the value added or subtracted by
a portfolio manager.
Beta is a measure of a fund's sensitivity to market movements. A portfolio with
a beta greater than 1 is more volatile than the market, and a portfolio with a
beta less than 1 is less volatile than the market
R-squared reflects the percentage of a fund's movements that are explained
by movements in its benchmark index, showing the degree of correlation
between the fund and the benchmark. This figure is also helpful in assessing
how likely it is that alpha and beta are statistically significant.
Risk measures calculated using pre-inception data, if included in the
analysis, will be presented in italics.
Portfolio Analysis
The Morningstar Style Box reveals a fund's investment strategy. For equity
funds the vertical axis shows the market capitalization of the stocks owned
and the horizontal axis shows investment style (value, blend or growth). For
fixed-income funds the vertical axis shows the average credit quality of the
bonds owned, and the horizontal axis shows interest rate sensitivity as
measured by a bond's duration (limited, moderate or extensive).
Composition
The weighting of the portfolio in various asset classes, including
"Other," is shown in this table. "Other" includes security
types that are not neatly classified in the other asset classes, such as
convertible bonds and preferred stocks.
In the table, allocation to the classes is shown for long positions,
short positions, and net (long positions net of short) positions. These
statistics summarize what the managers are buying and how they are
positioning the portfolio. When short positions are captured in these
portfolio statistics, investors get a more robust description of the funds'
exposure and risk.
Most managed product portfolios hold fairly conventional securities, such as
long positions in stocks and bonds. Other portfolios use other investment
strategies or securities, such as short positions or derivatives, to reduce
transaction costs, enhance returns, or reduce risk. Some of these securities
and strategies behave like conventional securities, while others have unique
return and risk characteristics.
Most portfolios take long positions in securities. Long positions involve
buying the security outright and then selling it later, with the hope that
the security price rises over time. In contrast, short positions are taken to
benefit from anticipated price declines. In this type of transaction, the
investor borrows the security from another investor, sells it and receives
cash, and then is obligated to buy it back at some point in the future.
If the price falls after the short sale, the investor will have sold high
and can now buy low to close the short position and lock in a profit.
However, if the price of the security increases after the short sale,
the investor will experience losses by buying it at a higher price than
the sale price.
Page 4 of 6
© 2013 Morningstar, Inc. All rights reserved. The information, data, analyses and opinions contained herein (1) include the confidential and proprietary information of Morningstar, (2) may include, or be derived from, account information
provided by your financial advisor which cannot be verified by Morningstar, (3) may not be copied or redistributed, (4) do not constitute investment advice offered by Morningstar, (5) are provided solely for informational purposes and
therefore are not an offer to buy or sell a security, and (6) are not warranted to be correct, complete or accurate. Except as otherwise required by law, Morningstar shall not be responsible for any trading decisions, damages or other
losses resulting from, or related to, this information, data, analyses or opinions or their use. This report is supplemental sales literature. If applicable it must be preceded or accompanied by a prospectus, or equivalent, and disclosure statement.
Please read the prospectus carefully.
The strategy of selling securities short is prevalent in specialized
portfolios, such as long-short, market-neutral, bear-market, and hedge funds.
Most conventional portfolios do not typically short securities, although they
may reserve the right to do so under special circumstances. Funds may also
short derivatives, and this is sometimes more efficient than shorting individual
securities. Short positions produce negative exposure to the security that is
being shorted. This means that when the security rises in value, the short
position will fall in value and vice versa. Morningstar's portfolio statistics
will capture this negative exposure. For example, if a fund has many short stock
positions, the percent of assets in stocks in the asset allocation breakdown may
be negative. Funds must provide their broker with cash collateral for the short
position, so funds that short often have a large cash position, sometimes even
exceeding 100% cash.
Note that all other portfolio statistics presented in this report are based on the
long holdings of the fund only.
Equity Portfolio Statistics
The referenced data elements below are a weighted average of the equity
holdings in the portfolio.
The Price/Earnings ratio is a weighted average of the price/earnings
ratios of the stocks in the underlying fund's portfolio. The P/E ratio
of a stock is calculated by dividing the current price of the stock by
its trailing 12-months' earnings per share. In computing the average,
Morningstar weights each portfolio holding by the percentage of equity
assets it represents.
The Price/Cash Flow ratio is a weighted average of the price/cash-flow
ratios of the stocks in a fund's portfolio. Price/cash-flow shows the
ability of a business to generate cash and acts as a gauge of liquidity
and solvency.
The Price/Book ratio is a weighted average of the price/book ratios of
all the stocks in the underlying fund's portfolio. The P/B ratio of a
company is calculated by dividing the market price of its stock by the
company's per-share book value. Stocks with negative book values are
excluded from this calculation.
The geometric average market capitalization of a fund's equity portfolio
offers a measure of the size of the companies in which the mutual fund
invests.
Fixed-Income Portfolio Statistics
The referenced data elements below are a weighted average of the fixed
income holdings in the portfolio.
Duration is a time measure of a bond's interest rate sensitivity.
Average effective duration is a weighted average of the duration of the
underlying fixed income securities within the portfolio.
Average effective maturity is a weighted average of all the maturities
of the bonds in a portfolio, computed by weighting each maturity date by
the market value of the security.
Average credit quality is calculated by taking the weighted average of
the credit rating for each bond in the portfolio.
Average weighted coupon is generated from the fund's portfolio by
weighting the coupon of each bond by its relative size in the portfolio.
Coupons are fixed percentages paid out on a fixed-income security on an
annual basis.
Average weighted price is generated from the fund's portfolio by weighting
the price of each bond by its relative size in the portfolio. This number
reveals if the fund favors bonds selling at prices above or below face value
(premium or discount securities, respectively). A higher number indicates a
bias toward premiums. This statistic is expressed as a percentage of par
(face) value.
Turnover Ratio is a decent proxy for how frequently a manager trades his or
her portfolio. The inverse of a fund's turnover ratio is the average holding
period for a security in the fund. As turnover increases, a fund's brokerage
costs typically rise as well.
Operations
Purchase constraints denote if a mutual fund has any of the following
qualities: Qualified Access (A), Institutional (T), Closed to New
Investments, (C) or Closed to All Investments (L). Because these
qualities can all act as restrictions and/or requirements for investment,
they are grouped together.
Potential capital gains exposure is the percentage of a mutual fund's
total assets that represent capital appreciation.
Investment Risk
International Funds/Emerging Market Funds: The investor should note that
funds that invest in international securities involve special additional risks.
These risks include, but are not limited to, currency risk, political risk, and
risk associated with varying accounting standards. Investing in emerging
markets may accentuate these risks.
Sector Funds: The investor should note that funds that invest exclusively in
one sector or industry involve additional risks. The lack of industry diver-
sification subjects the investor to increased industry-specific risks.
Non-Diversified Funds: The investor should note that funds that invest more
of their assets in a single issuer involve additional risks, including share
price fluctuations, because of the increased concentration of investments.
Small-Cap Funds: The investor should note that funds that invest in stocks of
small companies involve additional risks. Smaller companies typically have a
higher risk of failure, and are not as well established as larger blue-chip
companies. Historically, smaller-company stocks have experienced a greater
degree of market volatility that the overall market average.
Mid Cap Funds: The investor should note that funds that invest in companies
with market capitalization below $10 billion involve additional risks. The
securities of these companies may be more volatile and less liquid than the
securities of larger companies.
High-Yield Bond Funds: The investor should note that funds that invest in
lower-rated debt securities (commonly referred as junk bonds) involve
additional risks because of the lower credit quality of the securities in the
portfolio. The investor should be aware of the possible higher level of
volatility, and increased risk of default.
Tax-Free Municipal Bond Funds: The investor should note that the income
from tax-free municipal bond funds may be subject to state and local
taxation and the Alternative Minimum Tax.
Page 5 of 6
© 2013 Morningstar, Inc. All rights reserved. The information, data, analyses and opinions contained herein (1) include the confidential and proprietary information of Morningstar, (2) may include, or be derived from, account information
provided by your financial advisor which cannot be verified by Morningstar, (3) may not be copied or redistributed, (4) do not constitute investment advice offered by Morningstar, (5) are provided solely for informational purposes and
therefore are not an offer to buy or sell a security, and (6) are not warranted to be correct, complete or accurate. Except as otherwise required by law, Morningstar shall not be responsible for any trading decisions, damages or other
losses resulting from, or related to, this information, data, analyses or opinions or their use. This report is supplemental sales literature. If applicable it must be preceded or accompanied by a prospectus, or equivalent, and disclosure statement.
Please read the prospectus carefully.
Benchmark Disclosure
Barclays Aggregate Bond TR
Govt/Credit Index, the Mortgage-Backed Securities Index, and the
Asset-Backed Securities Index.
Morningstar Lifetime Moderate 2035
The Morningstar Lifetime Moderate 2035 Index represents a portfolio of
global equities, bonds and traditional inflation hedges such as
commodities and TIPS. This portfolio is held in proportions
appropriate for a U.S. investor who is about 25 years away from
retirement. The Moderate risk profile is for investors who are
comfortable with average exposure to equity market volatility.
S&P 500 TR
A market capitalization-weighted index of 500 widely held stocks often
used as a proxy for the stock market.
Page 6 of 6
© 2013 Morningstar, Inc. All rights reserved. The information, data, analyses and opinions contained herein (1) include the confidential and proprietary information of Morningstar, (2) may include, or be derived from, account information
provided by your financial advisor which cannot be verified by Morningstar, (3) may not be copied or redistributed, (4) do not constitute investment advice offered by Morningstar, (5) are provided solely for informational purposes and
therefore are not an offer to buy or sell a security, and (6) are not warranted to be correct, complete or accurate. Except as otherwise required by law, Morningstar shall not be responsible for any trading decisions, damages or other
losses resulting from, or related to, this information, data, analyses or opinions or their use. This report is supplemental sales literature. If applicable it must be preceded or accompanied by a prospectus, or equivalent, and disclosure statement.
Please read the prospectus carefully.

More Related Content

What's hot

Uop fin-571-week-4-connect-problems-new
Uop fin-571-week-4-connect-problems-newUop fin-571-week-4-connect-problems-new
Uop fin-571-week-4-connect-problems-newaagnaa
 
Valuing Firm in Distress - A.Damodaran
Valuing Firm in Distress - A.DamodaranValuing Firm in Distress - A.Damodaran
Valuing Firm in Distress - A.DamodaranGiuseppe Fumagalli
 
Analisis de los ratios financieros
Analisis de los ratios financierosAnalisis de los ratios financieros
Analisis de los ratios financierosGermanSanchez107
 
Greif inc (spruce point capital)
Greif inc (spruce point capital)Greif inc (spruce point capital)
Greif inc (spruce point capital)Frank Ragol
 
Financial management
Financial managementFinancial management
Financial managementLepipi
 
Mercer Capital's Asset Management Industry Newsletter | Q2 2012 | Focus: Trad...
Mercer Capital's Asset Management Industry Newsletter | Q2 2012 | Focus: Trad...Mercer Capital's Asset Management Industry Newsletter | Q2 2012 | Focus: Trad...
Mercer Capital's Asset Management Industry Newsletter | Q2 2012 | Focus: Trad...Mercer Capital
 
A trend analysis of non performing assets (np as) of selected commercial ban...
A trend analysis of non  performing assets (np as) of selected commercial ban...A trend analysis of non  performing assets (np as) of selected commercial ban...
A trend analysis of non performing assets (np as) of selected commercial ban...Abhishek Duttagupta
 
Maroc telecom new acquistions - hold cfg group 05-05-2014-
Maroc telecom   new acquistions - hold  cfg group 05-05-2014-Maroc telecom   new acquistions - hold  cfg group 05-05-2014-
Maroc telecom new acquistions - hold cfg group 05-05-2014-mehdiammouri
 
International Business Law 6th Edition August Solutions Manual
International Business Law 6th Edition August Solutions ManualInternational Business Law 6th Edition August Solutions Manual
International Business Law 6th Edition August Solutions Manualrijefu
 
4yrTradeAnalysis_Full-Version
4yrTradeAnalysis_Full-Version4yrTradeAnalysis_Full-Version
4yrTradeAnalysis_Full-VersionJason Wyman
 
ACC 573 NERD Fabulous Teaching--acc573nerd.com
ACC 573 NERD Fabulous Teaching--acc573nerd.comACC 573 NERD Fabulous Teaching--acc573nerd.com
ACC 573 NERD Fabulous Teaching--acc573nerd.comsrivani504
 
How does the math work
How does the math workHow does the math work
How does the math workBrooke Clark
 
Uop fin 571 final exam
Uop fin 571 final examUop fin 571 final exam
Uop fin 571 final examkrystalhero123
 
Godrej Agrovet Ltd
Godrej Agrovet LtdGodrej Agrovet Ltd
Godrej Agrovet LtdAxis Direct
 
Liquidity vs. Profitability
Liquidity vs. ProfitabilityLiquidity vs. Profitability
Liquidity vs. ProfitabilityNeeraj Chitkara
 
State Bank of India: Absolute valuations, accumulate - Prabhudas Lilladher
State Bank of India: Absolute valuations, accumulate - Prabhudas LilladherState Bank of India: Absolute valuations, accumulate - Prabhudas Lilladher
State Bank of India: Absolute valuations, accumulate - Prabhudas LilladherIndiaNotes.com
 
Yield vs. Liquidity in Income Producing Investments
Yield vs. Liquidity in Income Producing InvestmentsYield vs. Liquidity in Income Producing Investments
Yield vs. Liquidity in Income Producing InvestmentsDavid Wrubel
 

What's hot (20)

Uop fin-571-week-4-connect-problems-new
Uop fin-571-week-4-connect-problems-newUop fin-571-week-4-connect-problems-new
Uop fin-571-week-4-connect-problems-new
 
Valuing Firm in Distress - A.Damodaran
Valuing Firm in Distress - A.DamodaranValuing Firm in Distress - A.Damodaran
Valuing Firm in Distress - A.Damodaran
 
Analisis de los ratios financieros
Analisis de los ratios financierosAnalisis de los ratios financieros
Analisis de los ratios financieros
 
Greif inc (spruce point capital)
Greif inc (spruce point capital)Greif inc (spruce point capital)
Greif inc (spruce point capital)
 
Financial management
Financial managementFinancial management
Financial management
 
Mercer Capital's Asset Management Industry Newsletter | Q2 2012 | Focus: Trad...
Mercer Capital's Asset Management Industry Newsletter | Q2 2012 | Focus: Trad...Mercer Capital's Asset Management Industry Newsletter | Q2 2012 | Focus: Trad...
Mercer Capital's Asset Management Industry Newsletter | Q2 2012 | Focus: Trad...
 
A trend analysis of non performing assets (np as) of selected commercial ban...
A trend analysis of non  performing assets (np as) of selected commercial ban...A trend analysis of non  performing assets (np as) of selected commercial ban...
A trend analysis of non performing assets (np as) of selected commercial ban...
 
Maroc telecom new acquistions - hold cfg group 05-05-2014-
Maroc telecom   new acquistions - hold  cfg group 05-05-2014-Maroc telecom   new acquistions - hold  cfg group 05-05-2014-
Maroc telecom new acquistions - hold cfg group 05-05-2014-
 
International Business Law 6th Edition August Solutions Manual
International Business Law 6th Edition August Solutions ManualInternational Business Law 6th Edition August Solutions Manual
International Business Law 6th Edition August Solutions Manual
 
Godrej Agrovet
Godrej AgrovetGodrej Agrovet
Godrej Agrovet
 
4yrTradeAnalysis_Full-Version
4yrTradeAnalysis_Full-Version4yrTradeAnalysis_Full-Version
4yrTradeAnalysis_Full-Version
 
ACC 573 NERD Fabulous Teaching--acc573nerd.com
ACC 573 NERD Fabulous Teaching--acc573nerd.comACC 573 NERD Fabulous Teaching--acc573nerd.com
ACC 573 NERD Fabulous Teaching--acc573nerd.com
 
How does the math work
How does the math workHow does the math work
How does the math work
 
Uop fin 571 final exam
Uop fin 571 final examUop fin 571 final exam
Uop fin 571 final exam
 
Fin 571 final exam guide new
Fin 571 final exam guide   newFin 571 final exam guide   new
Fin 571 final exam guide new
 
Godrej Agrovet Ltd
Godrej Agrovet LtdGodrej Agrovet Ltd
Godrej Agrovet Ltd
 
Morning Tea
Morning TeaMorning Tea
Morning Tea
 
Liquidity vs. Profitability
Liquidity vs. ProfitabilityLiquidity vs. Profitability
Liquidity vs. Profitability
 
State Bank of India: Absolute valuations, accumulate - Prabhudas Lilladher
State Bank of India: Absolute valuations, accumulate - Prabhudas LilladherState Bank of India: Absolute valuations, accumulate - Prabhudas Lilladher
State Bank of India: Absolute valuations, accumulate - Prabhudas Lilladher
 
Yield vs. Liquidity in Income Producing Investments
Yield vs. Liquidity in Income Producing InvestmentsYield vs. Liquidity in Income Producing Investments
Yield vs. Liquidity in Income Producing Investments
 

Viewers also liked

Knowledge Management Case Study
Knowledge Management Case StudyKnowledge Management Case Study
Knowledge Management Case StudyCuriosita, LLC
 
Education Brief January 2012
Education Brief January 2012Education Brief January 2012
Education Brief January 2012keatingcapital
 
When to Claim Social Security Retirement Benefits | Morningstar
When to Claim Social Security Retirement Benefits | MorningstarWhen to Claim Social Security Retirement Benefits | Morningstar
When to Claim Social Security Retirement Benefits | MorningstarThe 401k Study Group ®
 
2009 Portfolio
2009 Portfolio2009 Portfolio
2009 PortfolioLEBOW
 
Logo Collection
Logo CollectionLogo Collection
Logo CollectionLEBOW
 
Panasonic Work
Panasonic WorkPanasonic Work
Panasonic WorkLEBOW
 
Greensburg Recovery - Wichita Magazine 01.2009
Greensburg Recovery - Wichita Magazine 01.2009Greensburg Recovery - Wichita Magazine 01.2009
Greensburg Recovery - Wichita Magazine 01.2009Chuck Banks
 
2012 Portfolio
2012 Portfolio2012 Portfolio
2012 PortfolioLEBOW
 
Microsoft Word Morningstar Rfp Security Assessment 2008 V2 1
Microsoft Word   Morningstar Rfp   Security Assessment 2008 V2 1Microsoft Word   Morningstar Rfp   Security Assessment 2008 V2 1
Microsoft Word Morningstar Rfp Security Assessment 2008 V2 1Todd Petty
 
De goudhaantjes van Morningstar
De goudhaantjes van MorningstarDe goudhaantjes van Morningstar
De goudhaantjes van Morningstarmaartenvanderpas
 
Ricardo semler & semco, thunderbird
Ricardo semler & semco, thunderbirdRicardo semler & semco, thunderbird
Ricardo semler & semco, thunderbirdifauzan
 

Viewers also liked (12)

Knowledge Management Case Study
Knowledge Management Case StudyKnowledge Management Case Study
Knowledge Management Case Study
 
Education Brief January 2012
Education Brief January 2012Education Brief January 2012
Education Brief January 2012
 
When to Claim Social Security Retirement Benefits | Morningstar
When to Claim Social Security Retirement Benefits | MorningstarWhen to Claim Social Security Retirement Benefits | Morningstar
When to Claim Social Security Retirement Benefits | Morningstar
 
2009 Portfolio
2009 Portfolio2009 Portfolio
2009 Portfolio
 
Logo Collection
Logo CollectionLogo Collection
Logo Collection
 
Panasonic Work
Panasonic WorkPanasonic Work
Panasonic Work
 
Greensburg Recovery - Wichita Magazine 01.2009
Greensburg Recovery - Wichita Magazine 01.2009Greensburg Recovery - Wichita Magazine 01.2009
Greensburg Recovery - Wichita Magazine 01.2009
 
2012 Portfolio
2012 Portfolio2012 Portfolio
2012 Portfolio
 
Microsoft Word Morningstar Rfp Security Assessment 2008 V2 1
Microsoft Word   Morningstar Rfp   Security Assessment 2008 V2 1Microsoft Word   Morningstar Rfp   Security Assessment 2008 V2 1
Microsoft Word Morningstar Rfp Security Assessment 2008 V2 1
 
De goudhaantjes van Morningstar
De goudhaantjes van MorningstarDe goudhaantjes van Morningstar
De goudhaantjes van Morningstar
 
Morningstar
MorningstarMorningstar
Morningstar
 
Ricardo semler & semco, thunderbird
Ricardo semler & semco, thunderbirdRicardo semler & semco, thunderbird
Ricardo semler & semco, thunderbird
 

Similar to Mpdax morningstar with finra disclosure 6 30-13

Emerging Markets Fact Sheet
Emerging Markets Fact SheetEmerging Markets Fact Sheet
Emerging Markets Fact SheetRaymond Vasmout
 
BGEO GROUP - QUANTITY EQUITY REPORT
BGEO GROUP - QUANTITY EQUITY REPORT BGEO GROUP - QUANTITY EQUITY REPORT
BGEO GROUP - QUANTITY EQUITY REPORT DAVID CHIKHLADZE
 
fannie mae 2006 Annual Report
fannie mae  2006 Annual Report fannie mae  2006 Annual Report
fannie mae 2006 Annual Report finance6
 
Jp morgan investment funds income opportunity fund
Jp morgan investment funds   income opportunity fundJp morgan investment funds   income opportunity fund
Jp morgan investment funds income opportunity fundBobby Bob
 
Tesla Inc (TSLA) Stock Analysis Report
Tesla Inc (TSLA) Stock Analysis ReportTesla Inc (TSLA) Stock Analysis Report
Tesla Inc (TSLA) Stock Analysis ReportStock Target Advisor
 
Valuation Report Sample
Valuation Report SampleValuation Report Sample
Valuation Report Samplealexfloreshxf
 
Tesla Trap is Forming Again. Tesla News
Tesla Trap is Forming Again. Tesla NewsTesla Trap is Forming Again. Tesla News
Tesla Trap is Forming Again. Tesla NewsStocktargetadvisor.com
 
American Fortune Mergers
American Fortune Mergers American Fortune Mergers
American Fortune Mergers alexfloreshxf
 
Multiplus apresentacao 2_t13_eng
Multiplus apresentacao 2_t13_engMultiplus apresentacao 2_t13_eng
Multiplus apresentacao 2_t13_engMultiplus
 
Multiplus apresentacao 2_t13_eng
Multiplus apresentacao 2_t13_engMultiplus apresentacao 2_t13_eng
Multiplus apresentacao 2_t13_engMultiplus
 
Tesla Inc (TSLA) Stock Analysis Report
 Tesla Inc (TSLA) Stock Analysis Report Tesla Inc (TSLA) Stock Analysis Report
Tesla Inc (TSLA) Stock Analysis ReportStock Target Advisor
 

Similar to Mpdax morningstar with finra disclosure 6 30-13 (20)

Emerging Markets Fact Sheet
Emerging Markets Fact SheetEmerging Markets Fact Sheet
Emerging Markets Fact Sheet
 
BGEO GROUP - QUANTITY EQUITY REPORT
BGEO GROUP - QUANTITY EQUITY REPORT BGEO GROUP - QUANTITY EQUITY REPORT
BGEO GROUP - QUANTITY EQUITY REPORT
 
Select Directional 2016 08 31
Select Directional 2016 08 31Select Directional 2016 08 31
Select Directional 2016 08 31
 
Tesla Inc (TSLA) Stock Analysis
 Tesla Inc (TSLA) Stock Analysis Tesla Inc (TSLA) Stock Analysis
Tesla Inc (TSLA) Stock Analysis
 
Analyst Ratings for Tesla Inc
Analyst Ratings for Tesla IncAnalyst Ratings for Tesla Inc
Analyst Ratings for Tesla Inc
 
Tesla Inc (TSLA) Stock Analysis
 Tesla Inc (TSLA) Stock Analysis Tesla Inc (TSLA) Stock Analysis
Tesla Inc (TSLA) Stock Analysis
 
fannie mae 2006 Annual Report
fannie mae  2006 Annual Report fannie mae  2006 Annual Report
fannie mae 2006 Annual Report
 
Tesla Inc (TSLA) Stock Analysis
Tesla Inc (TSLA) Stock AnalysisTesla Inc (TSLA) Stock Analysis
Tesla Inc (TSLA) Stock Analysis
 
Jp morgan investment funds income opportunity fund
Jp morgan investment funds   income opportunity fundJp morgan investment funds   income opportunity fund
Jp morgan investment funds income opportunity fund
 
Tesla Inc (TSLA) Stock Analysis Report
Tesla Inc (TSLA) Stock Analysis ReportTesla Inc (TSLA) Stock Analysis Report
Tesla Inc (TSLA) Stock Analysis Report
 
Tesla Inc (TSLA) Stock Analysis
 Tesla Inc (TSLA) Stock Analysis Tesla Inc (TSLA) Stock Analysis
Tesla Inc (TSLA) Stock Analysis
 
Tesla Inc (TSLA) Stock Analysis
 Tesla Inc (TSLA) Stock Analysis Tesla Inc (TSLA) Stock Analysis
Tesla Inc (TSLA) Stock Analysis
 
TSLA Inc.pdf
TSLA Inc.pdfTSLA Inc.pdf
TSLA Inc.pdf
 
Valuation Report Sample
Valuation Report SampleValuation Report Sample
Valuation Report Sample
 
Tesla Trap is Forming Again. Tesla News
Tesla Trap is Forming Again. Tesla NewsTesla Trap is Forming Again. Tesla News
Tesla Trap is Forming Again. Tesla News
 
Tesla Inc
Tesla IncTesla Inc
Tesla Inc
 
American Fortune Mergers
American Fortune Mergers American Fortune Mergers
American Fortune Mergers
 
Multiplus apresentacao 2_t13_eng
Multiplus apresentacao 2_t13_engMultiplus apresentacao 2_t13_eng
Multiplus apresentacao 2_t13_eng
 
Multiplus apresentacao 2_t13_eng
Multiplus apresentacao 2_t13_engMultiplus apresentacao 2_t13_eng
Multiplus apresentacao 2_t13_eng
 
Tesla Inc (TSLA) Stock Analysis Report
 Tesla Inc (TSLA) Stock Analysis Report Tesla Inc (TSLA) Stock Analysis Report
Tesla Inc (TSLA) Stock Analysis Report
 

Recently uploaded

如何办理密苏里大学堪萨斯分校毕业证(文凭)UMKC学位证书
如何办理密苏里大学堪萨斯分校毕业证(文凭)UMKC学位证书如何办理密苏里大学堪萨斯分校毕业证(文凭)UMKC学位证书
如何办理密苏里大学堪萨斯分校毕业证(文凭)UMKC学位证书Fir La
 
Osisko Gold Royalties Ltd - Corporate Presentation, April 23, 2024
Osisko Gold Royalties Ltd - Corporate Presentation, April 23, 2024Osisko Gold Royalties Ltd - Corporate Presentation, April 23, 2024
Osisko Gold Royalties Ltd - Corporate Presentation, April 23, 2024Osisko Gold Royalties Ltd
 
Collective Mining | Corporate Presentation - April 2024
Collective Mining | Corporate Presentation - April 2024Collective Mining | Corporate Presentation - April 2024
Collective Mining | Corporate Presentation - April 2024CollectiveMining1
 
定制(UWIC毕业证书)英国卡迪夫城市大学毕业证成绩单原版一比一
定制(UWIC毕业证书)英国卡迪夫城市大学毕业证成绩单原版一比一定制(UWIC毕业证书)英国卡迪夫城市大学毕业证成绩单原版一比一
定制(UWIC毕业证书)英国卡迪夫城市大学毕业证成绩单原版一比一Fir La
 
Basic Accountants in|TaxlinkConcept.pdf
Basic  Accountants in|TaxlinkConcept.pdfBasic  Accountants in|TaxlinkConcept.pdf
Basic Accountants in|TaxlinkConcept.pdftaxlinkcpa
 
Cyberagent_For New Investors_EN_240424.pdf
Cyberagent_For New Investors_EN_240424.pdfCyberagent_For New Investors_EN_240424.pdf
Cyberagent_For New Investors_EN_240424.pdfCyberAgent, Inc.
 
9654467111 Low Rate Call Girls In Tughlakabad, Delhi NCR
9654467111 Low Rate Call Girls In Tughlakabad, Delhi NCR9654467111 Low Rate Call Girls In Tughlakabad, Delhi NCR
9654467111 Low Rate Call Girls In Tughlakabad, Delhi NCRSapana Sha
 
如何办理伦敦大学毕业证(文凭)London学位证书
如何办理伦敦大学毕业证(文凭)London学位证书如何办理伦敦大学毕业证(文凭)London学位证书
如何办理伦敦大学毕业证(文凭)London学位证书Fis s
 
The Concept of Humanity in Islam and its effects at future of humanity
The Concept of Humanity in Islam and its effects at future of humanityThe Concept of Humanity in Islam and its effects at future of humanity
The Concept of Humanity in Islam and its effects at future of humanityJohanAspro
 
9654467111 Call Girls In Katwaria Sarai Short 1500 Night 6000
9654467111 Call Girls In Katwaria Sarai Short 1500 Night 60009654467111 Call Girls In Katwaria Sarai Short 1500 Night 6000
9654467111 Call Girls In Katwaria Sarai Short 1500 Night 6000Sapana Sha
 
The resilient U.S. late-cycle expansion contributed to a stalling pattern in ...
The resilient U.S. late-cycle expansion contributed to a stalling pattern in ...The resilient U.S. late-cycle expansion contributed to a stalling pattern in ...
The resilient U.S. late-cycle expansion contributed to a stalling pattern in ...Kumaran637735
 
Collective Mining | Corporate Presentation - April 2024
Collective Mining | Corporate Presentation - April 2024Collective Mining | Corporate Presentation - April 2024
Collective Mining | Corporate Presentation - April 2024CollectiveMining1
 
WheelTug PLC Pitch Deck | Investor Insights | April 2024
WheelTug PLC Pitch Deck | Investor Insights | April 2024WheelTug PLC Pitch Deck | Investor Insights | April 2024
WheelTug PLC Pitch Deck | Investor Insights | April 2024Hector Del Castillo, CPM, CPMM
 
No 1 AMil Baba In Islamabad No 1 Amil Baba In Lahore No 1 Amil Baba In Faisl...
No 1 AMil Baba In Islamabad  No 1 Amil Baba In Lahore No 1 Amil Baba In Faisl...No 1 AMil Baba In Islamabad  No 1 Amil Baba In Lahore No 1 Amil Baba In Faisl...
No 1 AMil Baba In Islamabad No 1 Amil Baba In Lahore No 1 Amil Baba In Faisl...First NO1 World Amil baba in Faisalabad
 
slideshare_2404_presentation materials_en.pdf
slideshare_2404_presentation materials_en.pdfslideshare_2404_presentation materials_en.pdf
slideshare_2404_presentation materials_en.pdfsansanir
 

Recently uploaded (20)

如何办理密苏里大学堪萨斯分校毕业证(文凭)UMKC学位证书
如何办理密苏里大学堪萨斯分校毕业证(文凭)UMKC学位证书如何办理密苏里大学堪萨斯分校毕业证(文凭)UMKC学位证书
如何办理密苏里大学堪萨斯分校毕业证(文凭)UMKC学位证书
 
Osisko Gold Royalties Ltd - Corporate Presentation, April 23, 2024
Osisko Gold Royalties Ltd - Corporate Presentation, April 23, 2024Osisko Gold Royalties Ltd - Corporate Presentation, April 23, 2024
Osisko Gold Royalties Ltd - Corporate Presentation, April 23, 2024
 
young call girls in Yamuna Vihar 🔝 9953056974 🔝 Delhi escort Service
young  call girls in   Yamuna Vihar 🔝 9953056974 🔝 Delhi escort Serviceyoung  call girls in   Yamuna Vihar 🔝 9953056974 🔝 Delhi escort Service
young call girls in Yamuna Vihar 🔝 9953056974 🔝 Delhi escort Service
 
Collective Mining | Corporate Presentation - April 2024
Collective Mining | Corporate Presentation - April 2024Collective Mining | Corporate Presentation - April 2024
Collective Mining | Corporate Presentation - April 2024
 
定制(UWIC毕业证书)英国卡迪夫城市大学毕业证成绩单原版一比一
定制(UWIC毕业证书)英国卡迪夫城市大学毕业证成绩单原版一比一定制(UWIC毕业证书)英国卡迪夫城市大学毕业证成绩单原版一比一
定制(UWIC毕业证书)英国卡迪夫城市大学毕业证成绩单原版一比一
 
Basic Accountants in|TaxlinkConcept.pdf
Basic  Accountants in|TaxlinkConcept.pdfBasic  Accountants in|TaxlinkConcept.pdf
Basic Accountants in|TaxlinkConcept.pdf
 
Cyberagent_For New Investors_EN_240424.pdf
Cyberagent_For New Investors_EN_240424.pdfCyberagent_For New Investors_EN_240424.pdf
Cyberagent_For New Investors_EN_240424.pdf
 
9654467111 Low Rate Call Girls In Tughlakabad, Delhi NCR
9654467111 Low Rate Call Girls In Tughlakabad, Delhi NCR9654467111 Low Rate Call Girls In Tughlakabad, Delhi NCR
9654467111 Low Rate Call Girls In Tughlakabad, Delhi NCR
 
Model Call Girl in Udyog Vihar Delhi reach out to us at 🔝9953056974🔝
Model Call Girl in Udyog Vihar Delhi reach out to us at 🔝9953056974🔝Model Call Girl in Udyog Vihar Delhi reach out to us at 🔝9953056974🔝
Model Call Girl in Udyog Vihar Delhi reach out to us at 🔝9953056974🔝
 
如何办理伦敦大学毕业证(文凭)London学位证书
如何办理伦敦大学毕业证(文凭)London学位证书如何办理伦敦大学毕业证(文凭)London学位证书
如何办理伦敦大学毕业证(文凭)London学位证书
 
The Concept of Humanity in Islam and its effects at future of humanity
The Concept of Humanity in Islam and its effects at future of humanityThe Concept of Humanity in Islam and its effects at future of humanity
The Concept of Humanity in Islam and its effects at future of humanity
 
Escort Service Call Girls In Shalimar Bagh, 99530°56974 Delhi NCR
Escort Service Call Girls In Shalimar Bagh, 99530°56974 Delhi NCREscort Service Call Girls In Shalimar Bagh, 99530°56974 Delhi NCR
Escort Service Call Girls In Shalimar Bagh, 99530°56974 Delhi NCR
 
9654467111 Call Girls In Katwaria Sarai Short 1500 Night 6000
9654467111 Call Girls In Katwaria Sarai Short 1500 Night 60009654467111 Call Girls In Katwaria Sarai Short 1500 Night 6000
9654467111 Call Girls In Katwaria Sarai Short 1500 Night 6000
 
The resilient U.S. late-cycle expansion contributed to a stalling pattern in ...
The resilient U.S. late-cycle expansion contributed to a stalling pattern in ...The resilient U.S. late-cycle expansion contributed to a stalling pattern in ...
The resilient U.S. late-cycle expansion contributed to a stalling pattern in ...
 
Collective Mining | Corporate Presentation - April 2024
Collective Mining | Corporate Presentation - April 2024Collective Mining | Corporate Presentation - April 2024
Collective Mining | Corporate Presentation - April 2024
 
young call girls in Govindpuri 🔝 9953056974 🔝 Delhi escort Service
young call girls in Govindpuri 🔝 9953056974 🔝 Delhi escort Serviceyoung call girls in Govindpuri 🔝 9953056974 🔝 Delhi escort Service
young call girls in Govindpuri 🔝 9953056974 🔝 Delhi escort Service
 
Model Call Girl in Uttam Nagar Delhi reach out to us at 🔝9953056974🔝
Model Call Girl in Uttam Nagar Delhi reach out to us at 🔝9953056974🔝Model Call Girl in Uttam Nagar Delhi reach out to us at 🔝9953056974🔝
Model Call Girl in Uttam Nagar Delhi reach out to us at 🔝9953056974🔝
 
WheelTug PLC Pitch Deck | Investor Insights | April 2024
WheelTug PLC Pitch Deck | Investor Insights | April 2024WheelTug PLC Pitch Deck | Investor Insights | April 2024
WheelTug PLC Pitch Deck | Investor Insights | April 2024
 
No 1 AMil Baba In Islamabad No 1 Amil Baba In Lahore No 1 Amil Baba In Faisl...
No 1 AMil Baba In Islamabad  No 1 Amil Baba In Lahore No 1 Amil Baba In Faisl...No 1 AMil Baba In Islamabad  No 1 Amil Baba In Lahore No 1 Amil Baba In Faisl...
No 1 AMil Baba In Islamabad No 1 Amil Baba In Lahore No 1 Amil Baba In Faisl...
 
slideshare_2404_presentation materials_en.pdf
slideshare_2404_presentation materials_en.pdfslideshare_2404_presentation materials_en.pdf
slideshare_2404_presentation materials_en.pdf
 

Mpdax morningstar with finra disclosure 6 30-13

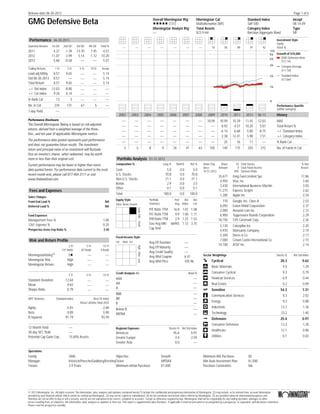
  • 1. GMG Defensive Beta Overall Morningstar RtgTM Morningstar Cat Standard Index Incept (131) Multialternative (MF) S&P 500 08-14-09 Morningstar Analyst RtgTM Total Assets Category Index Type __ $23.9 mil Barclays Aggregate Bond MF Performance 06-30-2013 Quarterly Returns 1st Qtr 2nd Qtr 3rd Qtr 4th Qtr Total % 2011 4.37 -1.39 -13.70 7.45 -4.57 2012 11.07 -3.99 5.14 -1.72 10.20 2013 5.68 -0.58 __ __ 5.07 Trailing Returns 1 Yr 3 Yr 5 Yr 10 Yr Incept Load-adj Mthly 8.57 9.65 __ __ 5.14 Std 06-30-2013 8.57 __ __ __ 5.14 Total Return 8.57 9.65 __ __ 5.14................................................................................................. +/- Std Index -12.03 -8.80 __ __ __ +/- Cat Index 9.26 6.14 __ __ __ ................................................................................................. % Rank Cat 13 3 __ __ __ ................................................................................................. No. in Cat 234 131 67 5 __ 7-day Yield __ ................................................................................................. Performance Disclosure The Overall Morningstar Rating is based on risk-adjusted returns, derived from a weighted average of the three-, five-, and ten-year (if applicable) Morningstar metrics. The performance data quoted represents past performance and does not guarantee future results. The investment return and principal value of an investment will fluctuate thus an investor's shares, when redeemed, may be worth more or less than their original cost. Current performance may be lower or higher than return data quoted herein. For performance data current to the most recent month-end, please call 877-464-3111 or visit www.thebetafund.com. Fees and Expenses Sales Charges Front-End Load % Deferred Load % NA NA Fund Expenses Management Fees % 12b1 Expense % Prospectus Gross Exp Ratio % 1.00 0.25 2.40 Risk and Return Profile 3 Yr 5 Yr 10 Yr 131 funds 67 funds 5 funds MorningstarRatingTM 5 __ __ Morningstar Risk High __ __ Morningstar Return High __ __ 3 Yr 5 Yr 10 Yr Standard Deviation 12.64 __ __ Mean 9.65 __ __ Sharpe Ratio 0.79 __ __ MPT Statistics Standard Index Best Fit Index Mstar Lifetime Mod 2035 Alpha -5.93 -2.89 Beta 0.89 0.90 R-Squared 91.19 93.59 12-Month Yield __ 30-day SEC Yield __ Potential Cap Gains Exp 15.00% Assets Operations Family: GMG Objective: Growth Minimum IRA Purchase: $0 Manager: Krivicich/Pursche/Goldberg/KerstingTicker: MPDAX Min Auto Investment Plan: $1,000 Tenure: 3.9 Years Minimum Intitial Purchase: $1,000 Purchase Constraints: NA Investment Style Equity Stock %__ __ __ __ __ __ __ 16 85 89 91 92 ..................................................................................................................................................................................................................... ..................................................................................................................................................................................................................... ..................................................................................................................................................................................................................... ..................................................................................................................................................................................................................... ..................................................................................................................................................................................................................... ..................................................................................................................................................................................................................... ..................................................................................................................................................................................................................... 4k 10k 20k 40k 60k 80k 100k Growth of $10,000 GMG Defensive Beta $12,143 Category Average $11,158 Standard Index $17,064 Performance Quartile (within category) History2002 2003 2004 2005 2006 2007 2008 2009 2010 2011 2012 06-13 __ __ __ __ __ __ __ 10.09 10.99 10.39 11.45 12.03 __ __ __ __ __ __ __ __ 8.92 -4.57 10.20 5.07 NAV Total Return % __ __ __ __ __ __ __ __ -6.14 -6.68 -5.80 -8.75 __ __ __ __ __ __ __ __ 2.38 -12.41 5.98 7.51............................................................................................................................................................................................................................................................................ __ __ __ __ __ __ __ __ 25 76 11 __ ............................................................................................................................................................................................................................................................................ 3 5 8 9 24 41 63 105 140 175 203 272 +/- Standard Index +/- Category Index % Rank Cat No. of Funds in Cat Portfolio Analysis 01-31-2013 Composition % Long % Short% Net % Cash 5.0 0.0 5.0 U.S. Stocks 70.8 0.0 70.8 Non-U.S. Stocks 21.1 0.0 21.1 Bonds 2.9 0.0 3.0 Other 0.1 0.0 0.1................................................................................................. Total 100.0 0.0 100.0 Equity Style Value Blend Growth SmallMidLarge Portfolio Port Rel Rel Statistics Avg Index Cat P/E Ratio TTM 16.8 1.02 1.08 P/C Ratio TTM 9.9 1.00 1.11 P/B Ratio TTM 2.9 1.23 1.52 Geo Avg Mkt 66945 1.13 3.75 Cap $mil Fixed-Income Style Ltd Mod Ext LowMedHigh Avg Eff Duration __ Avg Eff Maturity __ Avg Credit Quality __ Avg Wtd Coupon 6.41 Avg Wtd Price 105.96 Credit Analysis NA Bond % AAA __ AA __ A __ ................................................................................................................. BBB __ BB __ B __ ................................................................................................................. Below B __ NR/NA __ Regional Exposure Stocks % Rel Std Index Americas 95.6 0.97 Greater Europe 4.4 2.59 Greater Asia 0.0 __ Share Chg Share 42 Total Stocks % Net since Amount 0 Total Fixed-Income Assets 10-31-2012 30% Turnover Ratio 35,677 4,950 3,430 11,275 1,280 Gmg Fund Limited Spc Visa, Inc. International Business Machin Express Scripts Apple Inc 17.86 3.40 3.03 2.62 2.54.............................................................................................................................. 770 6,050 2,000 6,900 10,150 Google, Inc. Class A Exxon Mobil Corporation Amazon.com Inc Tupperware Brands Corporation CVS Caremark Corp 2.53 2.37 2.31 2.29 2.26.............................................................................................................................. 5,130 4,970 5,300 7,000 14,100 Caterpillar Inc Monsanto Company Deere & Co Crown Castle International Co AT&T Inc 2.20 2.19 2.17 2.15 2.14 Sector Weightings Stocks % Rel Std Index h Cyclical 20.3 0.62 r Basic Materials 4.0 1.29 t Consumer Cyclical 9.3 0.79 y Financial Services 6.9 0.44 u Real Estate 0.2 0.09 j Sensitive 54.3 1.31 i Communication Services 8.3 2.02 o Energy 9.2 0.88 p Industrials 13.7 1.36 a Technology 23.2 1.40 k Defensive 25.4 0.97 s Consumer Defensive 13.2 1.28 d Healthcare 12.1 0.96 f Utilities 0.1 0.03 ................................................................................................................................................... ................................................................................................................................................... Page 1 of 6Release date 06-30-2013 © 2013 Morningstar, Inc. All rights reserved. The information, data, analyses and opinions contained herein (1) include the confidential and proprietary information of Morningstar, (2) may include, or be derived from, account information provided by your financial advisor which cannot be verified by Morningstar, (3) may not be copied or redistributed, (4) do not constitute investment advice offered by Morningstar, (5) are provided solely for informational purposes and therefore are not an offer to buy or sell a security, and (6) are not warranted to be correct, complete or accurate. Except as otherwise required by law, Morningstar shall not be responsible for any trading decisions, damages or other losses resulting from, or related to, this information, data, analyses or opinions or their use. This report is supplemental sales literature. If applicable it must be preceded or accompanied by a prospectus, or equivalent, and disclosure statement. Please read the prospectus carefully.
  • 2. Disclosure for Standardized and Tax Adjusted Returns The performance data quoted represents past performance and does not guarantee future results. The investment return and principal value of an investment will fluctuate thus an investor's shares, when redeemed, may be worth more or less than their original cost. Current performance may be lower or higher than return data quoted herein. For performance data current to the most recent month-end please visit http://advisor.morningstar.com/familyinfo.asp. An investment in a money market fund is not insured or guaranteed by the FDIC or any other government agency. The current yield quotation more closely reflects the current earnings of the money market fund than the total return quotation. Although money markets seek to preserve the value of your investment at $1.00 per share, it is possible to lose money by investing in the fund. Standardized Returns assume reinvestment of dividends and capital gains. It depicts performance without adjusting for the effects of taxation, but are adjusted to reflect sales charges and ongoing fund expenses. If adjusted for taxation, the performance quoted would be significantly reduced. For variable annuities, additional expenses will be taken in account, including M&E risk charges, fund-level expenses such as management fees and operating fees, and policy-level administration fees, charges such as surrender, contract and sales charges. After-tax returns are calculated using the highest individual federal marginal income tax rates, and do not reflect the impact of state and local taxes. Actual after tax returns depend on the investor's tax situation and may differ from those shown. The after tax returns shown are not relevant to investors who hold their fund shares through tax-deferred arrangements such as 401(k) plans or an IRA. After-tax returns exclude the effects of either the alternative minimum tax or phase-out of certain tax credits. Any taxes due are as of the time the distributions are made, and the taxable amount and tax character of each distribution is as specified by the fund on the dividend declaration date. Due to foreign tax credits or realized capital losses, after-tax returns may be greater than before tax returns. After-tax returns for exchange-traded funds are based on net asset value. Annualized returns 06-30-2013 Standardized Returns (%) 7-day Yield 1Yr 5Yr 10Yr Since Inception Inception Date Max Front Load % Max Back Load % Net Exp Ratio % Gross Exp Ratio % GMG Defensive Beta -- 8.57 -- -- 5.14 08-14-09 NA NA 1.65 1 2.40 Standard & Poor's 500 -- 20.60 7.01 7.30 -- -- Barclay's Agg Bond Index -- -0.69 5.19 4.52 -- -- MSCI EAFE Index Ndtr_D -- 18.62 -0.63 7.67 -- -- 3 Month T-Bill -- 0.09 0.20 1.69 -- -- 1. Contractual waiver that expires 11/30/2013. Returns after Taxes (%) on Distribution on Distribution and Sales of Shares 1Yr 5Yr 10Yr Since Inception Inception Date 1Yr 5Yr 10Yr Since Inception GMG Defensive Beta 8.57 -- -- 5.06 08-14-09 4.85 -- -- 3.95 Page 2 of 6 © 2013 Morningstar, Inc. All rights reserved. The information, data, analyses and opinions contained herein (1) include the confidential and proprietary information of Morningstar, (2) may include, or be derived from, account information provided by your financial advisor which cannot be verified by Morningstar, (3) may not be copied or redistributed, (4) do not constitute investment advice offered by Morningstar, (5) are provided solely for informational purposes and therefore are not an offer to buy or sell a security, and (6) are not warranted to be correct, complete or accurate. Except as otherwise required by law, Morningstar shall not be responsible for any trading decisions, damages or other losses resulting from, or related to, this information, data, analyses or opinions or their use. This report is supplemental sales literature. If applicable it must be preceded or accompanied by a prospectus, or equivalent, and disclosure statement. Please read the prospectus carefully.
  • 3. Mutual Fund Detail Report Disclosure Statement The Mutual Fund Detail Report is to be used as supplemental sales literature, and therefore must be preceded or accompanied by the fund's current prospec- tus and a disclosure statement. Please read the prospectus carefully. In all cases, this disclosure statement should accompany the Mutual Fund Detail Report. Portfolio information is based on the most recent information available to Morningstar. Morningstar Associates, LLC, a regsitered investment advisor and wholly owned subsidiary of Morningstar, Inc., provides various institutional in- vestment consulting services, including asset allocation advice to invest- ment advisors who have or will be creating a fund-of-fund/asset allocation product. However, despite the fact that such a relationship may exist, the information displayed for those products will not be influenced as they are objective measures and/or derived by quantitative driven formulas (i.e., Morningstar Rating). For more information on these Morningstar relationships, please visit the Release Notes section of this product. Morningstar is not a FINRA-member firm. Pre-inception Returns The analysis in this report may be based, in part, on adjusted historical returns for periods prior to the fund's actual inception. These calculated returns reflect the historical performance of the oldest share class of the fund, adjusted to reflect the fees and expenses of this share class. These fees and expenses are referenced in the report's Performance section. When pre-inception data are presented in the report, the header at the top of the report will indicate this. In addition, the pre-inception data included in the report will appear in italics. While the inclusion of pre-inception data provides valuable insight into the probable long-term behavior of newer share classes of a fund, investors should be aware that an adjusted historical return can only provide an approximation of that behavior. For example, the fee structures between a retail share class will vary from that of an institutional share class, as retail shares tend to have higher operating expenses and sales charges. These adjusted historical returns are not actual returns. Calculation methodologies utilized by Morningstar may differ from those applied by other entities, including the fund itself. Performance The performance data given represents past perfomance and should not be considered indicative of future results. Principal value and investment return will fluctuate, so that an investor's shares when redeemed may be worth more or less than the original investmant. Fund portfolio statistics change over time. The fund is not FDIC-insured, may lose value and is not guaranteed by a bank or other financial institution. Total return reflects performance without adjusting for sales charges or the effects of taxation, but is adjusted to reflect all actual ongoing fund expenses and assumes reinvestment of dividends and capital gains. If adjusted for sales charges and the effects of taxation, the performance quoted would be reduced. Standardized Total Return is reflected as of month- and quarter-end time periods. It depicts performance without adjusting for the effects of taxation, but is adjusted for sales charges, all ongoing fund expenses, and assumes reinvestment of dividends and capital gains. If adjusted for the effects of taxation, the performance quoted would be reduced. The sales charge used in the calculation was obtained from the fund's most recent prospectus and/or shareholder report available to Morningstar. Standardized returns never include pre-inception history. Morningstar % Rank within Morningstar Category does not account for a fund's sales charge (if applicable). Rankings will not be provided for periods less than one year. Growth of $10,000 The graph compares the growth of $10,000 in a fund with that of an index and with that of the average for all funds in its Morningstar category. The total returns are not adjusted to reflect sales charges or the effects of taxation, but are adjusted to reflect actual ongoing fund expenses, and assume reinvestment of dividends and capital gains. If adjusted, sales charges would reduce the performance quoted. The index is an unmanaged portfolio of specified securities and cannot be invested in directly. The index and the category average do not reflect any initial or ongoing expenses. A fund's portfolio may differ significantly from the securities in the index. The index is chosen by Morningstar. If pre-inception data is included in the analysis, it will be graphed. Morningstar Analyst Rating The Morningstar Analyst Rating is not a credit or risk rating. It is a subjective evaluation performed by the mutual fund analysts of Morningstar, Inc. Morningstar evaluates funds based on five key pillars, which are process, performance, people, parent, and price. Morningstar's analysts use this five pillar evaluation to identify funds they believe are more likely to outperform over the long term on a risk-adjusted basis. Analysts consider quantitative and qualitative factors in their research, and the weighting of each pillar may vary. The Analyst Rating ultimately reflects the analyst's overall assessment and is overseen by Morningstar's Analyst Rating Committee. The approach serves not as a formula but as a framework to ensure consistency across Morningstar's global coverage universe. The Analyst Rating scale ranges from Gold to Negative, with Gold being the highest rating and Negative being the lowest rating. A fund with a Gold rating distinguishes itself across the five pillars and has garnered the analysts' highest level of conviction. A fund with a Silver rating has notable advantages across several, but perhaps not all, of the five pillars-strengths that give the analysts a high level of conviction. A Bronze-rated fund has advantages that outweigh the disadvantages across the five pillars, with sufficient level of analyst conviction to warrant a positive rating. A fund with a Neutral rating isn't seriously flawed across the five pillars, nor does it distinguish itself very positively. A Negative rated fund is flawed in at least one if not more pillars and is considered an inferior offering to its peers. Analyst Ratings are reevaluated at least every 14 months. For more detailed information about Morningstar's Analyst Rating, including its methodology, please go to http://corporate.morningstar.com /us/documents/MethodologyDocuments/ AnalystRatingforFundsMethodology.pdf. The Morningstar Analyst Rating should not be used as the sole basis in evaluating a mutual fund. Morningstar Analyst Ratings are based on Morningstar's current expectations about future events; therefore, in no way does Morningstar represent ratings as a guarantee nor should they be viewed by an investor as such. Morningstar Analyst Ratings involve unknown risks and uncertainties which may cause Morningstar's expectations Page 3 of 6 © 2013 Morningstar, Inc. All rights reserved. The information, data, analyses and opinions contained herein (1) include the confidential and proprietary information of Morningstar, (2) may include, or be derived from, account information provided by your financial advisor which cannot be verified by Morningstar, (3) may not be copied or redistributed, (4) do not constitute investment advice offered by Morningstar, (5) are provided solely for informational purposes and therefore are not an offer to buy or sell a security, and (6) are not warranted to be correct, complete or accurate. Except as otherwise required by law, Morningstar shall not be responsible for any trading decisions, damages or other losses resulting from, or related to, this information, data, analyses or opinions or their use. This report is supplemental sales literature. If applicable it must be preceded or accompanied by a prospectus, or equivalent, and disclosure statement. Please read the prospectus carefully.
  • 4. not to occur or to differ significantly from what we expected. Risk and Return The Morningstar Rating is calculated for funds with at least a three-year history. It is calculated based on a Morningstar Risk-Adjusted Return measure that accounts for variation in a fund's monthly performance, placing more emphasis on downward variations and rewarding consistent performance. The top 10% of funds in each category receive 5 stars, the next 22.5% receive 4 stars, the next 35% receive 3 stars, the next 22.5% receive 2 stars and the bottom 10% receive 1 star. The Overall Morningstar Rating for a mutual fund is derived from a weighted average of the performance figures associated with its three-, five- and 10-year (if applicable) Morningstar Rating metrics. Please note that some Morningstar proprietary calculations, including the Morningstar Rating, may be calculated based on adjusted historical returns (pre-inception returns). If the extended performance rating is in effect, the "stars" are represented as unshaded stars. For each mutual fund with at least a three-year history, Morningstar calculates a Morningstar Rating based on a Morningstar Risk-Adjusted Return measure that accounts for variation in a fund's adjusted monthly performance, placing more emphasis on downward variations and rewarding consistent performance. The top 10% of funds in each category receive 5 stars, the next 22.5% receive 4 stars, the next 35% receive 3 stars, the next 22.5% receive 2 stars and the bottom 10% receive 1 star. This investment's independent Morningstar Rating metric is then compared against the open-end mutual fund universe's actual performance breakpoints to determine its extended performance rating. The Overall Morningstar Rating for a mutual fund is derived from a weighted average of the actual performance figures associated with its three-, five- and 10-year (if applicable) Morningstar Rating metrics. Morningstar Return rates a mutual fund's performance relative to other funds in its Morningstar Category. It is an assessment of a fund's excess return over a risk-free rate (the return of the 90-day Treasury Bill), after adjusting for all applicable loads and sales charges, in comparison with the mutual funds in its Morningstar Category. In each Morningstar Category, the top 10% of funds earn a High Morningstar Return (HIGH), the next 22.5% Above Average (+AVG), the middle 35% Average (AVG), the next 22.5% Below Average (-AVG), and the bottom 10% Low (LOW). Morningstar Return is measured for up to three time periods (three-, five-, and 10 years). These separate measures are then weighted and averaged to produce an overall measure for the mutual fund. Funds with less than three years of performance history are not rated. Morningstar Risk evaluates a mutual fund's downside volatility relative to that of other funds in its Morningstar Category. It is an assessment of the variations in a fund's monthly returns, with an emphasis on downside variations, in comparison with the mutual funds in its Morningstar Category. In each Morningstar Category, the 10% of funds with the lowest measured risk are described as Low Risk (LOW), the next 22.5% Below Average (-AVG), the middle 35% Average (AVG), the next 22.5% Above Average (+AVG), and the top 10% High (HIGH). Morningstar Risk is measured for up to three time periods (three-, five-, and 10 years). These separate measures are then weighted and averaged to produce an overall measure for the mutual fund. Funds with less than three years of performance history are not rated. If pre-inception returns are included in this analysis, the risk and return profile data calculated on the basis of these returns will appear in italics. Risk Measures The risk measures below are calculated for funds with at least a three- year history. Standard deviation is a statistical measure of the volatility of the fund's returns. Mean represents the annualized geometric return for the period shown. The Sharpe ratio uses standard deviation and excess return to determine reward per unit of risk. Alpha measures the difference between a fund's actual returns and its expected performance, given its level of risk (as measured by beta). Alpha is often seen as a measure of the value added or subtracted by a portfolio manager. Beta is a measure of a fund's sensitivity to market movements. A portfolio with a beta greater than 1 is more volatile than the market, and a portfolio with a beta less than 1 is less volatile than the market R-squared reflects the percentage of a fund's movements that are explained by movements in its benchmark index, showing the degree of correlation between the fund and the benchmark. This figure is also helpful in assessing how likely it is that alpha and beta are statistically significant. Risk measures calculated using pre-inception data, if included in the analysis, will be presented in italics. Portfolio Analysis The Morningstar Style Box reveals a fund's investment strategy. For equity funds the vertical axis shows the market capitalization of the stocks owned and the horizontal axis shows investment style (value, blend or growth). For fixed-income funds the vertical axis shows the average credit quality of the bonds owned, and the horizontal axis shows interest rate sensitivity as measured by a bond's duration (limited, moderate or extensive). Composition The weighting of the portfolio in various asset classes, including "Other," is shown in this table. "Other" includes security types that are not neatly classified in the other asset classes, such as convertible bonds and preferred stocks. In the table, allocation to the classes is shown for long positions, short positions, and net (long positions net of short) positions. These statistics summarize what the managers are buying and how they are positioning the portfolio. When short positions are captured in these portfolio statistics, investors get a more robust description of the funds' exposure and risk. Most managed product portfolios hold fairly conventional securities, such as long positions in stocks and bonds. Other portfolios use other investment strategies or securities, such as short positions or derivatives, to reduce transaction costs, enhance returns, or reduce risk. Some of these securities and strategies behave like conventional securities, while others have unique return and risk characteristics. Most portfolios take long positions in securities. Long positions involve buying the security outright and then selling it later, with the hope that the security price rises over time. In contrast, short positions are taken to benefit from anticipated price declines. In this type of transaction, the investor borrows the security from another investor, sells it and receives cash, and then is obligated to buy it back at some point in the future. If the price falls after the short sale, the investor will have sold high and can now buy low to close the short position and lock in a profit. However, if the price of the security increases after the short sale, the investor will experience losses by buying it at a higher price than the sale price. Page 4 of 6 © 2013 Morningstar, Inc. All rights reserved. The information, data, analyses and opinions contained herein (1) include the confidential and proprietary information of Morningstar, (2) may include, or be derived from, account information provided by your financial advisor which cannot be verified by Morningstar, (3) may not be copied or redistributed, (4) do not constitute investment advice offered by Morningstar, (5) are provided solely for informational purposes and therefore are not an offer to buy or sell a security, and (6) are not warranted to be correct, complete or accurate. Except as otherwise required by law, Morningstar shall not be responsible for any trading decisions, damages or other losses resulting from, or related to, this information, data, analyses or opinions or their use. This report is supplemental sales literature. If applicable it must be preceded or accompanied by a prospectus, or equivalent, and disclosure statement. Please read the prospectus carefully.
  • 5. The strategy of selling securities short is prevalent in specialized portfolios, such as long-short, market-neutral, bear-market, and hedge funds. Most conventional portfolios do not typically short securities, although they may reserve the right to do so under special circumstances. Funds may also short derivatives, and this is sometimes more efficient than shorting individual securities. Short positions produce negative exposure to the security that is being shorted. This means that when the security rises in value, the short position will fall in value and vice versa. Morningstar's portfolio statistics will capture this negative exposure. For example, if a fund has many short stock positions, the percent of assets in stocks in the asset allocation breakdown may be negative. Funds must provide their broker with cash collateral for the short position, so funds that short often have a large cash position, sometimes even exceeding 100% cash. Note that all other portfolio statistics presented in this report are based on the long holdings of the fund only. Equity Portfolio Statistics The referenced data elements below are a weighted average of the equity holdings in the portfolio. The Price/Earnings ratio is a weighted average of the price/earnings ratios of the stocks in the underlying fund's portfolio. The P/E ratio of a stock is calculated by dividing the current price of the stock by its trailing 12-months' earnings per share. In computing the average, Morningstar weights each portfolio holding by the percentage of equity assets it represents. The Price/Cash Flow ratio is a weighted average of the price/cash-flow ratios of the stocks in a fund's portfolio. Price/cash-flow shows the ability of a business to generate cash and acts as a gauge of liquidity and solvency. The Price/Book ratio is a weighted average of the price/book ratios of all the stocks in the underlying fund's portfolio. The P/B ratio of a company is calculated by dividing the market price of its stock by the company's per-share book value. Stocks with negative book values are excluded from this calculation. The geometric average market capitalization of a fund's equity portfolio offers a measure of the size of the companies in which the mutual fund invests. Fixed-Income Portfolio Statistics The referenced data elements below are a weighted average of the fixed income holdings in the portfolio. Duration is a time measure of a bond's interest rate sensitivity. Average effective duration is a weighted average of the duration of the underlying fixed income securities within the portfolio. Average effective maturity is a weighted average of all the maturities of the bonds in a portfolio, computed by weighting each maturity date by the market value of the security. Average credit quality is calculated by taking the weighted average of the credit rating for each bond in the portfolio. Average weighted coupon is generated from the fund's portfolio by weighting the coupon of each bond by its relative size in the portfolio. Coupons are fixed percentages paid out on a fixed-income security on an annual basis. Average weighted price is generated from the fund's portfolio by weighting the price of each bond by its relative size in the portfolio. This number reveals if the fund favors bonds selling at prices above or below face value (premium or discount securities, respectively). A higher number indicates a bias toward premiums. This statistic is expressed as a percentage of par (face) value. Turnover Ratio is a decent proxy for how frequently a manager trades his or her portfolio. The inverse of a fund's turnover ratio is the average holding period for a security in the fund. As turnover increases, a fund's brokerage costs typically rise as well. Operations Purchase constraints denote if a mutual fund has any of the following qualities: Qualified Access (A), Institutional (T), Closed to New Investments, (C) or Closed to All Investments (L). Because these qualities can all act as restrictions and/or requirements for investment, they are grouped together. Potential capital gains exposure is the percentage of a mutual fund's total assets that represent capital appreciation. Investment Risk International Funds/Emerging Market Funds: The investor should note that funds that invest in international securities involve special additional risks. These risks include, but are not limited to, currency risk, political risk, and risk associated with varying accounting standards. Investing in emerging markets may accentuate these risks. Sector Funds: The investor should note that funds that invest exclusively in one sector or industry involve additional risks. The lack of industry diver- sification subjects the investor to increased industry-specific risks. Non-Diversified Funds: The investor should note that funds that invest more of their assets in a single issuer involve additional risks, including share price fluctuations, because of the increased concentration of investments. Small-Cap Funds: The investor should note that funds that invest in stocks of small companies involve additional risks. Smaller companies typically have a higher risk of failure, and are not as well established as larger blue-chip companies. Historically, smaller-company stocks have experienced a greater degree of market volatility that the overall market average. Mid Cap Funds: The investor should note that funds that invest in companies with market capitalization below $10 billion involve additional risks. The securities of these companies may be more volatile and less liquid than the securities of larger companies. High-Yield Bond Funds: The investor should note that funds that invest in lower-rated debt securities (commonly referred as junk bonds) involve additional risks because of the lower credit quality of the securities in the portfolio. The investor should be aware of the possible higher level of volatility, and increased risk of default. Tax-Free Municipal Bond Funds: The investor should note that the income from tax-free municipal bond funds may be subject to state and local taxation and the Alternative Minimum Tax. Page 5 of 6 © 2013 Morningstar, Inc. All rights reserved. The information, data, analyses and opinions contained herein (1) include the confidential and proprietary information of Morningstar, (2) may include, or be derived from, account information provided by your financial advisor which cannot be verified by Morningstar, (3) may not be copied or redistributed, (4) do not constitute investment advice offered by Morningstar, (5) are provided solely for informational purposes and therefore are not an offer to buy or sell a security, and (6) are not warranted to be correct, complete or accurate. Except as otherwise required by law, Morningstar shall not be responsible for any trading decisions, damages or other losses resulting from, or related to, this information, data, analyses or opinions or their use. This report is supplemental sales literature. If applicable it must be preceded or accompanied by a prospectus, or equivalent, and disclosure statement. Please read the prospectus carefully.
  • 6. Benchmark Disclosure Barclays Aggregate Bond TR Govt/Credit Index, the Mortgage-Backed Securities Index, and the Asset-Backed Securities Index. Morningstar Lifetime Moderate 2035 The Morningstar Lifetime Moderate 2035 Index represents a portfolio of global equities, bonds and traditional inflation hedges such as commodities and TIPS. This portfolio is held in proportions appropriate for a U.S. investor who is about 25 years away from retirement. The Moderate risk profile is for investors who are comfortable with average exposure to equity market volatility. S&P 500 TR A market capitalization-weighted index of 500 widely held stocks often used as a proxy for the stock market. Page 6 of 6 © 2013 Morningstar, Inc. All rights reserved. The information, data, analyses and opinions contained herein (1) include the confidential and proprietary information of Morningstar, (2) may include, or be derived from, account information provided by your financial advisor which cannot be verified by Morningstar, (3) may not be copied or redistributed, (4) do not constitute investment advice offered by Morningstar, (5) are provided solely for informational purposes and therefore are not an offer to buy or sell a security, and (6) are not warranted to be correct, complete or accurate. Except as otherwise required by law, Morningstar shall not be responsible for any trading decisions, damages or other losses resulting from, or related to, this information, data, analyses or opinions or their use. This report is supplemental sales literature. If applicable it must be preceded or accompanied by a prospectus, or equivalent, and disclosure statement. Please read the prospectus carefully.