This document provides a quarterly report on the General Conference of Seventh-Day Adventists' Emerging Markets fund as of December 31, 2015. It includes performance figures for the fund compared to its benchmark over various time periods. It also lists the geographic and sector allocations of the fund, as well as information on the fund's investment managers, fees, and risk statistics.
1. GC Emerging Markets 12/31/2015
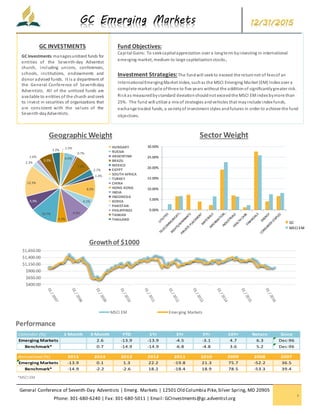
General Conference of Seventh-Day Adventists | Emerg. Markets | 12501 Old Columbia Pike,Silver Spring, MD 20905
Phone: 301-680-6240 | Fax: 301-680-5011 | Email: GCInvestments@gc.adventist.org
1
.
Calendar (%) 1 Month 3 Month YTD 1Yr 3Yr 5Yr 10Yr Return Since
Emerging Markets 2.6 -13.9 -13.9 -4.5 -3.1 4.7 6.3 Dec-96
Benchmark* 0.7 -14.9 -14.9 -6.8 -4.8 3.6 5.2 Dec-96
Annualized (%) 2015 2014 2013 2012 2011 2010 2009 2008 2007
Emerging Markets -13.9 0.1 1.3 22.2 -19.8 21.3 75.7 -52.2 36.5
Benchmark* -14.9 -2.2 -2.6 18.2 -18.4 18.9 78.5 -53.3 39.4
0.00%
5.00%
10.00%
15.00%
20.00%
25.00%
30.00%
Sector Weight
GC
MSCI EM
$400.00
$650.00
$900.00
$1,150.00
$1,400.00
$1,650.00
Growthof $1000
MSCI EM Emerging Markets
1.5%
4.6%
0.7%
7.2%
2.7%
1.4%
8.0%
4.1%
9.9%
4.3%
10.7%
5.9%
12.5%
2.2%
1.6%
5.5%
3.2%
Geographic Weight
HUNGARY
RUSSIA
ARGENTINA
BRAZIL
MEXICO
EGYPT
SOUTH AFRICA
TURKEY
CHINA
HONG KONG
INDIA
INDONESIA
KOREA
PAKISTAN
PHILIPPINES
TAIWAN
THAILAND
2. GC Emerging Markets 12/31/2015
General Conference of Seventh-Day Adventists | Emerg. Markets | 12501 Old Columbia Pike,Silver Spring, MD 20905
Phone: 301-680-6240 | Fax: 301-680-5011 | Email: GCInvestments@gc.adventist.org
2
AB is a leadingglobal investment-management andresearch firm with
$479 billionin assets under management. AB brings together a wide
range of insights, expertise andinnovations to advance the interests of
clients aroundthe world. Drivenbydistinctive research insights, AB
provides a comprehensive suite ofstrategies across geographies,
capitalizationrangesandinvestment styles—all focused onachieving
outcomes that matter to our clients. AB has a comprehensive range of
services around the world witha footprint in46 locations and 21
countries.
Since 1848, Lazardhas remaineda trustedadvisor to governments,
financial institutions, public andprivate retirement plans, and
individuals aroundthe world. The firm provides an arrayof strategies
to meet clients’ diverse objectives. Lazard’s investment professionals
operate independentlyandcollaborate globally, vettingour best ideas
through rigorous analysis to deliver the returnpatterns our clients
expect. Lazard Asset Management manages US$167.8 billion ofassets
aroundthe worldacross a broad spectrumof asset classes.
ImportantDisclosures:
This report is intended solely for the use of investors in the GC Unitized Funds and is not intended as an offer or solicitation with respect to
the purchase or sale of any security.
Past results are not indicative of future investment results. Investments are not guaranteed and youmaylose money. This publication is for
informational purposes onlyand reflects the current opinions of the General Conference Investment Office. Information containedherein is
believedto be accurate, but cannot be guaranteed. Opinions expressedinthis material maybe subject to change without notice. Statements
in this material shouldnot be consideredinvestment advice. This publicationhas beenpreparedwithout taking into account your objectives,
financial situation or needs. Before acting onthis information, you shouldconsider its appropriatenesshaving regard to you r objectives,
financial situation or needs. It is your responsibilityto be aware of and observe the applicable laws and regulations of your countryof
residence. Potential investors inemerging markets should be aware that investment inthese markets caninvolve a higher degree ofrisk. Any
forecast, projection or target is there to provide youwith anindication onlyandis not guaranteed inanyway.
|Fund Fees|
Account Fee Fee Schedule
- GC Operating Fee 0.035%
- Management Fee
(Madison& Western) 0.240% (Est.)
Total Fees: 0.275% (Est.)
|Risk/Return Statistics|
(As of December 31, 2015)
Summary Stats GC Bond Fund Barclays Index
Number of Periods 228 228
Maximum Return 16.32 17.09
Minimum Return - 28.75 - 28.91
AnnualizedReturn 6.26 5.17
Total Return 217.01 160.48
AER over Risk Free 4.04 2.95
AnnualizedExcess Return (AER) 1.09 0.00
Beta 0.89 1.00
Upside Deviation 13.88 13.51
DownsideDeviation 17.91 18.27
AnnualizedStandard Deviation 22.94 24.14
Alpha 0.13 0.00
Sharpe Ratio 0.18 0.12
Excess Return over Market / Risk 0.05 0.00
Tracking Error 8.24 0.00
Information Ratio 0.13 0.00
R-Squared 0.88 1.00
Correlation 0.94 1.00
| |
47.2%
41.7%
11.1%
Asset Allocation
LAZARD EM
ALLIANCE BERNSTEIN
CASH