Jigsaw Academy Digital India Contest - Kerala & Tamil Nadu
•
1 like•1,882 views

Digital Inclusion in Rural India

Recommended
Recommended
More Related Content
Viewers also liked
Viewers also liked (18)
Similar to Jigsaw Academy Digital India Contest - Kerala & Tamil Nadu
Similar to Jigsaw Academy Digital India Contest - Kerala & Tamil Nadu (20)
More from Jigsaw Academy
More from Jigsaw Academy (8)
Recently uploaded
Recently uploaded (20)
Jigsaw Academy Digital India Contest - Kerala & Tamil Nadu
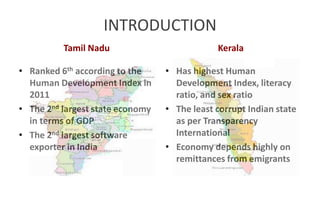
- 1. INTRODUCTION Tamil Nadu Kerala • Has highest Human Development Index, literacy ratio, and sex ratio • The least corrupt Indian state as per Transparency International • Economy depends highly on remittances from emigrants • Ranked 6th according to the Human Development Index in 2011 • The 2nd largest state economy in terms of GDP • The 2nd largest software exporter in India
- 2. Objectives of 1998 IT Task Force includes: • Transforming over 600,000 existing Public Telephones/Public Call Offices (PCOs) into public tele-info-centres offering a variety of multimedia information services. • Spreading IT awareness among the citizens and rural penetration of IT applications. • Allowing Cable TV service providers to provide access to internet through authorised Cable TV infrastructure, without additional licensing. • Making IT more easily available, affordable, and to boost export through several financial and legal benefits to the IT products and software providers. • Encouraging the setting up of value-added network services (e.g. ATMs)
- 3. Brief Summary of Digital Penetration: • In Kerala, on an average 11.2% households have computer among which 3.8% have internet connection. In Tamil Nadu, 4.4% household have computer among which 0.9% have internet connection. • In Kerala, Land Phone and Mobile penetration stand at 41.9% and 76.8% respectively, while in Tamil Nadu these percentages stand at 8.7% and 60.8%. • In Kerala, 94.7% villages have PCOs while 68.5% have internet cafes. In Tamil Nadu, 72.8% villages have PCOs while only 7.2% have internet cafes. • Villages in Kerala receives domestic power supply for 23.6 hours a day, while villages in Tamil Nadu receives power for 16.0 hours a day on an average.
- 4. • Averages in Tamil Nadu and Kerala stand at 4.4% and 11.2% respectively. • Tamil Nadu villages have more dispersed data, but plots are showing narrower range because sub- district level data is used for Tamil Nadu for better identification of descriptive parameters.
- 5. 0 50 100 150 200 250 300 350 400 0% 3% 6% 9% 12% 15% 18% 21% 24% 27% 30% Computer penetration - Rural Kerala • The Digitalization in Kerala seems to be normally distributed with the data being evenly distributed around its mean, as the histograms are taking a bell curve shape. It is positively skewed in Tamil Nadu with 72.3% data falling below the mean, and the mean being almost twice the median (4.4% vs. 2.6%). • Around 68.5% villages in Kerala have internet cafes / Common Service centres while it is 7.2% in Tamil Nadu. • Among the villages with population of 1,000 or more in Tamil Nadu, 90.8% villages show 10% or lesser penetration. The remaining villages with penetration ratio of 10-95% are not covered in the above chart. 0 500 1000 1500 2000 2500 3000 0% 1% 2% 3% 4% 5% 6% 7% 8% 9% 10% Computer Penetration (<=10%) in Rural Tamil Nadu
- 6. Rural Tamil Nadu (%) Urban Tamil Nadu (%) Rural Kerala (%) Urban Kerala (%) Minimum 0.0 0.3 0.4 5.8 First Quartile 1.4 5.1 8.1 13.2 Median 2.6 8.5 10.9 15.9 Mean 4.4 10.8 11.2 17.3 Third Quartile 4.8 13.4 14.0 20.0 Maximum 94.8 57.3 28.6 55.6 Standard Deviation 6.12 8.20 4.41 6.13 • Tamil Nadu shows higher deviation with lower average, while Kerala shows more consistent digitalization with higher average. • The Gap between rural and urban digitalization is much lower in Kerala as compared to Tamil Nadu. • Urban data does not include Chennai for Tamil Nadu as, being a megacity, data from Chennai would not be comparable to other urban areas. Summary of Rural and Urban Digitalization:
- 7. Mobile Phone Usage and Digitalization: • In Kerala, 41.9% household relies on Land Phone as compared to only 8.7% in Tamil Nadu, while 60.8% in Tamil Nadu rely on Mobile Phone as compared to 76.1% in Kerala. • Digitalization in Kerala shows correlations of 0.59 and 0.30 with Land Phone and Mobile phone respectively. In a contrast, Tamil Nadu shows 0.23 and 0.54. • It appears that Mobile penetration in villages near the towns are having stronger positive relation with digitalization, probably because of proximity to other amenities. Mobile penetration is consistent across distances in Kerala (at 76%) and ranges from 59.5% to 63.0% in Tamil Nadu.
- 8. Land Phone Usage and Digitalization: • In Kerala, villages within 5km to town are having 46.1% Land Phone penetration as compared to 40.0% for villages beyond 10km. In Tamil Nadu, the difference is less as it ranges from 9.7% to 8.3% across distances. • Land Phone being the most common channel to access internet in villages, the potential to expand internet is higher in Kerala, and it would require some infrastructure development in Tamil Nadu to reach at similar level.
- 9. Land Phone Usage and Internet: • Among 11.2% households having Computer, only 3.8% have internet connection in Kerala. In Tamil Nadu, among 4.4% households having computer, only 0.9% have internet connection. • Kerala shows 0.63 correlation of internet connection and Land Phone, while Tamil Nadu shows 0.28.
- 10. • Kerala shows smaller difference in female literacy and overall literacy • Both the states show positive relation of female literacy with digitalization, with correlation of 0.40 and 0.52 for Tamil Nadu and Kerala • Overall literacy ratio also shows the similar positive relation, with slightly lower correlations • Tamil Nadu shows higher percentage of working population for overall as well as female • Both states show negative relation with overall as well as female working population with correlations ranging from (0.40) to (0.45) • Overall working population also show similar negative relation • Is the Digitalization driven only by younger population (students) with less participation from working people? Literacy, Working Population (Overall and within Female Population) and Digitalization:
- 11. • Around 52.6% working people depend on Agriculture in Tamil Nadu, while 19.7% do in Kerala. • Tamil Nadu shows (0.57) correlation while Kerala shows (0.42) • Dependence in measured by cultivators and agricultural labour population as a percentage of working population Agriculture, size of House and Household and Digitalization? • Around 80.0% houses in villages of Tamil Nadu have zero to two rooms, while in Kerala it is 31.5% • percentage of smaller houses show around (0.40) correlation in the both states • However, digitalization does not show meaningful correlation with household size in terms of number of members. • For this plot and correlation, smaller house is defined as <3 rooms for Tamil Nadu and <4 rooms for Kerala.
- 12. Demographic Differences Between States: • While Tamil Nadu and Kerala shows similar correlation with treated tap water, the Kerala Village data shows non-linear relation with (0.11) correlation as compared to 0.05 in Tamil Nadu • At Sub-District level, the correlation in both states are between 0.19 and 0.23. • In Kerala, 15% household have bicycles while it is 47% in Tamil Nadu • In a stark difference, Kerala shows 0.31 correlation as against (0.24) in Tamil Nadu. • Possibly, higher bicycle in Kerala means more plain areas where development has concentrated, while in Tamil Nadu it means remote villages.
- 13. Availability of Amenities and Digitalization: The x-axis covers till 10% digitalization for Tamil Nadu (91% of large villages) and 25% for Kerala (nearly 100% of villages).
- 14. Availability of Amenities and Digitalization: The x-axis covers till 10% digitalization for Tamil Nadu (91% of large villages) and 25% for Kerala (nearly 100% of villages). NOTES: • Higher level of digitalization is observed closer to the amenities including school, health centre, post office, banks and ATMs. It is not closely related to public or private bus facility. • Around 34.7% and 83.1% villages have secondary school in Tamil Nadu and Kerala respectively. The percentages of healthcare centre stood at 10.7% and 56.5%. •In Tamil Nadu the availability matters more than the distance, as the peaks for different ranges of distance are falling more closely. In Kerala, the different ranges of distance have distinct peaks.
- 15. • With much larger percentages of households having TV and/or Motorcycles – This plot shows that having a computer has much lower priority for households when compared to TV and Motorcycle, even when they can afford similar assets – it appears that the awareness about the benefit of digitalization is bigger hurdle than affordability • Kerala shows higher computer penetration and percentages household having motorcycle, and lower percentage of household having television Other Household Amenities and Digitalization: *These plots show the Tehsil level data, with Tehsils in x-axis
- 16. Commercial Banks and ATMs: • As evident from the percentages of villages having ATM compared to having Banks– The target of setting up of value-added network services needs to be emphasized further. • In Tamil Nadu 22% villages have Banks while 4% have ATMs, as compared to 96% and 42% respectively in kerala -As a percentage, the gap is wider in Tamil Nadu, so it will reap more benefit if ATM facility is expanded in all the banks. • However, still the coverage will be lower due to lower percentage of villages having banks *These plots show the Tehsil level data, with Tehsils in x-axis
- 17. Internet Cafe and Other Amenities: • With only 7% villages having Internet Cafe as compared to 73% having PCO in Tamil Nadu – a lot is left to be desired in terms of converting PCOs into information service centres. • In Kerala, 69% villages have internet cafe while 99% have PCO • Tamil Nadu has post offices in 10% villages while Kerala has in 95% villages, so even if information centre is established in all such government facilities, there will be much larger gap to cover in Tamil Nadu *These plots show the Tehsil level data, with Tehsils in x-axis
- 18. Decision Tree Analysis for Digitalization in Rural Tamil Nadu:
- 19. Decision Tree Analysis for Digitalization in Rural Kerala:
- 20. Summary of Regression Analysis: Tamil Nadu Kerala Positive coefficients with high significance • Having Land Phone/ Mobile • Good condition of Household • Access to treated tap water • Working population • Having Latrine within house • Having Land Phone/ Mobile • Good condition of Household • Water source within house • LPG/PNG connection • Female literacy ratio Positive coefficients with questionable significance • Water source within house • LPG/PNG connection • Having Television Negative coefficients with high significance • Dependence on Agriculture • Having Television • Female literacy ratio • Dependence on Agriculture • Working population Negative coefficients with questionable significance • Distance from Town • Domestic power - hours per day • Access to treated tap water • The regression model for Tamil Nadu shows much lower Adjusted R2 than that for Kerala, implying less predictive power, most likely due to dispersed data. As such, regression result from Kerala can be relied upon in the case of any contradiction. • Female literacy ratio in Tamil Nadu is showing negative relation while percentage of working population is showing positive relation, which contradicts the results from Kerala and also the study of correlations for Tamil Nadu – hence these can be ignored for the above mentioned reason. • Kerala shows access to treated tap water as a negative factor, which is counter-intuitive but is confirmed through study of correlations.
- 21. Key Observations: Based on Study of correlations, visualization, Decision Tree and Regression analyses, following observations are made: • Digitalization seem to be the second priority after a good living condition: o Villages with higher level of Good households, in-house water supply and sanitation within house, LPG/PNG connection and Literacy ratio are showing higher level of digitalization o However, Access to treated tap water, availing banking services and hours of availability of domestic power per day do not show very strong relation with digitalization o Bigger houses and households with motor vehicles have shown higher digitalization • Both Land Phone and Mobile show strong positive relation with Digitalization. The correlation is stronger with Land Phone in Kerala while in Tamil Nadu it is stronger with Mobile – may be because low penetration of Land Phone in Tamil Nadu. • Villages with higher dependence on Agriculture are showing lesser penetration • Digitalization rate is higher in villages near towns and having amenities such as secondary schools and health centres. • Working population is not driving the digitalization
- 22. Recommendation: Based on the analysis conducted and observation made, below are some recommendations: • Digitalization seems to be the second priority after a good living condition, so overall living condition has to be improved. The parameters include Literacy, household amenities such as access to treated water, LPG, Land Phone etc among others. While these developments are a bigger goal in itself, it will drive digitalization too. • The level of e-governance ,and digitalization of other services e.g. Banking, have not gained much traction yet. As such, working population is showing negative correlation with digitalization. Increased level of e-governance will save time and money and improve lifestyle of working people, which would give a big push towards digitalization. • The level of digitalization is comparatively lower in the remote villages, and villages which are depending more on Agriculture. Higher level of e-governance, online Agriculture helpline or tutorials along with overall expansion of literacy and other developments should improve the scenario. Cont.
- 23. Recommendation: Based on the analysis conducted and observation made, below are some recommendations: • The target of transforming PCOs into public information centre has left a lot to be expected as the availability of internet cafes are much lower than the PCOs. This needs to be considered with higher priority for a higher level of internet penetration. • Additionally, if the premises for public amenities such as post offices are appended with public-tele-info centre, it will boost digitalization further . • The prices for entry level computer fit for fulfilling basic requirements should be slashed . Manufacturing of Indian brand with indigenous component and tax benefits for such manufacturing and distribution could be possible ways to achieve it. • Infrastructure development is required in terms of Land Phone penetration and expansion, along with other channels of internet such as cable connection. • Setting up of value-added network services such as ATMs need to be improved as the villages in both states have more branches of commercial banks than ATMs.
- 25. Appendix
- 26. Assumptions • Villages in Tamil Nadu with 0-100 population are not included in analysis. Further, <1000 population villages are also excluded as those were leading to non definitive trends due to extreme data. • For the purpose of visualization and study of the interaction of the variables, the sub-district level data is used for Tamil Nadu, while village level data is used for Kerala as the trends are prominent • Urban data does not include Chennai for Tamil Nadu as, being a megacity, data from Chennai would not be comparable to other urban areas. • The measure for Digitalization is considered to be the sum of percentages of computer with without internet, unless otherwise specified.
- 27. Visualization with Village level data in Tamil Nadu Because the village level data in Tamil Nadu is highly dispersed, positively skewed, and not showing any definitive trend, the Sub-District Level data is used for visualization and study of correlation. E.g. LPG/PNG in Tamil Nadu shows 0.13 and 0.57 correlations with village data and Sub-District data respectively.
- 28. ONLY Mobile Phone Usage and Digitalization: (previously used)
- 29. Logistic Regression for Kerala ..and Linear regression with same variables •Initially it seemed that logistic regression will be more appropriate for probability data as dependent variable, however, looking at the linear model resulting in more statistically significant coefficients – it seems linear model might be better fit here. •I have asked this to Jigsaw and awaiting a response
- 30. • For most of the variables the 10-50% group is showing more developed population or amenities than those in the 50% plus group • Only 0.2% have more than 50% penetration, while 9% have penetration between 10-50% • Based on this observation, it can be considered that the highest penetration group is actually outlier • Question is where should the range of outlier begin • Removed 30%+ penetration to rerun regression, resulted in 138 row removal (1.25%) • The high percentages among the larger villages are more concentrated around Kancheepuram, Ramanathapuram and Virudhunagar districts among others (concentration ranges from 0.4% to 3.3%) Checking Tamil data for ranges of computer penetration
- 31. Regression of Tamil data with and without outliers
- 32. The linear regression model that is finalized
Editor's Notes
- From Wikipedia
- VARIABLES CONSIDERED: Good.Houses + Small.Houses + drink.t.tap + Water.in.HH+ light.elect + LPG.PNG+ avail.banking.ha + Land.Phone + Mobile+ p.lit + Female.Literacy + Working.Pop+ tot.work.f + Agriculture+ mar.p + power.domestic.hours
- VARIABLES CONSIDERED: Good.Houses + Small.Houses + drink.t.tap + Water.in.HH+ light.elect + LPG.PNG+ avail.banking.ha + Land.Phone + Mobile+ p.lit + Female.Literacy + Working.Pop+ tot.work.f + Agriculture+ mar.p + power.domestic.hours