Izasa.App-notes-Acea.Migracion-invasion
•
1 like•3,581 views

Notas de aplicación, catálogo y publicaciones relevantes de Acea. Migración e Invasion

Recommended
Recommended
More Related Content
What's hot
What's hot (20)
Similar to Izasa.App-notes-Acea.Migracion-invasion
Similar to Izasa.App-notes-Acea.Migracion-invasion (20)
Recently uploaded
Recently uploaded (20)
Izasa.App-notes-Acea.Migracion-invasion
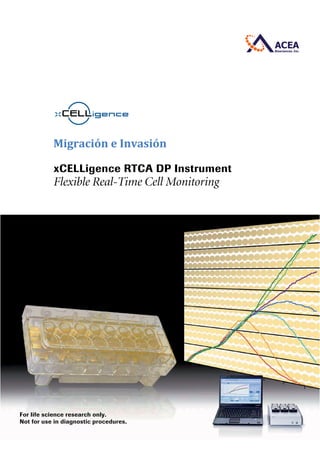
- 1. xCELLigence RTCA DP Instrument Flexible Real-Time Cell Monitoring For life science research only. Not for use in diagnostic procedures. Migración e Invasión
- 2. RTCA Control Unit RTCA DP Analyzer The RTCA DP Instrument expands the throughput and application options of the xCELLigence Real-Time Cell Analyzer (RTCA) portfolio. Featuring a dual-plate (DP) format, the instrument measures impedance-based signals in both cellular and cell invasion/migration (CIM) assays – without the use of exogenous labels. With outstanding application flexibility, the RTCA DP Instrument supports multiple users performing short-term and long-term experiments. The xCELLigence RTCA DP Instrument Flexible Real-Time Cell Monitoring Explore the wide range of applications „ Cell invasion and migration assays „ Compound- and cell-mediated cytotoxicity „ Cell adhesion and cell spreading „ Cell proliferation and cell differentiation „ Receptor-mediated signaling „ Virus-mediated cytopathogenicity „ Continuous quality control of cells Figure 1: Reveal cytotoxic effects through continuous monitoring. HT1080 cells were seeded in an E-Plate at two different densities (5,000 and 10,000 cells) and treated 24 hours later with 12.5 nM Paclitaxel, or DMSO as a control. As shown by the Cell Index profile, which reflects cell adherence, the antimitotic effect of Paclitaxel was observed in HT1080 cells that were proliferating, whereas confluent cells showed no response. Cytotoxicity Analysis in E-Plates The xCELLigence System continuously and non-invasively detects cell responses throughout an experiment, without the use of exogenous labels that can disrupt the natural cell environment. „ Obtain complete, continuous data profiles from cell responses generated during in vitro experiments (Figure 1). „ Take advantage of real-time data to identify optimal time points for downstream assays. „ Combine real-time monitoring of cellular responses with complementary functional endpoint assays, and maximize data quality before, during, and after your experiment. Compact. Convenient. Versatile. The RTCA DP Instrument consists of two components: the RTCA Control Unit and the RTCA DP Analyzer with three integrated stations for measuring cell responses in parallel or independently. „ Choose from three types of impedance-based 16-well plates: — E-Plate 16 and E-Plate VIEW 16 for cellular assays — CIM-PLATE 16 for cell invasion/migration assays „ Use all three different plate types in any combination. „ Easily achieve optimal cell culture conditions by placing the RTCA DP Analyzer and plates into standard CO2 incubators. 2
- 3. E-Plate 16 and E-Plate VIEW 16: Cellular Assays in a 16-Well Format „ Quantitatively monitor changes in cell number, cell adhesion, cell viability, and cell morphology. „ Easily add compounds during an experiment. „ Assess short- and long-term cellular effects. „ With the E-Plate VIEW 16, observe measured changes using microscopes. E-Plate 16 E-Plate 16 E-Plate VIEW 16 500 μm Obtain detailed information about your cells with the versatile RTCA DP Instrument, which supports up to three plates of any type – E-Plate 16, E-Plate VIEW 16, or CIM-Plate 16 – in any combination. For example, cell invasion/migration assays and cytotoxicity assays or short- and long-term assays may be run simultaneously. E-Plates for the RTCA DP Instrument More Flexibility. More Data. More Insight. Figure 3: Continuously monitor cells and determine optimal time points for assessing cytotoxicity. Cell proliferation and cell death were continuously monitored using the xCELLigence RTCA DP Instrument. The optimal time points for visual inspection of HeLa cells were determined and images taken 4 and 22 hours after compound treatment using a Z16 Apo Microscope with light base (Leica Microsystems). Control 300 μM Antimycin A NormalizedCellIndex 1.9 0.9 -0.1 9 18 27 36 45 54 Time (Hours) Antimycin A administration Control 5 μM 100 μM 300 μM 4 h 22 h Figure 2: Easily visualize cells while measuring cell response with xCELLigence System E-Plate VIEW technology. A modified version of the standard E-Plate 16, the E-Plate VIEW 16 enables image acqui- sition using microscopes or automated cell-imaging systems. For the modification, four rows of microelectrode sensors were removed in each well to create a window for visualizing cells. Approximately 70% of each well bottom is covered by the microelectrodes, providing cell impedance measurements nearly identical to those obtained with the standard E-Plate 16. Both plate types can be used in parallel. 3
- 4. CIM-Plate 16 Lid Microelectrodes Microporous Membrane Adherent Cell Upper Chamber Cells Gel Layer (user provided) Chemoattractant Lower Chamber CIM-Plate 16: Quantitative Cell Invasion/Migration Analysis „ Monitor cell invasion and migration continuously in real time over the entire time course of an experiment. „ Eliminate time-consuming manual detection (Figure 4). „ Perform CIM analysis in a convenient one-well system (Figure 5). Figure 4: Quantitatively measure the rate and onset of invasion while concurrently assessing migration. HT1080 cells (2 x 10⁴) were seeded in the upper chamber of CIM-Plate wells coated with varying dilutions of Matrigel, or in wells with no coating. Serum was added to the lower chamber of selected wells as a chemoattractant. Invasion was observed and migration monitored continuously over a 70-hour period. All serum-starved samples resulted in base-line Cell Index levels, indicating the absence of invasion/migration, while those wells with chemoattractant induced migration. Invasion/Migration Analysis in CIM-Plates Figure 5: Analyze invasion/migration in real time with the CIM-Plate 16. The plate features two separable sections for ease of experimental setup. Cells seeded in the upper chamber move through the microporous membrane into the lower chamber that contains a chemoattractant. Cells adhering to the microelectrode sensors lead to an increase in impedance, which is measured in real time by the RTCA DP Instrument. 4
- 5. E-Plate Insert 16: Co-Culture in Real-Time „ Continuously monitor indirect cell-cell interactions. „ Assess short- and long-term cell response without labor-intensive labeling and microscopy. „ Co-culture different cell typtes under physiological conditions for a broad range of applications, including: Cancer Research: Assess paracrine stimulation of cancer cell proliferation by fibroblasts. Immunology: Investigate immune cell interactions. Stem Cell Research: Monitor proliferation and differentiation in the presence of stimulation cells. Toxicology: Determine cytotoxicity of agents and assess effects of cytokine release. Figure 6. Real-time monitoring of co-culture-induced proliferation stimulation and its inhibition using the E-Plate Insert. Intercellular interactions play an important role in normal cell development and tumorigenesis. Results show that the proliferation of hormone-responsive tumor cells is likely mediated by hormones and growth factors exchanged between the two cell populations separated by the E-Plate Insert. Elevated T47D cell proliferation on the E-Plate (green trace „ ) was induced by hormone secretion of H295R cells in the insert, and inhibited by the hormone synthesis inhibitor Prochloraz (blue trace „ ). Incubation of T47D cells with only the E-Plate Insert did not affect proliferation (red trace „ ). Lid E-Plate 16 E-Plate Insert 5
- 6. 1. Cell Invasion and Migration MicroRNA-200c Represses Migration and Invasion of Breast Cancer Cells by Targeting Actin-Regulatory Proteins FHOD1 and PPM1Ferences. Jurmeister S, Baumann M, Balwierz A, Keklikoglou I, Ward A, Uhlmann S, Zhang JD, Wiemann S, Sahin O. Mol Cell Biol. 2012; 32(3):633–651. c-Myb regulates matrix metalloproteinases 1/9, and cathepsin D: implications for matrix-dependent bre- ast cancer cell invasion and metastasis. Knopfová L, Beneš P, Pekarēíková L, Hermanová M, MasaƎík M, Pernicová Z, Souēek K, Smarda J. Mol Cancer. 2012; 11:15. Comparative Analysis of Dynamic Cell Viability, Migration and Invasion Assessments by Novel Real- Time Technology and Classic Endpoint Assays. Limame R, Wouters A, Pauwels B, Fransen E, Peeters M, Lardon F, De Wever O, Pauwels P. PLoS One. 2012; 7(10): e46536. 2. Compound-mediated Cytotoxicity/Apoptosis Screening and identification of small molecule compounds perturbing mitosis using time-dependent cellular response profiles. Ke N, Xi B, Ye P, Xu W, Zheng M, Mao L, Wu MJ, Zhu J, Wu J, Zhang W, Zhang J, Irelan J, Wang X, Xu X, Abassi YA. Anal Chem. 2010; 82(15):6495-503. Kinetic cell-based morphological screening: prediction of mechanism of compound action and off-target effects. Abassi YA, Xi B, Zhang W, Ye P, Kirstein SL, Gaylord MR, Feinstein SC, Wang X, Xu X. Chem Biol. 2009; 16(7):712-23. 3. Cell-mediated Cytotoxicity Real-time profiling of NK cell killing of human astrocytes using xCELLigence technology. Moodley K, Angel CE, Glass M, Graham ES. J Neurosci Methods. 2011; 200(2): 173-180. Unique functional status of natural killer cells in metastatic stage IV melanoma patients and its modula- tion by chemotherapy. Fregni G, Perier A, Pittari G, Jacobelli S, Sastre X, Gervois N, Allard M, Bercovici N, Avril MF, Caignard A. Clin Cancer Res. 2011; 17(9): 2628–37. 4. Cell Adhesion and Cell Spreading A role for adhesion and degranulation-promoting adapter protein in collagen-induced platelet activati- on mediated via integrin a2b1. Jarvis GE, Bihan D, Hamaia S, Pugh N, Ghevaert CJ, Pearce AC, Hughes CE, Watson SP, Ware J, Rudd CE, Farndale RW. Journal of Thromb Haemost. 2012; 10(2): 268–277. Dynamic monitoring of cell adhesion and spreading on microelectronic sensor arrays. Atienza JM, Zhu J, Wang X, Xu X, Abassi Y. J Biomol Screen. 2005; 10(8): 795-805. Selected Publications for the RTCA DP Instrument 6
- 7. 5. Receptor-mediated Signaling Impedance responses reveal b2-adrenergic receptor signaling pluridimensionality and allow classifica- tion of ligands with distinct signaling profiles. Stallaert W, Dorn JF, van der Westhuizen E, Audet M, Bouvier M. PLoS One. 2012; 7(1): e29420. Label-free impedance responses of endogenous and synthetic chemokine receptor CXCR3 agonists cor- relate with Gi-protein pathway activation. Watts AO, Scholten DJ, Heitman LH, Vischer HF, Leurs R. Biochem Biophys Res Commun. 2012; 419(2):412-8. Impedance measurement: A new method to detect ligand-biased receptor signaling. Kammermann M, Denelavas A, Imbach A, Grether U, Dehmlow H, Apfel CM, Hertel C. Biochem Biophys Res Commun. 2011; 412(3): 419-424. 6. Virus-mediated Cytopathogenicity Novel, real-time cell analysis for measuring viral cytopathogenesis and the efficacy of neutralizing anti- bodies to the 2009 influenza A (H1N1) virus. Tian D, Zhang W, He J, Liu Y, Song Z, Zhou Z, Zheng M, Hu Y. PloS One. 2012; 7(2):e31965. Real-time monitoring of flavivirus induced cytopathogenesis using cell electric impedance technology. Fang Y, Ye P, Wang X, Xu X, Reisen W. J Virol Methods. 2011; 173(2):251–8. 7. Quality of Control of Cells Rapid and quantitative assessment of cell quality, identity, and functionality for cell-based assays using real-time cellular analysis. Irelan JT, Wu MJ, Morgan J, Ke N, Xi B, Wang X, Xu X, Abassi YA. J Biomol Screen. 2011; 16(3):313-22. Live cell quality control and utility of real-time cell electronic sensing for assay development. Kirstein SL, Atienza JM, Xi B, Zhu J, Yu N, Wang X, Xu X, Abassi YA. Assay Drug Dev Technol. 2006; 4(5):545-53. 8. Endothelial Barrier Function An inverted blood-brain barrier model that permits interactions between glia and inflammatory stimuli. Sansing HA, Renner NA, MacLean AG. J Neurosci Methods. 2012; 207(1):91–6. A dynamic real-time method for monitoring epithelial barrier function in vitro. Sun M, Fu H, Cheng H, Cao Q, Zhao Y, Mou X, Zhang X, Liu X, Ke Y. Anal Biochem. 2012; 425(2):96–103. Selected Publications continued 7
- 8. Ordering Information for xCELLigence RTCA DP System Product Cat. No. Pack Size xCELLigence RTCA DP Instrument RTCA DP Analyzer RTCA Control Unit 00380601050 05469759001 05454417001 1 Bundled Package 1 Instrument 1 Notebook PC E-Plate 16 E-Plate VIEW 16 E-Plate Insert 16 05469830001 05469813001 06324738001 06324746001 06465382001 6 Plates 6 x 6 Plates 6 Plates 6 x 6 Plates 1 x 6 Devices (6 16-Well Inserts) CIM-Plate 16 05665817001 05665825001 6 Plates 6 x 6 Plates CIM-Plate 16, Assembly Tool 05665841001 1 Assembly Tool Learn more about the enabling technology of the xCELLigence System and its broad range of applications at www.aceabio.com XCELLIGENCE, E-PLATE, CIM-PLATE, and ACEA BIOSCIENCES are registered trademarks of ACEA Biosciences, Inc. in the US and other countries. All other product names and trademarks are the property of their respective owners. For life science research only. Not for use in diagnostic procedures. Published by ACEA Biosciences, Inc. 6779 Mesa Ridge Road Ste. 100 San Diego, CA 92121 U.S.A. www.aceabio.com © 2013 ACEA Biosciences, Inc. All rights reserved.
- 10. Ƶ
- 11. ISSUE04 Focus Application Cell Migration For life science research only. Not for use in diagnostic procedures. xCELLigence System Real-Time Cell Analyzer Introduction Cell migration and invasion are mechanically integrated molecular processes and fundamental components of embryogenesis, vasculogenesis, immune responses, as well as pathophysiological events such as cancer cell metastasis (1, 2). Cell migration and invasion involve morphological changes due to actin cytoskeleton rearrangement and the emergence of protrusive membrane structures followed by contraction of the cell body, uropod detachment, and secretion of matrix degrading enzymes (1, 2). These multi-step processes are influenced by extracellular and intracellular factors and signaling events through specialized membrane receptors. The integrated nature of cell migration is exemplified by angiogenesis. Angiogenesis or neo-angiogenesis refers to the formation of new blood vessels from pre-existing vessels and is critical for development, wound healing and tumor growth. Endothelial cell migration is an important compo- nent of angiogenesis, involving chemotactic, haptotactic and mechanotactic (shear stress) induced cell migration (3). Chemotactic cell migration is typically induced by soluble growth factors such as vascular endothelial growth factor (VEGF) and its isoforms, fibroblast growth factor (bFGF) and hepatocyte growth factor (HGF) amongst others. These growth factors interact with their cognate receptor tyrosine kinases on he surface of endothelial cells activating signaling pathways culminating in directed cell migration. In the present study, we used the new CIM-Plate 16 with the xCELLigence RTCA DP Instrument to monitor growth factor-mediated migration of endothelial cells in realtime using label-free conditions. The CIM-Plate 16 is a 16-well modified Boyden chamber composed of an upper chamber (UC) and a lower chamber (LC). The UC and LC easily snap together to form a tight seal. The UC is sealed at its bottom by a microporous Polyethylene terephthalate (PET) mem- brane. These micropores permit the physical translocation of cells from the upper part of the UC to the bottom side of the membrane. The bottom side of the membrane (the side facing the LC) contains interdigitated gold microelectrode sensors which will come in contact with migrated cells and generate an impedance signal. The LC contains 16 wells, each of which serves as a reservoir for a chemoattractant solution on the bottom side of the wells, separated from each other by pressure-sensitive O-ring seals. Results To analyze endothelial cell migration using the CIM-Plate 16, human umbilical vein endothelial cells (HUVEC) from Lifeline Cell Technologies were cultured in Vasculife VEGF cell culture medium, according to the manufacturer’s recommendations. Cells were serum starved in Vasculife Basal medium, detached using a trypsin-EDTA solution, and the cell density was adjusted to 300,000 cells/mL. To assess general HUVEC cell migration in response to Featured Study: Automated Continuous Monitoring of Growth Factor-Mediated Endothelial Cell Migration using the CIM-Plate 16 and xCELLigence RTCA DP Instrument Jieying Wu and Jenny Zhu ACEA Biosciences, Inc., San Diego, USA.
- 12. different growth factors encountered during angiogenesis, Vasculife VEGF medium containing VEGF, EGF, IGF, or bFGF with 2% fetal bovine serum, was serially diluted with Vasculife Basal medium and transferred to the lower chamber of the CIM-Plate 16 (see Figure 1). For optimal HUVEC migration, it was determined from previous experiments that extracellular matrix (ECM) proteins, such as fibronectin (FN) are necessary. The PET membrane was therefore coated on both sides with 20 μg/mL FN. After CIM-Plate 16 assembly, 100 μL of cell suspension (30,000 cells) were added to each well of the UC. The CIM-Plate 16 was placed in the RTCA DP Instrument equilibrated in a CO2 incubator. HUVEC migration was continuously monitored using the RTCA DP Instrument. Figure 1 shows the time- and dose-dependent directional migration of HUVEC cells from the upper chamber to the lower chamber. The combination of growth factors and serum provides a strong chemoattractant signal which together induce the directional migration of HUVEC cells through the micropores of the CIM-Plate 16. Migrating cells are detected by the electronic sensing microelectrodes, producing changes in the measured Cell Index values (see Figure 1). HUVEC migration has been shown to be influenced by a number of growth factors including VEGF, HGF, and bFGF. These growth factors are known to be secreted by tumors and cells within the tumor stroma, as well as endothelial cells inducing migration and angiogenesis. To measure HUVEC migration in response to individual growth factors using the CIM-Plate 16, HUVEC cells from Lonza were starved for 6 hours and detached. At the same time, titration of HGF, and separately of VEGF, was performed in basal media (complete HUVEC media diluted at a ratio of 1:125 with EGM media from Lonza). Each of these growth factors was then transferred to the wells of the lower chamber (see Figure 2). The PET membrane was coated with FN as described above. After CIM-Plate 16 assembly, HUVEC cells were added at 30,000 cells/well for VEGF-induced migration and 15,000 cells/well for HGF-induced migration. Time-dependent HUVEC migration was monitored using the RTCA DP Instrument. Both VEGF and HGF induced the migration of HUVEC cells in a time- and dose-dependent manner (see Figure 2A and 2B). The RTCA Software 1.2 was used to calculate time-dependent EC50 values for both VEGF- and HGF-mediated HUVEC migration (see Figure 2C and 2D). Angiogenesis is a compelling target for cancer therapy. Monoclonal antibodies targeting angiogenesis play an important role in colon and lung cancer therapy (4). For this reason, the migration of endothelial cells in response to angiogenic factors such as VEGF is a good in vitro model system for studying and screening potential inhibitors of this process (see Figure 3). For the quantitative and time- dependent assessment of inhibition of VEGF-induced endo- thelial cell migration, HUVEC cells were added to the CIM-Plate 16, as described above, in the presence of increasing amounts of a VEGF receptor inhibitor. As shown in Figure 3A, this inhibitor was found to potently block VEGF-induced cell migration in a time- and dose- dependent manner. The inhibition of VEGF-induced HUVEC cell migration by this compound was quantified using the RTCA Software 1.2. Time-dependent IC50 values, shown in Figure 3B, demonstrate that this particular VEGF receptor inhibitor blocks the kinase activity of all three VEGF receptor isoforms with IC50 values in the picomolar range. Figure 1: Time- and dose-dependent directional migration of HUVEC cells from the upper to the lower CIM-Plate 16 chamber. To assess HUVEC cell migration, Vasculife VEGF medium, containing VEGF, EGF, IGF, bFGF and 2% fetal bovine serum, was serially diluted with Vasculife Basal medium and transferred to the lower chamber of the CIM-Plate 16. 0.0 2.0 4.0 6.0 8.0 10.0 12.0 14.0 16.0 Time (in Hour) 6.5 5.5 4.5 3.5 2.5 1.5 0.5 -0.5 CellIndex Complete Media 1:3 1:9 1:27 1:81 1:243 1:729 Basal Media
- 13. Figure 2: HUVEC cell migration in response to the growth factors, VEGF (A, C) and HGF (B, D) using the CIM-Plate 16 and xCELLigence RTCA DP Instrument, showing Cell Index profiles (A, B) and EC50 plots (C, D); see text in Results for details. 0.0 3.0 6.0 9.0 12.0 15.0 18.0 21.0 Time (in Hour) VEGF-induced cell migration HGF-induced cell migration 3.5 2.5 1.5 0.5 -0.5 CellIndex 60 ng/mL 20 ng/mL 6.7 ng/mL 2.2 ng/mL 0.7 ng/mL 0.2 ng/mL 0 ng/mL EGM Media 2.0 1.0 0.0 0.0 3.0 6.0 9.0 12.0 15.0 18.0 Time (in Hour) CellIndex 100 ng/mL 33.3 ng/mL 200 ng/mL 3.7 ng/mL 1.2 ng/mL EGM Media 11.1 ng/mL 3.6000 3.0000 2.4000 1.8000 1.2000 0.6000 0.0000 CellIndex -10.50 -10.00 -9.50 -9.00 -8.50 -8.00 -7.50 -7.00 -6.50 Log of concentration (g/ml) 2.1000 1.8000 1.5000 1.2000 0.9000 0.6000 0.3000 0.0000 CellIndex -9.50 -9.00 -8.50 -8.00 -7.50 -7.00 -6.50 -6.0 Log of concentration (g/ml) T1 EC50= 5.5 ng/mL T2 EC50= 5.3 ng/mL T1 EC50= 3.2 ng/mL T2 EC50= 2.7 ng/mL C A B D A 0.04 nM 0.12 nM 0.4 nM 1.1 nM 3.3 nM 10 nM Inhibitor 0.0 2.0 4.0 6.0 8.0 10.0 12.0 14.0 16.0 18.0 20.0 Time (in Hour) 2.5 2.0 1.5 1.0 0.5 0.0 CellIndex B 2.4000 2.0000 1.6000 1.2000 0.8000 0.4000 0.0000 CellIndex -11.00 -10.50 -10.00 -9.50 -9.00 -8.50 -8.00 -7.50 Log of concentration (M) T1 EC50= 78 pM T2 EC50= 179 pM Figure 3: Real-time continuous HUVEC cell monitoring showing the Cell Index profiles (A) and IC50 plot (B) for the inhibition of VEGF-induced cell migration by a VEGF receptor inhibitor; see text in Results for details. Conclusion Data presented in this application note demonstrate that growth-factor-mediated endothelial cell migration can be monitored quantitatively and in realtime using the CIM- Plate 16 with the RTCA DP Instrument. The xCELLigence System proved to be ideal for assessing and screening an inhibitor of endothelial cell migration and angiogenesis. The CIM-Plate 16 combines the benefits of continuous label-free impedance-based technology with the classic Boyden chamber permitting automated, real-time, and quantitative measurements of cell migration and invasion. Classic cell migration techniques utilizing standard and transwell Boyden chambers are labor intensive, producing results that can be difficult to reproduce. The non-invasive CIM-Plate 16 does not require manual cell counting or cell labeling. Moreover, the continuous real-time data obtained using the CIM-Plate 16 identifies optimal time points for performing parallel gene expression and functional analyses of HUVEC migration. The above described features and benefits of the CIM-Plate 16 and the RTCA DP Instrument describe an ideal system for the in vitro analysis of the cellular and molecular events associated with cell migration and invasion. T1 T2 T1 T2 T1 T2
- 14. Published by ACEA Biosciences, Inc. 6779 Mesa Ridge Road Ste 100 San Diego, CA 92121 U.S.A. www.aceabio.com © 2013 ACEA Biosciences, Inc. All rights reserved. Ordering Information References 1. Lauffenburger DA, Horwitz AF. (1996). “Cell migration: a physically integrated molecular process.” Cell 84(3):359-69. 2. Ridley AJ, Schwartz MA, Burridge K, et al. (2003). “Cell migration: integrating signals from front to back.” Science 302(5651):1704-9. 3. Lamalice L, Le Boeuf F, Huot J. (2007). “Endothelial cell migration during angiogenesis.” Circulation Research 24: 100: 782-794. 4. Folkman J. (2007). “Angiogenesis: an organizing principle for drug discovery?” Nature Reviews Drug Discovery 6(4): 273-286. For life science research only. Not for use in diagnostic procedures. Trademarks: XCELLIGENCE, CIM-PLATE, E-PLATE, and ACEA BIOSCIENCES are registered trademarks of ACEA Biosciences, Inc. in the US and other countries. Other brands or product names are trademarks of their respective holders. Key Words: Growth factor-mediated cell migration, xCELLigence System, RTCA DP Instrument, real-time migration monitoring, CIM-Plate 16, non-invasive and label-free migration detection Product Cat. No. Pack Size xCELLigence RTCA DP Instrument RTCA DP Analyzer RTCA Control Unit 00380601050 05469759001 05454417001 1 Bundled Package 1 Instrument 1 Notebook PC E-Plate 16 E-Plate VIEW 16 E-Plate Insert 16 05469830001 05469813001 06324738001 06324746001 06465382001 6 Plates 6 x 6 Plates 6 Plates 6 x 6 Plates 1 x 6 Devices (6 16-Well Inserts) CIM-Plate 16 05665817001 05665825001 6 Plates 6 x 6 Plates
- 16. Comparative Analysis of Dynamic Cell Viability, Migration and Invasion Assessments by Novel Real-Time Technology and Classic Endpoint Assays Ridha Limame1 *, An Wouters1 , Bea Pauwels1 , Erik Fransen2 , Marc Peeters1,3 , Filip Lardon1 , Olivier De Wever4 , Patrick Pauwels1,5 1 Center for Oncological Research (CORE), University of Antwerp, Antwerp, Belgium, 2 StatUA Center for Statistics, University of Antwerp, Antwerp, Belgium, 3 Department of Oncology, Antwerp University Hospital, Edegem (Antwerp), Belgium, 4 Laboratory of Experimental Cancer Research, Department of Radiotherapy and Nuclear Medicine, Ghent University Hospital, Ghent, Belgium, 5 Laboratory of Pathology, Antwerp University Hospital, Edegem (Antwerp), Belgium Abstract Background: Cell viability and motility comprise ubiquitous mechanisms involved in a variety of (patho)biological processes including cancer. We report a technical comparative analysis of the novel impedance-based xCELLigence Real-Time Cell Analysis detection platform, with conventional label-based endpoint methods, hereby indicating performance characteristics and correlating dynamic observations of cell proliferation, cytotoxicity, migration and invasion on cancer cells in highly standardized experimental conditions. Methodology/Principal Findings: Dynamic high-resolution assessments of proliferation, cytotoxicity and migration were performed using xCELLigence technology on the MDA-MB-231 (breast cancer) and A549 (lung cancer) cell lines. Proliferation kinetics were compared with the Sulforhodamine B (SRB) assay in a series of four cell concentrations, yielding fair to good correlations (Spearman’s Rho 0.688 to 0.964). Cytotoxic action by paclitaxel (0–100 nM) correlated well with SRB (Rho.0.95) with similar IC50 values. Reference cell migration experiments were performed using Transwell plates and correlated by pixel area calculation of crystal violet-stained membranes (Rho 0.90) and optical density (OD) measurement of extracted dye (Rho.0.95). Invasion was observed on MDA-MB-231 cells alone using Matrigel-coated Transwells as standard reference method and correlated by OD reading for two Matrigel densities (Rho.0.95). Variance component analysis revealed increased variances associated with impedance-based detection of migration and invasion, potentially caused by the sensitive nature of this method. Conclusions/Significance: The xCELLigence RTCA technology provides an accurate platform for non-invasive detection of cell viability and motility. The strong correlations with conventional methods imply a similar observation of cell behavior and interchangeability with other systems, illustrated by the highly correlating kinetic invasion profiles on different platforms applying only adapted matrix surface densities. The increased sensitivity however implies standardized experimental conditions to minimize technical-induced variance. Citation: Limame R, Wouters A, Pauwels B, Fransen E, Peeters M, et al. (2012) Comparative Analysis of Dynamic Cell Viability, Migration and Invasion Assessments by Novel Real-Time Technology and Classic Endpoint Assays. PLoS ONE 7(10): e46536. doi:10.1371/journal.pone.0046536 Editor: Aamir Ahmad, Wayne State University School of Medicine, United States of America Received April 24, 2012; Accepted August 31, 2012; Published October 19, 2012 Copyright: ß 2012 Limame et al. This is an open-access article distributed under the terms of the Creative Commons Attribution License, which permits unrestricted use, distribution, and reproduction in any medium, provided the original author and source are credited. Funding: These authors have no support or funding to report. Competing Interests: Olivier De Wever, listed as co-author, is currently serving as an academic editor for PLOS ONE. This does not alter the authors’ adherence to all the PLOS ONE policies on sharing data and materials. * E-mail: ridha.limame@ua.ac.be Introduction Among the most fundamental hallmarks of cancer are loss of pre-existing tissue architecture by sustained proliferation and extracellular matrix infiltration of cancer cells. Cancer cells may sustain proliferative signaling in an autocrine or paracrine fashion by producing growth factors themselves, by overexpression of growth factor receptors or by a constitutive activation of downstream signaling components [1]. Monitoring of cell prolif- eration and cell viability is critical in biomedical research, in order to understand the pathways regulating proliferation and viability, and to develop agents that modulate these processes. The sulforhodamine B (SRB) test is a high throughput and reproduc- ible colorimetric assay, based on the binding of SRB to protein basic amino acid residues, providing a sensitive index of cellular protein content that is linear over a cell density range [2]. Matrix penetration necessitates activation of the cellular motility apparatus and can occur by either individual cells or cell strands, sheets or clusters [3]. A phenomenon predominantly involved in this process is chemotaxis, whereby cell movement is directed along an extracellular chemical gradient of secreted factors in the microenvironment [4]. Already in the early stages of embryogen- esis, formation of complex tissues and organs is orchestrated by fine-tuned chemotactic migration of cell chains. In malignant processes however, cancer cells tend to adopt similar, if not identical mechanisms to metastasize to distant organ sites [5]. Several well-established experimental approaches are available to PLOS ONE | www.plosone.org 1 October 2012 | Volume 7 | Issue 10 | e46536
- 17. study cell migration and chemotaxis in vitro (reviewed in [6]). The Transmembrane/Boyden chamber assay is based on a chemotactic- driven cell transit through a filter [7]. An important feature of the endpoint in this experimental set-up is that cells need to exhibit active migratory behavior to end up at the other side of the membrane. The xCELLigence RTCA technology (Roche Applied Science) has emerged as an alternative non-invasive and label-free approach to assess cellular proliferation, migration and invasion in real time on a cell culture level [8]. This system makes use of impedance detection for continuous monitoring of cell viability, migration and invasion (reviewed in [9]) (Fig. 1). Here we report data of in vitro assessment of four cellular processes (proliferation, cytotoxicity, migration and invasion) on the MDA-MB-231 and A549 cancer cell lines using xCELLigence RTCA DP (Roche Applied Science) in comparison with data resulting from parallel experiments applying a previously existing and well-established measuring method (to be considered as a ‘‘gold standard’’ method) for each process. Both these cell lines are extensively characterized and used as models representing two different highly incidental tumor types (breast cancer, lung cancer). Furthermore, these cell lines show a strong degree of motility in the wild-type state, thus providing useful examples for the distinction between chemotactic and random motility. Importantly, all of the comparative techniques are traditional label-based endpoint assays that have been selected due to their widespread application within the scientific community and similarity in working principle with xCELLigence. Although they have been slightly modified to match with the xCELLigence setup and its ability to acquire time-dependent kinetics of cultured cell behavior, the fundamental handling and detection principles of each classic assay have been maintained. Cell proliferation and cytotoxicity testing has been performed using the SRB assay [10], with the microtubule stabilizer paclitaxel as cytotoxic agent in the latter experiments. Being widely used for the treatment of a variety of tumor types, inhibitory effects of this anti-mitotic compound on cell proliferation have been described extensively. Furthermore, previous reports on the use of the xCELLigence device included paclitaxel as a reference compound in their studies [8,11], making this a suitable agent for this study. Cell migration and invasion experiments were performed using conventional Transwell plates and quantified by both pixel area calculation of stained membranes and optical density reading of solubilized dye. For the first time, results from ‘‘tried-and-tested’’ assay setups are confronted with parallel data recorded using a novel, commer- cially available technology, providing an objective technical comparison of dynamic observations on cultured cells in highly standardized experimental conditions. Results Proliferation The dynamic assessment of proliferation kinetics was modeled by performing SRB testing on both MDA-MB-231 and A549 cells. Growth curve studies were performed over a ten-day period and proliferation curves were established for four different plating densities. To correct for seeding area differences between SRB- experiments and xCELLigence, cell seeding densities were synchro- nized between both techniques (100, 500, 1000 and 2000 cells/ cm2 ). Corresponding experiments on the xCELLigence system were performed in duplicates and the resulting high-resolution data were extrapolated to the matching data points of the counterpart method as described in the Materials and Methods section. For MDA-MB-231 cells, cell doubling time was 27.7865.14 hours and 29.9262.85 hours measured with the SRB assay and the xCELLigence system respectively. Similarly, for A549 cells, doubling time was 27.9361.75 hours and 29.1861.87 hours measured with the SRB assay and the xCELLigence system respectively. Spearman’s Rho (r) correlations were calculated on global average results that had been normalized to the highest value in the data set per method (SRB or xCELLigence) to eliminate units of measurement (Fig. 2A, B, shown as ‘‘scaled’’). Both MDA-MB-231 and A549 cells revealed fair to good correlation rates for all applied seeding densities, noting however that proliferation did not set off at the lowest cell seeding density (100 cells/cm2 ) of MDA- MB-231 on RTCA (Fig. 2A). A549 cells showed only minimal proliferative activity at this density as well (Fig. 2B). Correlations observed between SRB-based and impedance-based quantitation reached higher values at the medium cell seeding densities of 500 cells/cm2 and 1000 cells/cm2 for both cell lines tested (Spearman’s r = 0.835 resp. 0.790 for MDA-MB-231 and r = 0.964 resp. 0.883 for A549). Altogether, correlation values ranged from 0.880 to 0.964 for A549 and 0.688 to 0.835 for MDA-MB-231. Variance component analysis on proliferation data of A549 cells resulting from both techniques indicated smaller intra- and inter-experi- mental variances on xCELLigence when compared to SRB. Conversely, detection of proliferation kinetics of MDA-MB-231 cells resulted in a higher degree of (intra- and interexperimental) variance when performed with the xCELLigence system (quantified as sw and sb in Table S1). Figure 1. xCELLigence RTCA: impedance-based detection of cell viability and motility. Interdigitated gold microelectrodes on the well bottom (viability – E-plate) or on the bottom side of a filter membrane (motility – CIM-plate 16) detect impedance changes, caused by the presence of cells and expressed as a Cell Index. This detection method is proportional to both cell number (left and above) and morphology as increased cell spreading is reflected by a higher Cell Index value (right). When starting an experiment, a baseline Cell Index value is recorded in medium only before cell addition. doi:10.1371/journal.pone.0046536.g001 Real-Time Technology Compared with Endpoint Assays PLOS ONE | www.plosone.org 2 October 2012 | Volume 7 | Issue 10 | e46536
- 18. Real-Time Technology Compared with Endpoint Assays PLOS ONE | www.plosone.org 3 October 2012 | Volume 7 | Issue 10 | e46536
- 19. Cytotoxicity Compound cytotoxicity was assessed after exposure of MDA- MB-231 and A549 cells to a concentration range of paclitaxel (0– 100 nM for 72 hours). In both cell lines, a similar toxic response was detected by both SRB and xCELLigence, with comparable IC50 values of 4.7860.90 nM and 6.4461.90 nM respectively (t-test, p = 0.244) in MDA-MB-231 cells. The normalized toxic response correlated highly between SRB-based and xCELLigence-based detection for both cell lines (Spearman’s r = 0.970 and 0.976 for MDA-MB-231 and A549 resp.) (Fig. 2C). Cell migration Conventional Transwell plates have been organized in a sequential setup to perform dynamic observations of cancer cell migration in a time-dependent manner, yielding a series of data similar to the xCELLigence system (Fig. 3A, B). Both chemotactic migration to medium containing 10% FBS and random migration with SF medium on either side of the membrane have been considered. High correlation values for both cell lines were obtained when comparing area calculation and OD with xCELLigence Cell Index (CI) (Fig. 4A). Importantly, it must be noted that correlation coefficients were calculated for overall mean values resulting from three independent experiments, each performed in duplicates for all time points. As described in the Materials and Methods section, all raw data obtained were normalized to the single maximal value over three experiments per quantitation method (CI, pixel area or OD) to eliminate units of measurement. Subsequently, values from random (SF) migration were subtracted from chemotactic (FBS) migration per time point to generate signals of net chemoattraction (Fig. 4B). Pixel area calculations, averaged over three fields per insert membrane (Fig. 4C), correlated with xCELLigence CI measurements for both MDA-MB-231 and A549 cells (Spearman’s r = 0.90 for both cell lines). However, OD measurements showed even stronger correlations with xCELLigence data (Spearman’s r = 0.96 and 1.00 for MDA-MB-231 and A549 resp.). Area calculation correlated with OD measurements in a similar fashion as with xCELLigence for both MDA-MB-231 and A549 (Spearman’s r = 0.89 and r = 0.90 resp.) (Fig. 4A). At later time points of the experiments, xCELLigence generated larger variances between intra-experimental replicates when compared to area calculations or OD values derived from classic Transwells (Table S1). Briefly, variance between replicates within one experiment increased over time, creating a funnel shaped time-dependent pattern (Fig. 4D, E). Variance component analysis indeed revealed an increase of intra-experimental variance on xCELLigence data in comparison with Transwell data. However, early (,10 h) pixel area values showed similar degrees of variance. Additional experiments using an identical setup yielded similar results (results not shown). A significant difference was observed between background (serum-free, SF) signals generated by the three methodologies of cell migration quantitation. These signals derived from random movement of cells without exposure to any chemoattractant and, serving as a negative control, showed a different pattern when generated by xCELLigence or by both quantitation techniques using Transwells (Fig. 5). Paired comparisons between time-dependent tracking of background migration were performed between all techniques using a likelihood ratio test and revealed a significant difference between xCELLigence and pixel area calculation (p,0.001) for both MDA-MB-231 and A549. OD measurements differed significantly from xCELLigence (p,0.001) for MDA-MB- 231 cells, but showed a similar pattern when compared with xCELLigence data generated from A549 cells (p = 0.22). Cell invasion Impedance-based detection of MDA-MB-231 cell invasion was compared with results derived from a Transwell system as applied for migration experiments, with Matrigel as extracellular matrix component added on top of the microporous membranes (Fig. 6A). It was found that Matrigel dilutions of 10% (v/v, SF medium) on xCELLigence yielded high correlations when compared to a dilution of 20% on Transwells in dynamic invasion profile recording during a 48-hour incubation (Spearman’s r = 0.939). Similarly, invasion through a Matrigel dilution of 3.3% on xCELLigence correlated highly with a dilution of 7.7% on Transwell plates (Spearman’s r = 0.927) (Fig. 6B, C). Variance component analysis of Transwell and xCELLigence data revealed slightly increased degrees of intra-experimental variance in the latter. The variance between independent experiments was increased for xCELLigence in comparison with Transwell assays (Table S1). All Matrigel dilutions have been synchronized regarding seeding surface area for both systems and theoretical calculations for correlating Matrigel dilutions are shown in Table 1. Discussion xCELLigence technology measures impedance changes in a meshwork of interdigitated gold microelectrodes located at the well bottom (E-plate) or at the bottom side of a microporous membrane (CIM16-plate). These changes are caused by the gradual increase of electrode surface occupation by (proliferated/ migrated/invaded) cells during the course of time and thus can provide an index of cell viability, migration and invasion. This method of quantitation is directly proportional to cellular morphology, spreading, ruffling and adhesion quality as well as cell number [8,9] (Fig. 1). Cell proliferation and paclitaxel cytotoxicity kinetics, as assessed by the xCELLigence platform, were compared with an SRB-based approach, showing good correla- tions for both cell lines tested, implying that both methods detect similar process kinetics when performed in standardized condi- tions. However, correlations were generally stronger for the A549 than for the MDA-MB-231 cell line, which may indicate a possible cell type-dependent cause. MDA-MB-231 cells show a heteroge- neous morphotype with round and spread cells, which may differentially influence impedance based measurements or crystal violet uptake. Paclitaxel was chosen as it is widely used as treatment for a variety of tumor types and previous reports on the use of the xCELLigence system as a tool for cytotoxicity screening included paclitaxel as a reference compound [8,11]. Nevertheless, it must be underlined that the highly correlative nature of cytotoxic kinetics as detected by both techniques for paclitaxel may not apply for certain other compounds. Indeed, the xCELLigence Figure 2. Time-dependent proliferation and cytotoxicity profiles of MDA-MB-231 and A549. A. Proliferation curves of MDA-MB-231 cells as generated by xCELLigence RTCA (red) and SRB (black) for different seeding densities of 100 (top left), 500 (bottom left), 1000 (top right) and 2000 cells/cm2 (bottom right) during a ten-day incubation. B. Same as (A) for A549 cells. All graphs represent results from three independent experiments 6 SD. C. Cytotoxicity profiles relating to 72 hours of exposure to paclitaxel (0–100 nM). Cells were allowed to attach and propagate during 24 hours prior to start of treatment. Toxicity data from xCELLigence RTCA were derived from normalized plots. All graphs represent results from three independent experiments 6 SD. doi:10.1371/journal.pone.0046536.g002 Real-Time Technology Compared with Endpoint Assays PLOS ONE | www.plosone.org 4 October 2012 | Volume 7 | Issue 10 | e46536
- 20. RTCA device has been reported to generate compound-specific kinetic profiles on cultured cells, hereby demonstrating associa- tions with the respective mechanisms of action [11]. To quantify cell migration through conventional setups, detection by crystal violet was selected, followed by pixel area and OD quantitation, as these methods are widespread within the scientific community and also take morphologic features into account. Both area calculation and OD measurement correlated highly with cell migration, as detected by xCELLigence, confirming that the observed kinetic cell behavior is strongly similar, provided that equal cell seeding densities are applied. The closest associations were found between OD measurements and RTCA CI, generating nearly identical migration patterns. OD values were determined on cell lysates with extracted crystal violet stain, derived from entire Transwell membranes, and thus provide a more reliable quantitation when compared with pixel area calculation, which was based on averaging three microscopic fields per Transwell membrane. This indicates that impedance- based measurements have smaller limits of detection, resulting in highly reliable migration estimates. Analysis of background signals, resulting from random migration in a serum-free environment (negative control), revealed a significant difference in signal detection between xCELLigence and both classic techniques (Fig. 5). Weak signals resulting from limited baseline cell migration were indeed more accurately detected by the RTCA platform, which implies a higher sensitivity, compared to classic detection methods. OD measurements correlated more closely with xCELLigence data in all experiments and did not show a significant difference when background signals were compared with xCELLi- gence for the A549 cell line, suggesting a smaller detection limit and thus a more accurate method of quantifying cell migration when using Transwells. Additionally, a smaller limit of detection can explain the observed time-dependent increase of variability between intra-experimental replicates during the course of an experiment. Data derived from cell culture-based experiments are subject to inter- as well as intra-individual variation regarding cell counting, pipetting, preparation of chemotactic factors and general cell culture handling. As a consequence, small handling differences during the preparation of an experiment can result in signal differences between technical replicates and this will be reflected in variations increasing with time within one experiment when compared to area calculation or OD measurement, that do not detect this variability to this extent. This is also illustrated by cell culture-based invasion experiments, as the uniform application Figure 3. Conventional Transwell design for detection of time-dependent cell migration. A. A Transwell setup consists of an upper chamber (insert) that is placed onto a lower chamber (well). The insert contains a microporous membrane (8 mm pores) allowing passage of tumor cells. After a period of serum starvation a serum-free cell suspension is seeded in the insert and exposed to medium containing potential chemoattractants (by default: medium+FBS). During incubation at 37uC and 5% CO2, cells migrate toward the bottom side of the membrane. B. Experimental design to assess time-dependent migratory behavior of cultured cells. Both migration toward FBS-containing medium and baseline migration (toward SF medium, no chemoattraction) as a negative control were included. Two times two 24-well Transwell plates were used to examine migration to FBS (positive control – top row) and baseline migration (negative control – bottom row). At ten time points during a 24-hour incubation period inserts were fixed and stained in duplicate. Two inserts containing cell-free media (grey fill) have been included throughout the experiment and fixed and stained after 12 hours incubation to assess background absorption in optical density (OD) measurements. In addition, to exclude influence of inter-plate variability on observed migration rates, each plate contained duplicate two-hour control inserts. doi:10.1371/journal.pone.0046536.g003 Real-Time Technology Compared with Endpoint Assays PLOS ONE | www.plosone.org 5 October 2012 | Volume 7 | Issue 10 | e46536
- 21. Real-Time Technology Compared with Endpoint Assays PLOS ONE | www.plosone.org 6 October 2012 | Volume 7 | Issue 10 | e46536
- 22. of a Matrigel layer implies the introduction of an important added variable. Consequent Matrigel thawing and handling on ice, using only cooled consumables, and hands-on coating experience can contribute to homogenous gelification and thus to enhanced assay reproducibility. Comparative invasion results have shown corre- lation between xCELLigence and Transwells when similar cell seeding densities were applied and, more importantly, when the amount of Matrigel per square area unit is synchronized. Diluting the matrix barrier, and thus changing the degree of matrix fenestration, gives rise to similar invasion rates on both setups with different seeding areas, although equal volumes of Matrigel have been applied. In conclusion, the real-time label-free xCELLigence system provides a suitable and accurate platform for high-throughput kinetic screenings and for determination of cell motility dynamics. In contrast with classic endpoint assays, the impedance-based detection method is generally less labor-intensive, provides kinetic information on the studied processes and does not affect cell viability, potentially generating further experimentation possibil- ities. Moreover, the correlating observations as performed with conventional approaches make methods interchangeable to perform functional studies when larger cell populations of interest are needed. However although impedance measurement provides a sensitive cell-based detection method, it should be applied as a complementary tool to further functional confirmation. Importantly, this is the first study illustrating the highly correlative nature of invasion kinetics detected by two different setups applying synchronized matrix densities. The increased sensitivity, however, necessitates standardized experimental con- ditions and user experience, to minimize variance increments on the xCELLigence system. Materials and Methods Cell culture Two malignant cell lines (A549, lung adenocarcinoma; MDA- MB-231, breast adenocarcinoma), obtained from the American Type Culture Collection (ATCC, Manassas, VA, USA) (http:// Figure 4. Time-dependent migratory pattern of MDA-MB-231 and A549. A. MDA-MB-231 (left) and A549 (right) cell migration profiles, detected by Transwell experiments (black) and xCELLigence (red). Graphs represent scaled signals (0–1) of net chemoattraction after subtraction of the random migration signal (empty squares in panel A, B), with associated Spearman’s Rho values. All results originate from three independent duplicate experiments 6 SD. B. Normalization procedure of migration patterns. Raw data (left panel) were normalized to a (0–1) scale (middle panel) through division of all data by the maximum value obtained in three independent experiments. Subsequently, random migration (SF) signals (triangle markers) were subtracted from the positive (FBS) control counterparts (circle markers) per experiment to obtain a pure chemotactic signal (right panel). Example shown is the migratory pattern of MDA-MB-231 cells estimated by pixel area calculation in three experiments (exp 1 - red, exp 2 - green, exp 3 - black). Triangle and circle markers represent negative (SF) and positive (FBS) control data respectively. C. ImageJ-based picture processing. Original pictures were color thresholded to obtain a binary image displaying cellular content as saturated black areas on a white background. Thresholded images were masked to exclude non-cellular particles from the final area calculation. Pictures shown are migrated MDA-MB-231 cells after four hours (top row) and 16 hours (bottom row) of incubation. D. Migratory behavior of MDA-MB-231 cells toward medium+FBS (positive control – filled squares) and background migration (empty squares) as detected by conventional Transwell experiments at ten time points spread over 24 hours of incubation. Area calculation (left) of stained cells and optical density (OD – middle) were compared to the xCELLigence migration pattern, reconstructed from the original high-resolution plot by extrapolating data from the corresponding time points (right). All results represent original data from three independent duplicate experiments 6 SD. Picture string (obj. 2.56) shows migratory status of MDA-MB-231 cells, stained as described, at five different stages during 24 hours of incubation. E. Same as (D) for A549 cells. doi:10.1371/journal.pone.0046536.g004 Figure 5. Time-dependent random migration profile of MDA-MB-231 and A549. Comparison of random migration signals (negative control – SF) between three quantitation methods: pixel area calculation – black, OD - red, xCELLigence - green. A likelihood ratio test revealed a significant difference in slope between area calculation and OD (p,0.001) and area calculation and xCELLigence (p,0.001) for both cell lines and OD and xCELLigence (p,0.001) for MDA-MB-231 only. OD and xCELLigence slopes did not differ significantly (p = 0.22) for A549 cells. doi:10.1371/journal.pone.0046536.g005 Real-Time Technology Compared with Endpoint Assays PLOS ONE | www.plosone.org 7 October 2012 | Volume 7 | Issue 10 | e46536
- 23. www.lgcstandards-atcc.org), were cultured in DMEM and RPMI1640 respectively, each supplemented with 10% fetal bovine serum (FBS), 1% penicillin/streptomycin, 1% L-glutamine and additionally, 1% sodium pyruvate was added to RPMI1640 only. All cell culture reagents were purchased from Invitrogen NV/SA (Merelbeke, Belgium). For proliferation and cytotoxicity experi- ments, normal growth medium containing FBS was used. Cell lines were maintained at 37uC and 5% CO2/95% air in a humidified incubator and confirmed free of mycoplasma infection through regular testing (MycoAlertH Mycoplasma Detection Kit, Lonza, Belgium). All cell lines have been validated in-house by short tandem repeat (STR) profiling using the Cell IDTM System (Promega, Madison, WI, USA) according to the manufacturer’s Figure 6. Time-dependent invasion profile of MDA-MB-231. A. Experimental design to quantify MDA-MB-231 Matrigel invasion. Two times two 24-well Transwell plates were used to examine invasion to FBS through a 20% (v/v) (top row) and 7.7% (v/v) Matrigel layer (bottom row) after 24 hours of serum starvation. At ten time points during a 48-hour incubation period inserts were fixed and stained in duplicate. Two inserts containing cell-free media (grey fill) have been included throughout the experiment and fixed and stained after 24 hours incubation to assess background absorption in optical density (OD) measurements. In addition, to exclude influence of inter-plate variability on observed migration rates, each plate contained duplicate 24-hour control inserts. B. MDA-MB-231 dynamic cell invasion profiles, generated by Transwell experiments (black) and xCELLigence (red). Graphs represent normalized signals (scaled values 0–1) of invasion through 20% (open circles), 10% (open squares), 7.7% (filled circles) and 3.3% (filled squares) to medium+10% FBS with associated Spearman’s rank correlation coefficients (Rho). All results are from three independent duplicate experiments with SD. C. Sequential pictures showing invasive MDA-MB-231 cells at the indicated time points during a 48-hour incubation on Transwells coated with 20% (top row) and 7.7% Matrigel (bottom row). Pictures (obj. 2.56) show cells fixed and stained in 20% methanol/0.1% crystal violet. doi:10.1371/journal.pone.0046536.g006 Table 1. Matrigel surface densities corresponding with degree of dilution for a fixed volume of 20 mL. Matrigel density xCELLigence RTCA Transwell % mg/cm2* % 10.0 189.50 23.1 3.3 63.17 7.7 *Matrigel (Basement Membrane Matrix, growth factor reduced, BD Biosciences) delivered as a 613.55 mg/mL stock. doi:10.1371/journal.pone.0046536.t001 Real-Time Technology Compared with Endpoint Assays PLOS ONE | www.plosone.org 8 October 2012 | Volume 7 | Issue 10 | e46536
- 24. instructions. The obtained STR profiles were matched with reference ATCC DNA fingerprints (www.lgcstandards-atcc.org) and with the Cell Line Integrated Molecular Authentication (CLIMA) database (http://bioinformatics.istge.it/clima) [12] to authenticate cell line identity. xCELLigence Real-Time Cell Analysis (RTCA): proliferation and cytotoxicity Experiments were carried out using the xCELLigence RTCA DP instrument (Roche Diagnostics GmbH, Mannheim, Germany) which was placed in a humidified incubator at 37uC and 5% CO2. Cell proliferation and cytotoxicity experiments were performed using modified 16-well plates (E-plate, Roche Diagnostics GmbH, Mannheim, Germany). Microelectrodes were attached at the bottom of the wells for impedance-based detection of attachment, spreading and proliferation of the cells. Initially, 100 mL of cell- free growth medium (10% FBS) was added to the wells. After leaving the devices at room temperature for 30 min, the background impedance for each well was measured. Cells were harvested from exponential phase cultures by a standardized detachment procedure using 0.05% Trypsin-EDTA (Invitrogen NV/SA, Merelbeke, Belgium) and counted automatically with a Scepter 2.0 device (Merck Millipore SA/NV, Overijse, Belgium), Fifty mL of the cell suspension was seeded into the wells (20, 40, 80, 100, 200, 400 and 800 cells/well for proliferation, 1000 cells/well for cytotoxicity experiments). The cell concentrations of 20, 100, 200 and 400 cells/well were considered for correlation with the SRB method described below. After leaving the plates at room temperature for 30 min to allow cell attachment, in accordance with the manufacturer’s guidelines, they were locked in the RTCA DP device in the incubator and the impedance value of each well was automatically monitored by the xCELLigence system and expressed as a Cell Index value (CI). Water was added to the space surrounding the wells of the E-plate to avoid interference from evaporation. For proliferation assays, the cells were incubated during ten days in growth medium (10% FBS) and CI was monitored every 15 min during the first six hours, and every hour for the rest of the period. Two replicates of each cell concentration were used in each test. For cytotoxicity experiments, CI of each well was automatically monitored with the xCELLigence system every 15 min during the overnight recovery period. Twenty-four hours after cell seeding, cells were treated during a period of 72 hours with paclitaxel (0, 1, 2, 5, 10, 20, 50 and 100 nM) dissolved in phosphate buffered saline (PBS). PBS alone was added to control wells. Each concentration was tested in duplicate within the same experiment. CI was monitored every 15 min during the experiment. Three days after the start of treatment with paclitaxel, CI measurement was ended. xCELLigence Real-Time Cell Analysis (RTCA): migration and invasion Cell migration and invasion experiments were performed using modified 16-well plates (CIM-16, Roche Diagnostics GmbH, Mannheim, Germany) with each well consisting of an upper and a lower chamber separated by a microporous membrane containing randomly distributed 8 mm-pores. This setup corresponds to conventional Transwell plates with microelectrodes attached to the underside of the membrane for impedance-based detection of migrated cells. Prior to each experiment, cells were deprived of FBS during 24 hours. Initially, 160 mL and 30 mL of media was added to the lower and upper chambers respectively and the CIM- 16 plate was locked in the RTCA DP device at 37uC and 5% CO2 during 60 minutes to obtain equilibrium according to the manufacturer’s guidelines. After this incubation period, a measurement step was performed as a background signal, generated by cell-free media. To initiate an experiment, cells were detached using TrypLE ExpressTM (Invitrogen, Merelbeke, Belgium), resuspended in serum-free (SF) medium, counted and seeded in the upper chamber applying 36104 cells in 100 mL. After cell addition, CIM-16 plates were incubated during 30 minutes at room temperature in the laminar flow hood to allow the cells to settle onto the membrane according to the manufacturer’s guidelines. To prevent interference from evapora- tion during the experiments, SF medium was added to the entire empty space surrounding the wells on the CIM-16 plates. Lower chambers contained media with or without FBS in order to assess chemotactic migration when exposed to FBS and background migration to SF medium as a negative control accordingly. Signals representing net chemoattraction were obtained by subtracting background (SF) values from the positive control (medium containing FBS) signals. Each condition was performed in quadruplicate with a programmed signal detection schedule of each three minutes during the first 11 hours of incubation followed by each five minutes for three hours and finally each 15 minutes to 24 hours of incubation. A protocol identical to the above migration experiments was followed for invasion experiments added with the application of a layer of Matrigel on the upper side of the membranes and dynamic process follow-up during 50 hours. Aliquoted Matrigel (Basement Membrane Matrix, growth factor reduced, BD Biosciences, Erembodegem, Belgium) was thawed overnight on ice and mixed with ice cold SF medium to obtain two dilutions corresponding with 6190 mg/mL (10%, v/v) and 663 mg/mL (3.3%, v/v) (Table 1). All Matrigel handling materials as well as the sealed packs containing CIM-16 upper chambers were stored ice cold overnight. Establishment of a Matrigel layer on the CIM-16 upper chamber membranes was achieved by adding 50 mL of the dilution sequentially on top of four membranes followed by removal of 30 mL, leaving a total of 20 mL Matrigel dilution. Subsequently, the coated upper chambers were incubated at 37uC to homogenously gelify during a minimum of four hours, followed by addition of 160 mL media to the lower and 30 mL SF media to the upper chambers. Equilibration and cell addition was carried out as described above. All data have been recorded by the supplied RTCA software (vs. 1.2.1). As described below in the ‘‘Prestatistical data processing and statistical analysis’’ section, original high-resolution data sets generated by xCELLigence were exported to MS Excel and reconstructed at a lower resolution by selecting only the data points corresponding with the respective time points of signal detection by the endpoint methods (Fig. 7). CI-data from cytotoxicity experiments have been normalized using the RTCA software to the last data point prior to treatment start. All other results (proliferation, migration and invasion) are based on raw data without CI-normalization and were processed as described above for comparison with conventional methodology. SRB assay: proliferation Cells were harvested from exponential phase cultures by trypsinization, counted and plated in 48-well plates. To determine a proliferation curve and calculation of the doubling time, seeding densities ranged from 100 to 2000 A549 or MDA-MB-231 cells/ well. Each concentration was tested six times within the same experiment. General cell culture conditions and culture medium used for this method were similar to those applied for the xCELLigence counterpart experiments, as well as applied cell densities (100, 500, 1000 and 2000 cells/cm2 ). Every day, one Real-Time Technology Compared with Endpoint Assays PLOS ONE | www.plosone.org 9 October 2012 | Volume 7 | Issue 10 | e46536
- 25. plate was fixed by the first step of the SRB assay: culture medium was aspirated prior to fixation of the cells by addition of 200 ml cold 10% trichloroacetic acid. After one hour incubation at 4uC, cells were washed five times with deionized water and left to dry. After collection of all plates during ten days, the following steps of the SRB test were performed as described previously [13,14]. Shortly, the cells were stained with 200 ml 0.1% SRB dissolved in 1% acetic acid for at least 15 minutes and subsequently washed four times with 1% acetic acid to remove unbound stain. The plates were left to dry at room temperature and bound protein stain was solubilized with 200 ml 10 mM unbuffered TRIS base (tris(hydroxymethyl)aminomethane) and transferred to 96 wells plates for optical density reading at 540 nm (Biorad 550 microplate reader, Nazareth, Belgium). Cell doubling time was calculated from the exponential phase of the growth curve. SRB assay: cytotoxicity Cells were harvested as described above. In order to assure exponential growth during the experiments, seeding density was 103 A549 cells per well and 103 MDA-MB-231 cells/well. After an overnight recovery period, treatment with paclitaxel (0–100 nM) dissolved in PBS was started. Control wells were added with PBS. Figure 7. Prestatistical data processing. A. Schematic depiction of processing kinetic data generated by SRB, xCELLigence and Transwells. Raw data with high time resolution (filled and empty circles), resulting from independent xCELLigence experiments (1, 2, 3 and grey arrows) are reduced to a lower time resolution by selecting only the data points corresponding with the time points of endpoint detection (filled circles only). Subsequently, data have been normalized by dividing all values by the highest value recorded over all experiments per method, resulting in a modified Y-axis scale that ranges from 0 to 1. Finally, the normalized data have been averaged with calculation of SD for the three independent experiments per method. B. Reduction of high-resolution data, generated by xCELLigence, to a low resolution comparable with data from conventional assays. The example shows migration (left) and invasion (right) of MDA-MB-231 cells through two densities of Matrigel. The ten time points in the Transwell method (black arrows) were selected from the xCELLigence plots (grey and blue) to reconstruct a low-resolution graph (black), directly comparable to the Transwell data. An identical approach was applied for all other processes studied. doi:10.1371/journal.pone.0046536.g007 Real-Time Technology Compared with Endpoint Assays PLOS ONE | www.plosone.org 10 October 2012 | Volume 7 | Issue 10 | e46536
- 26. Each concentration was tested six times within the same experiment. After 72 hours incubation with paclitaxel, survival was determined by the SRB assay as described above. IC50 values, representing the drug concentration causing 50% growth inhibi- tion, were calculated using WinNonlin software (Pharsight, Mountain View, USA). Transwell migration assay Comparative migration experiments were conducted using a conventional 24-well Transwell system (6.5 mm TranswellH (#3422), CorningH, NY, USA) with each well separated by a microporous polycarbonate membrane (10 mm thickness, 8 mm pores) into an upper (‘‘insert’’) and a lower chamber (‘‘well’’). After 24 hours of serum deprivation, cells were detached using TrypLETM Express (Invitrogen, Merelbeke, Belgium), counted and resuspended in media without FBS to obtain equal cell densities (2.16105 cells/cm2 ) as applied in the xCELLigence RTCA DP system with respect to the membrane seeding surface of both techniques (classic TranswellH membrane surface 0.33 cm2 , RTCA DP 0.143 cm2 ). A volume of 250 mL containing 76104 cells was plated to each insert and 600 mL medium was added to the wells. For each experiment, both chemotactic migration to medium containing 10% FBS and random migration with SF medium on both sides of the membrane have been assessed in parallel Transwell plates. At ten predetermined time points after incubation start (Fig. 3B), inserts were fixed and stained in duplicates and migration was quantitated using two commonly used methods. At each time point, cells were fixed and stained in a 20% methanol/0.1% crystal violet solution during three minutes at room temperature, followed by washing in deionized water to remove redundant staining [15]. Non-migrated cells remaining at the upper side of the membranes were carefully removed with cotton swabs and inserts were dried in darkness overnight. As fixing and staining was performed per set of two inserts with the remaining inserts to be further incubated until the following time point, inserts to be fixed and stained at a time point were transferred to a companion 24-well plate and the remaining inserts immediately replaced in the incubator. Using this approach unfavorable influences caused by continuous switching incubating cells between 37uC and ambient temperatures could be avoided. The following day stained membranes were pictured in three random non-overlapping fields at 106objective and 106eyepiece on a transmitted-light microscope (Leica DMBR, Leica Micro- systems GmbH, Wetzlar, Germany) equipped with an AxioCam HRc camera (Carl Zeiss MicroImaging GmbH, Jena, Germany). A first method of quantitation was performed by processing all obtained images using ImageJ software (http://rsbweb.nih.gov/ij/ ). Each image (Fig. 4C, left) was color thresholded to obtain a binary (black white – 8 bit) image with cellular material portrayed as saturated black areas (Fig. 4C, middle). As a next step all non-cellular artifacts, predominantly visible shadows of empty pores and debris, were removed from each image by performing the particle analysis function with a mask excluding all particles smaller than 100 to 250 pixels dependent on the experiment (Fig. 4C, right). Masking thresholds were set by comparing binary images with their original phase contrast counterparts [16]. Degree of migration for each time point per experiment was determined by calculating the average pixel area of the three fields in duplicate. Inserts were subsequently submerged in 300 mL 1% SDS/16 PBS in order to lyse migrated cells and extract crystal violet stain [17]. Submerged inserts were incubated in darkness overnight on a plate shaker at medium speed to ensure complete lysis. The following day 200 mL of each lysate was transferred to a 96-well plate for optical density (OD) measurement at 590 nm using a Powerwave X microplate scanning spectrophotometer (Bio-Tek, Bad Friedrichshall, Germany), representing a second cell migration quantitation method. Cell-free inserts containing only medium had been included in duplicate throughout each experiment as OD background controls. Reported OD data represent average background-corrected values 6 SD obtained from three independent experiments in duplicate. Transwell Matrigel Invasion assay Reference cell invasion experiments were carried out using a Transwell plate system as described for migration experiments, added with the application of Matrigel as extracellular matrix component. Matrigel dilutions were prepared as described above for the xCELLigence RTCA invasion assay. In order to obtain Matrigel surface area densities synchronized with the CIM-16 plates used for xCELLigence, two dilutions of 20% and 7.7% (v/v) have been prepared in ice cold SF medium corresponding with 6190 mg/mL and 663 mg/mL respectively, as applied in a volume of 20 mL per insert membrane, identical to the CIM-16 upper chamber coating volume (Table 1). All other conditions regarding culturing, cell seeding density and serum deprivation were identical to the Transwell migration assays described above. At a panel of ten predetermined time points, inserts were fixed and stained in duplicates and invasion was quantified by OD reading at 590 nm after overnight extraction of the crystal violet stain. Reported OD data represent average background-corrected values 6 SD obtained from three independent experiments in duplicate. Prestatistical data processing and statistical analysis All data recorded using the xCELLigence RTCA system have been processed using MS Excel in order to obtain data series with the same resolution as the data recorded by the conventional reference methods (SRB, Transwell). This has been performed by selecting only the xCELLigence-generated values corresponding to the time points that have been used in the reference methods, thus leading to a reconstruction of the studied process dynamics at a lower time resolution (Fig. 7A, B). Furthermore, to eliminate differences in units of measurement between the compared methods (xCELLigence CI, OD, pixel area), all data have been reduced to a (0–1) scale. This was done by considering all data gathered over three performed experiments per method and subsequently dividing all data by the single maximal value obtained, thus reducing this value to one (Fig. 4B and 7A). As these interventions do not influence proportionality nor variance levels of the data, comparable series of dynamically generated results were obtained for further statistical processing. For cell migration experiments, random migration signals (SF) were subtracted from the chemotactic migration signals (FBS) per time point to generate dynamic profiles of net chemoattraction (Fig. 4B). All statistical analyses were performed using the statistical package R, version 2.13.1 (www.r-project.org). Correlations were calculated according to the Spearman’s rank correlation method. Intra- and inter-experimental variances were assessed for each quantitation method separately using a mixed model approach with time as fixed and biological replicate as random effect. The standard deviation of the random intercept (inter-experimental variance) as well as the residual standard deviation (intra- experimental variance) was obtained through a variance compo- nent analysis. Due to differences in these values regarding the cell migration data, calculations were split up into ‘‘early’’ (before ten hours incubation) and ‘‘late’’ (after ten hours incubation) measurements. All cell migration data analyses were performed Real-Time Technology Compared with Endpoint Assays PLOS ONE | www.plosone.org 11 October 2012 | Volume 7 | Issue 10 | e46536
- 27. on background (SF)-reduced signals representing pure chemoat- traction. Comparison of background migratory (negative control – SF) signal detection between the three quantitation techniques (pixel area calculation, OD and RTCA CI) was performed by fitting a mixed linear model where the signal was regressed on time, technique and their interaction. Biological replicates were entered as a random effect. A likelihood ratio test was performed to test the significance, expressed as a p-value, of the interaction term time-technique. Supporting Information Table S1 Variance component analysis of proliferation, cytotoxicity, migration and invasion. All values expressed as the square root of the variance (s2 ). sb Variance between independent experiments (‘‘between’’). sw Variance within one experiment (‘‘within’’). Low 6102 and 656102 cells/cm2 . High 6103 and 626103 cells/cm2 . Early Before 10 hours incubation. Late After 10 hours incubation. ND Not done. * Matrigel dilution in SF medium (v/v). (DOCX) Acknowledgments We thank Ken Op de Beeck (CORE and Center for Medical Genetics, University of Antwerp) for assistance with cell line authentication, the Laboratory for Pathophysiology (University of Antwerp) for granting access to the microscope for picturing Transwell membranes and the Laboratory for Experimental Medicine and Pediatrics (University of Antwerp) for granting access to the microplate scanning spectrophotometer for OD measurements. We gratefully acknowledge Marc Baay and Johan Ides (CORE, Antwerp) for constructive discussions. Author Contributions Conceived and designed the experiments: RL AW BP EF MP FL ODW PP. Performed the experiments: RL AW BP. Analyzed the data: RL AW BP EF. Contributed reagents/materials/analysis tools: MP FL PP. Wrote the paper: RL. Evaluated and interpreted results: RL AW BP EF MP FL ODW PP. Evaluated manuscript text: AW EF MP FL ODW PP. References 1. Hanahan D, Weinberg RA (2011) Hallmarks of cancer: the next generation. Cell 144: 646–674. doi:10.1016/j.cell.2011.02.013. 2. Skehan P, Storeng R, Scudiero D, Monks A, McMahon J, et al. (1990) New colorimetric cytotoxicity assay for anticancer-drug screening. J Natl Cancer Inst 82: 1107–1112. 3. Friedl P, Gilmour D (2009) Collective cell migration in morphogenesis, regeneration and cancer. Nat Rev Mol Cell Biol 10: 445–457. doi:10.1038/ nrm2720. 4. Roussos ET, Condeelis JS, Patsialou A (2011) Chemotaxis in cancer. Nat Rev Cancer 11: 573–587. doi:10.1038/nrc3078. 5. Friedl P, Wolf K (2003) Tumour-cell invasion and migration: diversity and escape mechanisms. Nat Rev Cancer 3: 362–374. doi:10.1038/nrc1075. 6. Hulkower KI, Herber RL (2011) Cell Migration and Invasion Assays as Tools for Drug Discovery. Pharmaceutics 3: 107–124. doi:10.3390/pharmaceu- tics3010107. 7. BOYDEN S (1962) The chemotactic effect of mixtures of antibody and antigen on polymorphonuclear leucocytes. J Exp Med 115: 453–466. 8. Ke N, Wang X, Xu X, Abassi YA (2011) The xCELLigence system for real-time and label-free monitoring of cell viability. Methods Mol Biol 740: 33–43. doi:10.1007/978-1-61779-108-6_6. 9. Atienza JM, Yu N, Kirstein SL, Xi B, Wang X, et al. (2006) Dynamic and label- free cell-based assays using the real-time cell electronic sensing system. Assay Drug Dev Technol 4: 597–607. doi:10.1089/adt.2006.4.597. 10. Vichai V, Kirtikara K (2006) Sulforhodamine B colorimetric assay for cytotoxicity screening. Nat Protoc 1: 1112–1116. doi:10.1038/nprot.2006.179. 11. Abassi YA, Xi B, Zhang W, Ye P, Kirstein SL, et al. (2009) Kinetic Cell-Based Morphological Screening: Prediction of Mechanism of Compound Action and Off-Target Effects. Chem Biol 16: 712–723. doi:10.1016/j.chem- biol.2009.05.011. 12. Romano P, Manniello A, Aresu O, Armento M, Cesaro M, et al. (2009) Cell Line Data Base: structure and recent improvements towards molecular authentication of human cell lines. Nucleic Acids Res 37: D925–D932. doi:10.1093/nar/gkn730. 13. Pauwels B, Korst AEC, de Pooter CMJ, Lambrechts HAJ, Pattyn GGO, et al. (2003) The radiosensitising effect of gemcitabine and the influence of the rescue agent amifostine in vitro. Eur J Cancer 39: 838–846. 14. Pauwels B, Korst AEC, De Pooter CMJ, Pattyn GGO, Lambrechts HAJ, et al. (2003) Comparison of the sulforhodamine B assay and the clonogenic assay for in vitro chemoradiation studies. Cancer Chemother Pharmacol 51: 221–226. doi:10.1007/s00280-002-0557-9. 15. Zhang D, LaFortune TA, Krishnamurthy S, Esteva FJ, Cristofanilli M, et al. (2009) Epidermal Growth Factor Receptor Tyrosine Kinase Inhibitor Reverses Mesenchymal to Epithelial Phenotype and Inhibits Metastasis in Inflammatory Breast Cancer. Clinical Cancer Research 15: 6639–6648. doi:10.1158/1078- 0432.CCR-09-0951. 16. de Wever O, Hendrix A, de Boeck A, Westbroek W, Braems G, et al. (2010) Modeling and quantification of cancer cell invasion through collagen type I matrices. Int J Dev Biol 54: 887–896. doi:10.1387/ijdb.092948ow. 17. Huang J, Bridges LC, White JM (2005) Selective modulation of integrin- mediated cell migration by distinct ADAM family members. Mol Biol Cell 16: 4982–4991. doi:10.1091/mbc.E05-03-0258. Real-Time Technology Compared with Endpoint Assays PLOS ONE | www.plosone.org 12 October 2012 | Volume 7 | Issue 10 | e46536
- 28. Mechanistic modeling of the effects of myoferlin on tumor cell invasion Marisa C. Eisenberga,1 , Yangjin Kimb , Ruth Lic , William E. Ackermanc , Douglas A. Knissc,d , and Avner Friedmana,e,1 a Mathematical Biosciences Institute, Ohio State University, Columbus, OH 43210; b Department of Mathematics, University of Michigan, Dearborn, MI 48128; c Department of Obstetrics and Gynecology, Ohio State University, Columbus, OH 43210; d Department of Biomedical Engineering, Ohio State University, Columbus, OH 43210; and e Department of Mathematics, Ohio State University, Columbus, OH 43210 Contributed by Avner Friedman, October 5, 2011 (sent for review August 18, 2011) Myoferlin (MYOF) is a member of the evolutionarily conserved ferlin family of proteins, noted for their role in a variety of mem- brane processes, including endocytosis, repair, and vesicular trans- port. Notably, ferlins are implicated in Caenorhabditis elegans sperm motility (Fer-1), mammalian skeletal muscle development and repair (MYOF and dysferlin), and presynaptic transmission in the auditory system (otoferlin). In this paper, we demonstrate that MYOF plays a previously unrecognized role in cancer cell invasion, using a combination of mathematical modeling and in vitro experi- ments. Using a real-time impedance-based invasion assay (xCELLi- gence), we have shown that lentiviral-based knockdown of MYOF significantly reduced invasion of MDA-MB-231 breast cancer cells in Matrigel bioassays. Based on these experimental data, we de- veloped a partial differential equation model of MYOF effects on cancer cell invasion, which we used to generate mechanistic hypotheses. The mathematical model predictions revealed that ma- trix metalloproteinases (MMPs) may play a key role in modulating this invasive property, which was supported by experimental data using quantitative RT-PCR screens. These results suggest that MYOF may be a promising target for biomarkers or drug target for meta- static cancer diagnosis and therapy, perhaps mediated through MMPs. cancer invasion ∣ RNAi ∣ partial differential equation models ∣ metastasis Amajority of cancer deaths are related not to the primary tumor itself, but rather the formation of disseminated me- tastases (1). Cancer spread requires that cells achieve atypical motility, which enables them to invade surrounding tissues and vessels of the blood and lymphatic systems (2–4). Thus, under- standing the mechanisms and signaling processes that lead to invasive cell behavior may lead to new therapeutic approaches for controlling and treating cancer. The fundamental mechanisms of invasive cancer cell move- ment are largely conserved across a wide range of cell types, with some of the protease dependent and protease independent move- ment types demonstrated by cancer cells also seen in organisms as diverse as unicellular organisms, slime molds, and white blood cells. The ferlin family is an evolutionarily ancient family of pro- teins (5), which are known to affect processes crucial to migration and invasion, including membrane fusion and repair, vesicle transport, endocytosis, protein recycling and stability, and cell motility (6–13). Thus, one might expect the ferlin family to be good candidates for cancer proteins, although they have not previously been investigated in this capacity. In Caenorhabditis elegans, spermatozoa exhibit amoeboid movement, and muta- tions in the fer-1 gene [an orthologue of myoferlin (MYOF)] result in immobility and infertility (13). In humans, MYOF has been implicated in a variety of cellular processes, including myo- blast fusion, growth factor receptor stability, endocytosis, and endothelial cell membrane repair (6, 8, 10–12); however until now its role in cancer cell movement has not been explored. Although information on MYOF is currently limited, it has been shown to be upregulated in breast cancer biopsies (14) and expressed in breast cancer cell lines (15). Immunohistochemical evidence available from the Human Protein Atlas (16) suggests that MYOF is strongly expressed in several cancer types includ- ing colorectal, breast, ovarian, cervical, endometrial, thyroid, stomach, pancreatic, and liver cancer (14, 15, 17–26). To explore the function of MYOF in cancer, a stable line of MYOF-deficient malignant breast carcinoma cells (MDA- MB-231) was generated using lentivirus-based delivery of shRNA constructs targeting human MYOF mRNA (Sigma). A stable, lentiviral control cell line was generated in tandem using lentivir- al particles carrying a nonhuman gene targeting shRNA (Sigma). MYOF depletion was validated by immunoblotting (SI Appendix, Fig. 2). We used an electrode-impedance-based invasion assay [xCELLigence (27)] to probe the effect of MYOF deficiency on cell invasion. Compared to the control MBA-MB-231 cells, MYOF-knockdown (MYOF-KD) cells exhibited reduced inva- sive capacity (28). Motivated by these experimental results, we developed a math- ematical model that examines the role of MYOF in cancer cell invasion. Because relatively little is known about the function of MYOF in cancer, there is a useful opportunity for mathematical modeling to suggest hypotheses, which can then be tested experi- mentally. The model is described by a system of partial differen- tial equations (PDEs). It builds on previous work on cancer cell migration/invasion (29), now incorporating a submodel for MYOF-mediated growth factor receptor recycling. Using multiple MYOF-related datasets (8–12), we determined several parameters which differed between wild-type/control and MYOF-deficient cells. Our simulations suggest that one key parameter—the matrix metalloproteinase (MMP) production rate—is enough to reproduce the experimental data showing reduced MYOF-KD cell invasion. Based on the mathematical model, we hypothesized that MYOF affects MMP production and/or secretion in MDA-MB-231 cells. Preliminary experimen- tal results thus far confirm our hypothesis. Indeed, pilot PCR results presented in this work show that MMPs may be signifi- cantly downregulated by MYOF depletion. We propose that MYOF may serve as a fundamental player in cancer cell movement, by regulating the local behavior of the plasma membrane and affecting trafficking of receptors and proteins to and from the membrane. In particular, MYOF effects on MMP production and release may be key to its role in regulat- ing tumor cell invasivity. Metastasis requires cancer cells to de- velop increased invasive capability, suggesting that MYOF may play an important role in the ability of tumor cells to metastasize. Author contributions: M.C.E., Y.K., R.L., W.E.A., D.A.K., and A.F. designed research, performed research, and wrote the paper. The authors declare no conflict of interest. 1 To whom correspondence may be addressed. E-mail: meisenberg@mbi.osu.edu or afriedman@mbi.osu.edu. This article contains supporting information online at www.pnas.org/lookup/suppl/ doi:10.1073/pnas.1116327108/-/DCSupplemental. www.pnas.org/cgi/doi/10.1073/pnas.1116327108 PNAS Early Edition ∣ 1 of 6 APPLIED MATHEMATICS MEDICALSCIENCES
- 29. Mathematical Model Spatial Setup. The conventional modified Boyden chamber setup includes two chambers with a semipermeable membrane between them. There is typically laminin-rich matrix (e.g., Matrigel) on top of the semipermeable membrane, which replicates the ECM, and invasion is measured by the number of cells which invade through the matrix and cross the membrane from the upper to the lower chamber. For the xCELLigence data, the membrane is coupled with a microelectrode array at the bottom of the upper chamber. Cells begin in the upper chamber (Ω in Fig. 1), from where they can migrate and invade through the ECM (region S in Fig. 1) to reach the microelectrode array. They then cross the membrane/microelectrode array and attach to the bottom side of the array upon crossing. Growth factors (GF) may be introduced in the bottom well below the microelectrode array, to act as a chemoattractant for the cells. We measure the approximate number of cells which have adhered to the microelectrode array by measuring the change in impedance, the cell index [although we note that cell index is also dependent on other factors, such as cell adhesion and spreading (27)]. To simulate these conditions, we can use a similar setup as for the conventional modified Boyden chamber simulations given in refs. 29 and 30, with several modifications to incorporate the microelectrode array and measurement of cell index. Full mathematical description and details on the spatial setup and boundary/initial conditions are given in SI Appendix. State Variable Definitions. We introduce the following variables: R1, free growth factor receptor (GFR) (number∕cell) R2, surface-bound GF-GFR complex (number∕cell) R3, internalized GF-GFR complex (number∕cell) ρ, concentration of ECM (g∕cm3 ) P, MMP concentration (g∕cm3) G, GF concentration (g∕cm3) n, density of breast cancer cells (cells∕cm3 ) Although MMPs are a diverse family of proteins with overlap- ping yet distinct functions, for simplicity we model their combined effects with the variable P, which represents generic/nonspecific MMP concentration. Similarly, because our experimental data use fetal calf serum as a chemoattractant, the variable G repre- sents a combination of multiple growth factors (further details given in SI Appendix). Model Equations. The model equations are based on the model variable interactions shown in Fig. 2. MYOF has been shown in other contexts to affect membrane processes (6, 8, 11) and receptor/protein recycling/transport (10, 12). Parameters relating to these functions, e.g., receptor recycling parameters, are un- derlined in Eqs. 1–7, indicating they are considered MYOF- dependent. We developed two versions of the cell-related parameters—one for wild-type/control cells and another for MYOF-KD cells, as described below. ∂R1 ∂t ¼ ðλ1 − k21R1G þ k13R3 − k01R1Þ n n0 [1] ∂R2 ∂t ¼ ðk21R1G − k32R2 þ k23R3Þ n n0 [2] ∂R3 ∂t ¼ ½k32R2 − ðk13 þ k23 þ k03ÞR3Š n n0 [3] ∂ρ ∂t ¼ −λ21Pρ |fflfflffl{zfflfflffl} degradation þ λ22ρ 1 − ρ ρ0 |fflfflfflfflfflfflfflfflfflffl{zfflfflfflfflfflfflfflfflfflffl} reconstructionðsmallÞ in S [4] Fig. 1. xCELLigence well setup. The upper (Ω) and lower chambers are se- parated by a semipermeable membrane and microelectrode array at x1 ¼ 0. Matrigel/ECM sits on top of the microelectrode array (indicated by region S). Fig. 2. Model for receptor recycling and cell migration and invasion, with processes marked in red affected by MYOF. Cells (n) proliferate, migrate, and invade following these processes, with cell movement dependent on the growth factor gradient (chemotaxis) and the extracellular matrix gradient (haptotaxis). 2 of 6 ∣ www.pnas.org/cgi/doi/10.1073/pnas.1116327108 Eisenberg et al.
- 30. ∂P ∂t ¼ Dp∇2P þ λ31nρ |fflffl{zfflffl} production by cells − λ32P |ffl{zffl} degradation [5] ∂G ∂t ¼ DG∇2 G − k21CmwR1nG |fflfflfflfflfflfflfflfflffl{zfflfflfflfflfflfflfflfflffl} binding − λ10G |ffl{zffl} degradation [6] ∂n ∂t ¼ Dn∇2n þ λ11nð1 − n n0 − μρÞ R2 R20 |fflfflfflfflfflfflfflfflfflfflfflfflfflfflfflfflffl{zfflfflfflfflfflfflfflfflfflfflfflfflfflfflfflfflffl} proliferation − ∇ · χn n R2 R20 ∇G ffiffiffiffiffiffiffiffiffiffiffiffiffiffiffiffiffiffiffiffiffiffiffiffiffiffi 1 þ λGj∇Gj2 p |fflfflfflfflfflfflfflfflfflfflfflfflfflffl{zfflfflfflfflfflfflfflfflfflfflfflfflfflffl} chemotaxis þ χ0 n IS n∇ρ ffiffiffiffiffiffiffiffiffiffiffiffiffiffiffiffiffiffiffiffiffiffiffi 1 þ λρj∇ρj2 q |fflfflfflfflfflfflfflfflfflfflfflfflfflfflffl{zfflfflfflfflfflfflfflfflfflfflfflfflfflfflffl} haptotaxis [7] Eqs. 1–3 constitute the receptor recycling ordinary differential equation (ODE) submodel, collectively representing growth factor receptor binding, internalization, degradation, and return to the cell surface. We assume that all the internalized ligand is degraded so that ligand return to the surface may be neglected. The receptor recycling submodel equations are multiplied by n∕n0 to scale the concentrations to the local cell density. The remaining PDEs are largely based on a previous model of tumor growth and movement in a Boyden chamber (29), up- dated and with modifications to incorporate MYOF effects and our particular experimental setup. The ECM, in Eq. 4, undergoes degradation by MMP (31) and includes a small remodeling term (30, 32–34). In Eq. 5, MMP is produced by the cells to degrade the matrix, and then degrades and diffuses. Because MMP is produced in response to the presence of extracellular matrix, we have modified this term from ref. 29 to be dependent on both n and ρ. Growth factor in Eq. 6 diffuses from below the xCELLi- gence well bottom, where it binds to free receptors on the cell surface, and is degraded at a constant rate. Lastly, tumor cells Eq. 7 begin above the ECM in the upper chamber, from which they then undergo dispersion, chemotaxis following the GF concentration gradient, haptotaxis through the ECM, following the ECM concentration gradient, and growth factor dependent proliferation based on the level of surface- bound growth factor (Fig. 2). Cell proliferation is modeled as logistic growth, to which we add an additional ECM-dependent term to account for additional crowding effects in the presence of ECM (35). The diffusion constants and other parameters are positive constants. Parameter Estimation. As discussed above, MYOF is known to affect a variety of membrane processes (6, 8, 11) and receptor/ protein recycling and transport (10, 12). Thus, we developed two versions of the membrane-related model parameters, under- lined in Eqs. 1–7, each characterizing the wild-type/lentiviral control and MYOF-KD cell types represented in our study. The two versions of the receptor recycling submodel para- meters in Eqs. 1–3 were determined by fitting to experimental receptor internalization data from wild-type and MYOF-null myoblasts [MYOF knockout (MYOF-KO)] cells (12), with the full details of the model parameterization given in SI Appendix. The resulting parameter estimates suggest that MYOF-deficient cells yield decreased GFR production, and increased receptor recycling pathways leading to receptor degradation. There are three MYOF-dependent parameters in the full PDE model which remain unaccounted for—the MMP secretion rate and the chemotactic and haptotactic sensitivity parameters. As MYOF-KD cells show decreased invasivity compared to wild- type/control cancer cells, we expect these parameters to decrease in the MYOF-KD case. The ODE submodel parameters show between a 13 and 40% change between wild-type and MYOF- KD parameter values, so we suppose χnm ¼ 0.75χn and χ0 nm ¼ 0.75χ0 n. As MMP has been shown to associate with MYOF (36) and MMP secretion is directly membrane-related, we would expect that λ31 will be more strongly affected by the MYOF-KD. Indeed, we found the best fits to the xCELLigence invasion data for a significantly lower value of λ31m, so that we take λ31m ¼ λ31∕100. The remaining non-MYOF-dependent PDE model parameters for both the wild-type/control and MYOF-KD cells were determined based on literature values (29, 30, 36, 37) (see SI Appendix, Tables 1 and 2 for individual references). Simulation Results. The overall model behavior for the wild-type/ control and MYOF-KD cells in the xCELLigence wells with 20% Matrigel coating are shown in SI Appendix, Figs. 3 and 4. Tumor cell invasion is more significant in wild-type/control than MYOF- KD cells, matching experimental data. Bound and internalized receptors tend to follow the invading front of tumor cells, with cells toward the top of the upper well tending to have more unbound receptors (as the GF has not diffused completely up the chamber). MMP also tends to roughly follow the invading front of tumor cells, as does degradation of ECM, with MMP production dropping off outside the ECM region. Applications to Cancer Cell Invasion Decreased Invasion in MYOF-KD Cells. Figs. 3 and 4 show model simulations compared to cell index experimental data in xCEL- Ligence wells for wild-type/control and MYOF-KD cells at 20% and 100% Matrigel concentrations. Model simulations recover the qualitative behavior of the experimental data, with a more significant decrease in invasivity for MYOF-KD cells in 100% Matrigel compared to 20% Matrigel. 0 5 10 15 20 25 0 0.05 0.1 0.15 0.2 0.25 0.3 0.35 Time (h) Cellindex Control MYOF KD MMP KD A B Fig. 3. Comparison between experimental data and simulation results with 20% Matrigel. (A) Experimental results for lentiviral control (LTV-ctrl) and MYOF-KD cells. (B) Simulation results for wild-type/control, MYOF-KD, and hypothetical MMP KD cells. Eisenberg et al. PNAS Early Edition ∣ 3 of 6 APPLIED MATHEMATICS MEDICALSCIENCES