NGIPS: Market Drivers, Architecture, and NSS Test Results
•
2 likes•710 views

NSS Labs’ Andrew Braunberg, Jason Pappalexis, and Thomas Skybakmoen provide you insights on why to invest in NGIPS technology highlighting the need for independent testing and what drives the NGIPS market.

Recommended
Recommended
More Related Content
Similar to NGIPS: Market Drivers, Architecture, and NSS Test Results
Similar to NGIPS: Market Drivers, Architecture, and NSS Test Results (20)
Recently uploaded
Recently uploaded (20)
NGIPS: Market Drivers, Architecture, and NSS Test Results
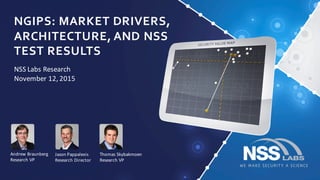
- 1. NGIPS: MARKET DRIVERS, ARCHITECTURE, AND NSS TEST RESULTS NSS Labs Research November 12, 2015 Jason Pappalexis Research Director Andrew Braunberg Research VP Thomas Skybakmoen Research VP
- 2. Slide 2 NSS Labs The World’s Leading Security Insight Company
- 3. Slide 3 NSS Labs Experts Andrew Braunberg Research VP Jason Pappalexis Research Director Thomas Skybakmoen Research VP
- 4. Slide 4 Agenda • The Need for Independent Testing • NGIPS Definition • Market and Market Drivers • Architectural & Deployment • NGIPS Group Test • Methodology • Results • NGIPS: Why invest in this technology? • Q&A
- 5. Slide 5 Trust me … I'm a security vendor
- 6. Slide 6 Unmatched Security Testing Expertise
- 7. Slide 7 NGIPS Defined Key Next Generation Characteristics Traditional IPS Plus: • Application Control • User Identification • Threat Intelligence Integration User Identification Application Control Reputation
- 8. Slide 8 State of the Market (CY2014) • Market Size • US$1.40B in 2014 • US$1.46B in 2015 (NSS est.) • Current buyers • Large Enterprise made up 46% of sales in 2014 • Evolving market requirements PLACEHOLDER for Pie Chart with Market Share leaders
- 9. Slide 9 Three Key Market Drivers 1. Security effectiveness • Increasingly complex threat landscape 2. Improve security workflow • Integration with signatureless products, SIEM, incident response 3. Architecture • Internal data center traffic + Perimeter
- 10. Slide 10 • Deployment options • Complexity • Protocol support • Network and Endpoint • Adjacent technology Architecture & Deployment
- 11. Slide 11 Group Test Results : Definitions TCO • Purchase • Maintenance -‐ incl. subscription fees • Administration – incl. installation and tuning Security Effectiveness • Equation: (Exploit Block Rate) x (Evasions) x (Stability and Reliability) TCO per Protected Mbps • Equation: (3-‐Year TCO)/(Security Effectiveness x NSS Tested Throughput)
- 12. Slide 12 Group Test Results: Protection and TCO Map TCO per Protected Mbps against Security Effectiveness • Further up and right is best — results can be surprising!
- 13. Slide 13 Group Test Results: Breakdown • Security • NGIPS protection ranged from 86.6% to 99.5% for overall security effectiveness. • Average Security Effectiveness Rating 96.3% • Evasion effectiveness 100% • Performance • Throughput 2,973 Mbps to 24,194 Mbps • Total Cost of Ownership (TCO) • 3-‐year TCO ranged from $68,596 to $489,236 • Average 3-‐year TCO was $253,213 • TCO per Protected Mbps • TCO per Protected Mbps ranged from 5 to 25 • Average TCO per Protected Mbps was US$20
- 14. Slide 14 2015 NGIPS Group Test Results NGIPS v2.0
- 15. Slide 15 NGIPS: Worth the Investment to You? • Architecturally straightforward • Signature-‐based + Signatureless technologies • Designed to perform at line-‐rate • Total cost of ownership • Becoming part of overall platform: Perimeter, Internal, Agent
- 16. Slide 16 In-‐Depth Research Market Analysis Buyers Guide Company Reports Technical Briefs Test Reports Comparatives Reports • Security Value Map • TCO • Security • Performance Product Test Reports
- 17. Thank you for your interest! www.nsslabs.com/reports