Facing the forces of change survey results segmented by total sales_october 2011
•
0 likes•379 views

Results of the online survey of ~390 distributors who participated in our 2010 Facing the Forces of Change research - segmented by Total Sales. Additional segmentations to be posted (by Customer Type, by Product Type)

Recommended
Recommended
More Related Content
What's hot
What's hot (10)
Viewers also liked
Viewers also liked (6)
Similar to Facing the forces of change survey results segmented by total sales_october 2011
Similar to Facing the forces of change survey results segmented by total sales_october 2011 (20)
Recently uploaded
Recently uploaded (20)
Facing the forces of change survey results segmented by total sales_october 2011
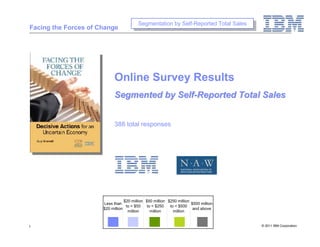
- 1. IBM Global Business Services Segmentation by Self-Reported Total Sales Facing the Forces of Change Segmentation by Self-Reported Total Sales Online Survey Results Segmented by Self-Reported Total Sales 388 total responses $20 million $50 million $250 million Less than $500 million to < $50 to < $250 to < $500 $20 million and above million million million 1 © 2011 IBM Corporation © Copyright IBM Corporation 2006
- 2. IBM Global Business Services Segmentation by Self-Reported Total Sales Facing the Forces of Change Segmentation by Self-Reported Total Sales Leading distributors are taking decisive actions and investing to position themselves for a complex future Decisive Actions for an Uncertain Economy Latest iteration of Facing the Forces of Change® Available via the N.A.W. website: http://www.naw.org/ Guy Blissett Guy Blissett Wholesale Distribution Lead Wholesale Distribution Lead IBM IBM Guy.Blissett@us.ibm.com Guy.Blissett@us.ibm.com (917) 224-9868 (917) 224-9868 $20 million $50 million $250 million Less than $500 million to < $50 to < $250 to < $500 $20 million and above million million million 2 © 2011 IBM Corporation © Copyright IBM Corporation 2006
- 3. IBM Global Business Services Segmentation by Self-Reported Total Sales Facing the Forces of Change Segmentation by Self-Reported Total Sales Total Sales segmentations $20 million $50 million $250 million Less than $500 million to < $50 to < $250 to < $500 $20 million and above million million million Notes: Notes: • •Number of respondents to each question varies… see Sample Size figure on Number of respondents to each question varies… see Sample Size figure on each chart for specifics each chart for specifics • •Y-axis scale differs from chart to chart… avoid using visual comparisons Y-axis scale differs from chart to chart… avoid using visual comparisons • •Each chart is an embedded Excel file Each chart is an embedded Excel file $20 million $50 million $250 million Less than $500 million to < $50 to < $250 to < $500 $20 million and above million million million 3 © 2011 IBM Corporation © Copyright IBM Corporation 2006
- 4. IBM Global Business Services Segmentation by Self-Reported Total Sales Facing the Forces of Change Segmentation by Self-Reported Total Sales Online survey participant Title Less than $20 million $20 milllion to < $50 million $50 million to < $250 million $250 million to < $500 million $500 million to over $1 billion 70% 67% 58% 60% 55% 50% 43% 38% 37% 38% Column % 40% 32% 29% 30% 19% 20% 17% 11% 8% 8% 7% 9% 10% 6% 7% 5% 6% 0% Chief Executive Of f icer / Director / Vice President Regional / Branch / Sales Other (describe in Chief Operating Of f icer / Manager comments box) Other C-suite / President $20 million $50 million $250 million Less than $500 million to < $50 to < $250 to < $500 Sample Size = 365 $20 million and above million million million 4 © 2011 IBM Corporation © Copyright IBM Corporation 2006
- 5. IBM Global Business Services Segmentation by Self-Reported Total Sales Facing the Forces of Change Segmentation by Self-Reported Total Sales Online survey participant Primary responsibility than $20 million Less $20 milllion to < $50 million $50 million to < $250 million $250 million to < $500 million $500 million to over $1 billion 80% 75% 72% 70% 70% 63% 60% 50% 46% Column % 40% 30% 23% 19% 20% 20% 20% 15% 12% 10% 10% 9% 10% 5% 6% 5% 2% 1% 2% 2%1% 0% 3% 3% 1% 2% 3% 0% 0% 1%0% 0% 0% 0%0% 0% 0% 0% 0% 0% Executive / Sales / C usto m er Supply C hain / P ro curem ent Finance / Info rm atio n Other M anagem ent M arketing / Service Lo gistics A cco unting Techno lo gy (describe in D em and co m m ents Fulfillm ent bo x) $20 million $50 million $250 million Sample Size = 363 Less than $500 million to < $50 to < $250 to < $500 $20 million and above million million million 5 © 2011 IBM Corporation © Copyright IBM Corporation 2006
- 6. IBM Global Business Services Segmentation by Self-Reported Total Sales Facing the Forces of Change Segmentation by Self-Reported Total Sales Online survey participant Organization size (Total Annual Sales) Less than $20 million $20 milllion to < $50 million $50 million to < $250 million $250 million to < $500 million $500 million to over $1 billion 120% 100% 100% 100% 100% 100% 80% Column % 57% 60% 43% 40% 20% 0%0%0%0% 0% 0%0%0% 0%0% 0%0% 0%0%0% 0% 0%0%0%0% 0%0%0%0% 0% Less than $20 $20 million to $50 million to $250 million to $500 million to $1 billion or more million $50 million $250 million $500 million $1 billion $20 million $50 million $250 million Sample Size = 367 Less than $500 million to < $50 to < $250 to < $500 $20 million and above million million million 6 © 2011 IBM Corporation © Copyright IBM Corporation 2006
- 7. IBM Global Business Services Segmentation by Self-Reported Total Sales Facing the Forces of Change Segmentation by Self-Reported Total Sales Online survey participant Ownership Less than $20 million structure $20 milllion to < $50 million $50 million to < $250 million $250 million to < $500 million $500 million to over $1 billion 99% 100% 100% 95% 90% 85% 80% 70% 60% Column % 53% 50% 47% 40% 30% 20% 15% 10% 5% 1% 0% 0% Privately Held Publicly Traded $20 million $50 million $250 million Sample Size = 360 Less than $500 million to < $50 to < $250 to < $500 $20 million and above million million million 7 © 2011 IBM Corporation © Copyright IBM Corporation 2006
- 8. IBM Global Business Services Segmentation by Self-Reported Total Sales Facing the Forces of Change Segmentation by Self-Reported Total Sales Online survey participant GeographicLess than $20 < $500 million sales to million $250 million coverage $20 milllion to < $50 million $500 million to over $1 billion $50 million to < $250 million 60% 51% 48% 50% 45% 44% 41% 42% 40% 37% Column % 30% 30% 25% 25% 21% 20% 16% 18%19% 14% 9% 10% 10% 4% 0% 0% 0% Local: We serve Regional: We serve Multi-Regional / National: Multi-National: We serve customers w ithin a single, customers w ithin multiple We serve customers in customers both inside local geographic market geographic markets in a multiple regions of North and outside North single region of North America A merica America $20 million $50 million $250 million Sample Size = 355 Less than $500 million to < $50 to < $250 to < $500 $20 million and above million million million 8 © 2011 IBM Corporation © Copyright IBM Corporation 2006
- 9. IBM Global Business Services Segmentation by Self-Reported Total Sales Facing the Forces of Change Segmentation by Self-Reported Total Sales Online survey participant $20 milllion to < $50 million Less than $20 million $50 million to < $250 million Organization’s majority customer type $1 billion $250 million to < $500 million $500 million to over 50% 47% 45% 39% 40% 36% 34% 35% 33% 31% 29% 30% 28% Column % 24%24% 25% 21% 20% 20% 18% 18% 16% 15% 15% 11% 9% 9% 10% 7% 5% 4% 3% 3% 2%3% 5% 1% 2% 1% 0% 2% 0% 0% 2% 0% 0% 0% 0% 0% 0% 0% Co ntracto rs Industrial Retail sto res Co m m ercial Health care Independent N o n-pro fit and Other m anufacturing facilities pro vider and chain Go vernm ent who lesaler- facilities restaurants, institutio ns distributo rs cafeterias $20 million $50 million $250 million Sample Size = 347 Less than $500 million to < $50 to < $250 to < $500 $20 million and above million million million 9 © 2011 IBM Corporation © Copyright IBM Corporation 2006
- 10. IBM Global Business Services Segmentation by Self-Reported Total Sales Facing the Forces of Change Segmentation by Self-Reported Total Sales Online survey participant $20 milllion to < $50 million Less than $20 million $50 million to < $250 million Organization’s type of sales million to over $1 billion $250 million to < $500 million $500 70% 63% 60% 56% 50% 48% 46% 40% 41% 39% Column % 40% 34% 29% 30% 29% 30% 20% 14% 15% 11% 10% 7% 0% General Line Firm: 90% of sales Specialty Firm: 90% of sales f rom Limited Firm: 90% of sales f rom a f rom more than f ive lines of trade tw o to f ive lines of trade single line of trade $20 million $50 million $250 million Sample Size = 342 Less than $500 million to < $50 to < $250 to < $500 $20 million and above million million million 10 © 2011 IBM Corporation © Copyright IBM Corporation 2006
- 11. IBM Global Business Services Segmentation by Self-Reported Total Sales Facing the Forces of Change Segmentation by Self-Reported Total Sales Online survey participant Organization’s primary products to < $50 million Less than $20 million $20 milllion $50 million to < $250 million $250 million to < $500 million $500 million to over $1 billion 35% 30% 30% 28% 28% 27% 26% 25% 23% 22% 21% 21% 20% 19% 20% Column % 18% 19% 19% 19% 20% 18% 17% 17% 17% 15% 15% 13% 12% 11% 10% 7% 5% 4% 5% 3% 0% 0% 0% MRO: OEM: Components Equipment: Capital Resale f or retail: Resale f or Other (describe in maintenance, incorporated into equipment Finished products service: Finished comments box) repair, and another product products f or resale to products to operations of consumers service customer f acilities customer’s customer $20 million $50 million $250 million Less than $500 million to < $50 to < $250 to < $500 $20 million and above million million million Sample Size = 340 11 © 2011 IBM Corporation © Copyright IBM Corporation 2006
- 12. IBM Global Business Services Segmentation by Self-Reported Total Sales Facing the Forces of Change Segmentation by Self-Reported Total Sales Company Strategy: Sell product and offer fee-based services 100% 90% 79% 80% 70% 60% 54% 52% 53% 50% 46% 38% 37% 40% 35% 33% 30% 19% 20% 14% 13% 10% 10% 7% 10% 0% Our company has no plans to do Our company does this today Our company does not do this this today, but w ill by 2015 $20 million $50 million $250 million Less than $500 million to < $50 to < $250 to < $500 $20 million and above million million million Sample Size = 285 12 © 2011 IBM Corporation © Copyright IBM Corporation 2006
- 13. IBM Global Business Services Segmentation by Self-Reported Total Sales Facing the Forces of Change Segmentation by Self-Reported Total Sales Company Strategy: Services available to customers even if no product is purchased 100% 90% 80% 70% 64% 60% 53% 54% 49% 50% 46% 45% 44% 42% 40% 32% 30% 21% 20% 15% 14% 10% 10% 5% 4% 0% Our company has no plans to do Our company does this today Our company does not do this this today, but w ill by 2015 $20 million $50 million $250 million Less than $500 million to < $50 to < $250 to < $500 $20 million and above million million million Sample Size = 278 13 © 2011 IBM Corporation © Copyright IBM Corporation 2006
- 14. IBM Global Business Services Segmentation by Self-Reported Total Sales Facing the Forces of Change Segmentation by Self-Reported Total Sales Company Strategy: Offer third-party logistics to customers as a fee-based service 100% 90% 80% 70% 65% 62% 60% 60% 50% 43% 42% 40% 33% 29% 29% 30% 25% 27% 25% 23% 20% 12% 13% 13% 10% 0% Our company has no plans to do Our company does this today Our company does not do this this today, but w ill by 2015 $20 million $50 million $250 million Less than $500 million to < $50 to < $250 to < $500 $20 million and above million million million Sample Size = 276 14 © 2011 IBM Corporation © Copyright IBM Corporation 2006
- 15. IBM Global Business Services Segmentation by Self-Reported Total Sales Facing the Forces of Change Segmentation by Self-Reported Total Sales Company Strategy: Optimize network design (i.e., #, size, location of branches, DCs) 100% 90% 78% 80% 71% 70% 60% 55% 49% 51% 50% 40% 36% 30% 27% 25% 24% 21% 19% 20% 15% 13% 7% 9% 10% 0% Our company has no plans to do Our company does this today Our company does not do this this today, but w ill by 2015 $20 million $50 million $250 million Less than $500 million to < $50 to < $250 to < $500 $20 million and above million million million Sample Size = 271 15 © 2011 IBM Corporation © Copyright IBM Corporation 2006
- 16. IBM Global Business Services Segmentation by Self-Reported Total Sales Facing the Forces of Change Segmentation by Self-Reported Total Sales Company Strategy: Outsource warehouse operations to < $50 million $50 million to < $250 million Less than $20 million $20 milllion to a third-party $250 million to < $500 million $500 million to over $1 billion 100% 93% 89% 89% 87% 90% 86% 80% 70% 60% Column % 50% 40% 30% 20% 10% 9% 9% 9% 7% 10% 4% 5% 0% 1% 2% 0% Our company has no plans to do Our company does this today Our company does not do this this today, but w ill by 2015 $20 million $50 million $250 million Less than $500 million to < $50 to < $250 to < $500 $20 million and above million million million Sample Size = 270 16 © 2011 IBM Corporation © Copyright IBM Corporation 2006
- 17. IBM Global Business Services Segmentation by Self-Reported Total Sales Facing the Forces of Change Segmentation by Self-Reported Total Sales Company Strategy: Outsource additional non-core administrative activities 100% 90% 80% 71% 71% 70% 66% 63% 60% 55% 50% 40% 34% 28% 30% 24% 24% 21% 20% 13% 11% 5% 7% 10% 5% 0% Our company has no plans to do Our company does this today Our company does not do this this today, but w ill by 2015 $20 million $50 million $250 million Less than $500 million to < $50 to < $250 to < $500 $20 million and above million million million Sample Size = 272 17 © 2011 IBM Corporation © Copyright IBM Corporation 2006
- 18. IBM Global Business Services Segmentation by Self-Reported Total Sales Facing the Forces of Change Segmentation by Self-Reported Total Sales Company Strategy: Outsource elements of IT infrastructure (e.g., applications, server) 100% 90% 80% 70% 60% 55% 49% 50% 50% 45% 47% 40% 40% 36% 36% 36% 32% 30% 20% 20% 15% 15% 14% 9% 10% 0% Our company has no plans to do Our company does this today Our company does not do this this today, but w ill by 2015 $20 million $50 million $250 million Less than $500 million to < $50 to < $250 to < $500 $20 million and above million million million Sample Size = 272 18 © 2011 IBM Corporation © Copyright IBM Corporation 2006
- 19. IBM Global Business Services Segmentation by Self-Reported Total Sales Facing the Forces of Change Segmentation by Self-Reported Total Sales Company Strategy: Create and/or grow presence in geographic markets outside U.S. 100% 90% 80% 70% 65% 61% 63% 60% 56% 54% 50% 38% 40% 29% 27% 30% 25% 20% 20% 16% 15% 12% 13% 8% 10% 0% Our company has no plans to do Our company does this today Our company does not do this this today, but w ill by 2015 $20 million $50 million $250 million Less than $500 million to < $50 to < $250 to < $500 $20 million and above million million million Sample Size = 273 19 © 2011 IBM Corporation © Copyright IBM Corporation 2006
- 20. IBM Global Business Services Segmentation by Self-Reported Total Sales Facing the Forces of Change Segmentation by Self-Reported Total Sales Company Strategy: Stop doing business with highly unprofitable customers 100% 90% 82% 79% 78% 80% 70% 71% 70% 60% 50% 40% 30% 21% 21% 20% 14% 13% 9% 11% 7% 8% 7% 9% 10% 0% Our company has no plans to do Our company does this today Our company does not do this this today, but w ill by 2015 $20 million $50 million $250 million Less than $500 million to < $50 to < $250 to < $500 $20 million and above million million million Sample Size = 278 20 © 2011 IBM Corporation © Copyright IBM Corporation 2006
- 21. IBM Global Business Services Segmentation by Self-Reported Total Sales Facing the Forces of Change Segmentation by Self-Reported Total Sales Company Strategy: Manufacture our own private-label products in an overseas plant 100% 90% 80% 76% 75% 71% 70% 64% 60% 55% 50% 40% 36% 30% 22% 21% 20% 15% 15% 11% 13% 9% 9% 7% 10% 0% Our company has no plans to do Our company does this today Our company does not do this this today, but w ill by 2015 $20 million $50 million $250 million Less than $500 million to < $50 to < $250 to < $500 $20 million and above million million million Sample Size = 272 21 © 2011 IBM Corporation © Copyright IBM Corporation 2006
- 22. IBM Global Business Services Segmentation by Self-Reported Total Sales Facing the Forces of Change Segmentation by Self-Reported Total Sales Company Strategy: Market our own private label products 100% 90% 80% 68% 70% 60% 49% 50% 50% 46% 46% 39% 39% 40% 33% 29% 30% 21% 18% 17% 20% 15% 14% 14% 10% 0% Our company has no plans to do Our company does this today Our company does not do this this today, but w ill by 2015 $20 million $50 million $250 million Less than $500 million to < $50 to < $250 to < $500 $20 million and above million million million Sample Size = 275 22 © 2011 IBM Corporation © Copyright IBM Corporation 2006
- 23. IBM Global Business Services Segmentation by Self-Reported Total Sales Facing the Forces of Change Segmentation by Self-Reported Total Sales Company Strategy: Participate in distributor buying group/ marketing alliance 100% 90% 80% 69% 70% 64% 60% 60% 56% 55% 50% 41% 40% 29% 29% 29% 30% 25% 20% 15% 12% 5% 7% 10% 5% 0% Our company has no plans to do Our company does this today Our company does not do this this today, but w ill by 2015 $20 million $50 million $250 million Less than $500 million to < $50 to < $250 to < $500 $20 million and above million million million Sample Size = 282 23 © 2011 IBM Corporation © Copyright IBM Corporation 2006
- 24. IBM Global Business Services Segmentation by Self-Reported Total Sales Facing the Forces of Change Segmentation by Self-Reported Total Sales Company Strategy: Create strategy for current and future human capital requirements 100% 90% 86% 79% 80% 70% 70% 60% 55% 48% 50% 40% 33% 28% 30% 24% 19% 20% 13% 10% 13% 7% 8% 7% 10% 0% Our company has no plans to do Our company does this today Our company does not do this this today, but w ill by 2015 $20 million $50 million $250 million Less than $500 million to < $50 to < $250 to < $500 $20 million and above Sample Size = 276 million million million 24 © 2011 IBM Corporation © Copyright IBM Corporation 2006
- 25. IBM Global Business Services Segmentation by Self-Reported Total Sales Facing the Forces of Change Segmentation by Self-Reported Total Sales Factors Impacting - Today: Increased product traceability 60% 57% 49% 48% 50% 45% 40% 38% 34% 33% 29% 29% 29% 30% 25% 23% 21% 21% 20% 17% 10% 0% Less signif icant Moderately signif icant More signif icant $20 million $50 million $250 million Sample Size = 273 Less than $500 million to < $50 to < $250 to < $500 $20 million and above million million million 25 © 2011 IBM Corporation © Copyright IBM Corporation 2006
- 26. IBM Global Business Services Segmentation by Self-Reported Total Sales Facing the Forces of Change Segmentation by Self-Reported Total Sales Factors Impacting - Future: Increased product traceability 60% 53% 50% 50% 38% 38% 40% 37% 36% 35% 33% 32% 30% 30% 30% 26% 25% 21% 20% 17% 10% 0% Less signif icant Moderately signif icant More signif icant $20 million $50 million $250 million Sample Size = 230 Less than $500 million to < $50 to < $250 to < $500 $20 million and above million million million 26 © 2011 IBM Corporation © Copyright IBM Corporation 2006
- 27. IBM Global Business Services Segmentation by Self-Reported Total Sales Facing the Forces of Change Segmentation by Self-Reported Total Sales Factors Impacting - Today: Growth ofLess million$20business$20 milllion to <over $1 billion greento <million million $500 million to $50 million $250 than $500 segments $50 million to < $250 million 70% 62% 60% 57% 48% 49% 50% 40% Column % 40% 36% 29% 29% 30% 27% 25% 24% 24% 21% 20% 14% 14% 10% 0% Less signif icant Moderately signif icant More signif icant $20 million $50 million $250 million Sample Size = 274 Less than $500 million to < $50 to < $250 to < $500 $20 million and above million million million 27 © 2011 IBM Corporation © Copyright IBM Corporation 2006
- 28. IBM Global Business Services Segmentation by Self-Reported Total Sales Facing the Forces of Change Segmentation by Self-Reported Total Sales Factors Impacting - Future: Growth of green business segments 58% 58% 60% 52% 50% 46% 43% 43% 40% 37% 38% 32% 30% 25% 20% 16% 16% 17% 14% 10% 5% 0% Less signif icant Moderately signif icant More signif icant $20 million $50 million $250 million Sample Size = 232 Less than $500 million to < $50 to < $250 to < $500 $20 million and above million million million 28 © 2011 IBM Corporation © Copyright IBM Corporation 2006
- 29. IBM Global Business Services Segmentation by Self-Reported Total Sales Facing the Forces of Change Segmentation by Self-Reported Total Sales Factors Impacting - Today: Disintermediation Less than $20 million $20 milllion to < $50 million $50 million to < $250 million $250 million to < $500 million $500 million to over $1 billion 50% 45% 43% 41% 40% 39% 40% 36% 34% 33% 30% 28% Column % 25% 24% 24% 21% 20% 15% 10% 0% Less signif icant Moderately signif icant More signif icant $20 million $50 million $250 million Less than $500 million to < $50 to < $250 to < $500 $20 million and above Sample Size = 270 million million million 29 © 2011 IBM Corporation © Copyright IBM Corporation 2006
- 30. IBM Global Business Services Segmentation by Self-Reported Total Sales Facing the Forces of Change Segmentation by Self-Reported Total Sales Factors Impacting - Future: Disintermediation Less than $20 million $20 milllion to < $50 million $50 million to < $250 million $250 million to < $500 million $500 million to over $1 billion 60% 58% 50% 48% 46% 42% 40% 38% 37% 35% 33% 33% Column % 32% 32% 30% 25% 20% 16% 15% 11% 10% 0% Less signif icant Moderately signif icant More signif icant $20 million $50 million $250 million Sample Size = 231 Less than $500 million to < $50 to < $250 to < $500 $20 million and above million million million 30 © 2011 IBM Corporation © Copyright IBM Corporation 2006
- 31. IBM Global Business Services Segmentation by Self-Reported Total Sales Facing the Forces of Change Segmentation by Self-Reported Total Sales Factors Impacting - Today: Private label products Less than $20 million $20 milllion to < $50 million $50 million to < $250 million $250 million to < $500 million $500 million to over $1 billion 50% 45% 45% 43% 43% 41% 40% 40% 40% 38% 35% 33% 33% 32% 29% 30% 28% Column % 26% 25% 20% 15% 14% 15% 10% 5% 0% Less signif icant Moderately signif icant More signif icant $20 million $50 million $250 million Less than $500 million to < $50 to < $250 to < $500 $20 million and above Sample Size = 271 million million million 31 © 2011 IBM Corporation © Copyright IBM Corporation 2006
- 32. IBM Global Business Services Segmentation by Self-Reported Total Sales Facing the Forces of Change Segmentation by Self-Reported Total Sales Factors Impacting - Future: Private label products Less than $20 million $20 milllion to < $50 million $50 million to < $250 million $250 million to < $500 million $500 million to over $1 billion 60% 53% 50% 50% 41% 42% 40% 39% 40% 36% 35% Column % 31% 29% 30% 25% 24% 25% 25% 20% 10% 5% 0% Less signif icant Moderately signif icant More signif icant $20 million $50 million $250 million Sample Size = 231 Less than $500 million to < $50 to < $250 to < $500 $20 million and above million million million 32 © 2011 IBM Corporation © Copyright IBM Corporation 2006
- 33. IBM Global Business Services Segmentation by Self-Reported Total Sales Facing the Forces of Change Segmentation by Self-Reported Total Sales Factors Impacting - Today: End customer consolidation Less than $20 million $20 milllion to < $50 million $50 million to < $250 million $250 million to < $500 million $500 million to over $1 billion 60% 56% 50% 50% 50% 43% 43% 40% 40% 38% 35% Column % 29% 28% 30% 25% 21% 19% 20% 16% 10% 7% 0% Less signif icant Moderately signif icant More signif icant $20 million $50 million $250 million Less than $500 million to < $50 to < $250 to < $500 $20 million and above Sample Size = 271 million million million 33 © 2011 IBM Corporation © Copyright IBM Corporation 2006
- 34. IBM Global Business Services Segmentation by Self-Reported Total Sales Facing the Forces of Change Segmentation by Self-Reported Total Sales Factors Impacting - Future: End customer than $20 million Less consolidation milllion to < $50 million $20 $50 million to < $250 million $250 million to < $500 million $500 million to over $1 billion 58% 60% 49% 48% 50% 47% 47% 44% 42% 42% 40% 37% Column % 30% 25% 20% 17% 17% 14% 10% 8% 5% 0% Less signif icant Moderately signif icant More signif icant $20 million $50 million $250 million Sample Size = 230 Less than $500 million to < $50 to < $250 to < $500 $20 million and above million million million 34 © 2011 IBM Corporation © Copyright IBM Corporation 2006
- 35. IBM Global Business Services Segmentation by Self-Reported Total Sales Facing the Forces of Change Segmentation by Self-Reported Total Sales Factors Impacting - Today: Supplier consolidation Less than $20 million $20 milllion to < $50 million $50 million to < $250 million $250 million to < $500 million $500 million to over $1 billion 60% 57% 55% 50% 50% 50% 43% 40% 38% 36% 33% Column % 29% 30% 27% 21% 19% 20% 16% 14% 12% 10% 0% Less signif icant Moderately signif icant More signif icant $20 million $50 million $250 million Sample Size = 272 Less than $500 million to < $50 to < $250 to < $500 $20 million and above million million million 35 © 2011 IBM Corporation © Copyright IBM Corporation 2006
- 36. IBM Global Business Services Segmentation by Self-Reported Total Sales Facing the Forces of Change Segmentation by Self-Reported Total Sales Factors Impacting - Future: Supplier consolidation Less than $20 million $20 milllion to < $50 million $50 million to < $250 million $250 million to < $500 million $500 million to over $1 billion 70% 63% 60% 52% 51% 50% 48% 50% 42% 42% Column % 40% 37% 32% 30% 25% 25% 20% 13% 10% 10% 6% 5% 0% Less signif icant Moderately signif icant More signif icant $20 million $50 million $250 million Sample Size = 229 Less than $500 million to < $50 to < $250 to < $500 $20 million and above million million million 36 © 2011 IBM Corporation © Copyright IBM Corporation 2006
- 37. IBM Global Business Services Segmentation by Self-Reported Total Sales Facing the Forces of Change Segmentation by Self-Reported Total Sales Factors Impacting - Today: Industry consolidation Less than $20 million $20 milllion to < $50 million $50 million to < $250 million $250 million to < $500 million $500 million to over $1 billion 50% 45% 45% 46% 45% 45% 45% 43% 43% 41% 40% 40% 40% 35% 30% Column % 25% 20% 15% 14% 15% 15% 14% 10% 10% 5% 0% Less signif icant Moderately signif icant More signif icant $20 million $50 million $250 million Less than $500 million to < $50 to < $250 to < $500 $20 million and above Sample Size = 270 million million million 37 © 2011 IBM Corporation © Copyright IBM Corporation 2006
- 38. IBM Global Business Services Segmentation by Self-Reported Total Sales Facing the Forces of Change Segmentation by Self-Reported Total Sales Factors Impacting - Future: Industry consolidation Less than $20 million $20 milllion to < $50 million $50 million to < $250 million $250 million to < $500 million $500 million to over $1 billion 68% 70% 57% 58% 60% 52% 51% 50% 44% 44% 42% Column % 40% 37% 30% 26% 20% 10% 6% 5% 4% 5% 0% 0% Less signif icant Moderately signif icant More signif icant $20 million $50 million $250 million Sample Size = 230 Less than $500 million to < $50 to < $250 to < $500 $20 million and above million million million 38 © 2011 IBM Corporation © Copyright IBM Corporation 2006
- 39. IBM Global Business Services Segmentation by Self-Reported Total Sales Facing the Forces of Change Segmentation by Self-Reported Total Sales Factors Impacting - Today: Overseas competitor expansion Less than $20 million $20 milllion to < $50 million $50 million to < $250 million $250 million to < $500 million $500 million to over $1 billion 58% 60% 50% 47% 43% 41% 42% 40% 37% 36% 35% 33% Column % 30% 30% 26% 25% 20% 17% 16% 15% 10% 0% Less signif icant Moderately signif icant More signif icant $20 million $50 million $250 million Sample Size = 267 Less than $500 million to < $50 to < $250 to < $500 $20 million and above million million million 39 © 2011 IBM Corporation © Copyright IBM Corporation 2006
- 40. IBM Global Business Services Segmentation by Self-Reported Total Sales Facing the Forces of Change Segmentation by Self-Reported Total Sales Factors Impacting - Future: Overseas competitormillion Less than $20 expansion to < $50 million $20 milllion $50 million to < $250 million $250 million to < $500 million $500 million to over $1 billion 60% 52% 50% 50% 41% 42% 39% 40% 37% 37% 37% Column % 30% 24% 23% 25% 25% 25% 21% 22% 20% 10% 0% Less signif icant Moderately signif icant More signif icant $20 million $50 million $250 million Sample Size = 230 Less than $500 million to < $50 to < $250 to < $500 $20 million and above million million million 40 © 2011 IBM Corporation © Copyright IBM Corporation 2006
- 41. IBM Global Business Services Segmentation by Self-Reported Total Sales Facing the Forces of Change Segmentation by Self-Reported Total Sales Factors Impacting - Today: Macro-economic impact of crisis Less than $20 million $20 milllion to < $50 million $50 million to < $250 million $250 million to < $500 million $500 million to over $1 billion 80% 75% 69% 70% 67% 67% 62% 60% 50% Column % 40% 30% 26% 28% 27% 23% 20% 20% 15% 10% 7% 7% 3% 5% 0% Less signif icant Moderately signif icant More signif icant $20 million $50 million $250 million Sample Size = 269 Less than $500 million to < $50 to < $250 to < $500 $20 million and above million million million 41 © 2011 IBM Corporation © Copyright IBM Corporation 2006