
Recommended
More Related Content
What's hot
What's hot (20)
Similar to BCG Matrix Explaint
Similar to BCG Matrix Explaint (20)
Recently uploaded
Recently uploaded (20)
BCG Matrix Explaint
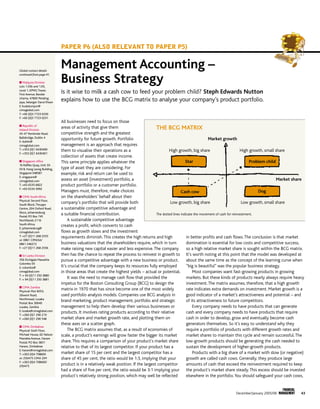
- 1. Global contact details continued from page 41. n Malaysia Division Lots 1.03b and 1.05, Level 1, KPMG Tower, First Avenue, Bandar Utama, 47800 Petaling Jaya, Selangor Darul Ehsan E: kualalumpur@ cimaglobal.com T: +60 (0)3 7723 0230 F: +60 (0)3 7723 0231 n Republic of Ireland Division 45-47 Pembroke Road, Ballsbridge, Dublin 4 E: dublin@ cimaglobal.com T: +353 (0)1 6430400 F: +353 (0)1 6430401 n Singapore office 16 Raffles Quay, Unit 33- 03 B, Hong Leong Building, Singapore 048581 E: singapore@ cimaglobal.com T: +65 6535 6822 F: +65 6534 3992 n CIMA South Africa Physical: Second Floor, South Block, Thrupps Centre, 204 Oxford Road, Illovo, Johannesburg Postal: PO Box 745 Northlands 2116 South Africa E: johannesburg@ cimaglobal.com T: +27 (0)11 268 2555 or: 0861 CIMASA/ 0861 246272 F: +27 (0)11 268 2556 n Sri Lanka Division 356 Elvitigala Mawatha Colombo 05 E: colombo@ cimaglobal.com T: + 94 (0)11 250 3880 F: + 94 (0)11 250 3881 n CIMA Zambia Physical: Plot 6053, Sibweni Road, Northmead, Lusaka Postal: Box 30640 Lusaka, Zambia E: lusaka@cimaglobal.com T: +260 (0)1 290 219 F: +260 (0)1 290 548 n CIMA Zimbabwe Physical: Sixth Floor, Michael House, 62 Nelson Mandela Avenue, Harare Postal: PO Box 3831 Harare, Zimbabwe E: harare@cimaglobal.com T: +263 (0)4 708600 or: 250475 CIMA ZIM F: +263 (0)4 708600/ 250475 High growth, big share High growth, small share Market share Star Problem child Cash cow Dog Low growth, big share Low growth, small share financial pAPER p6 (also relevant to paper p5) Management Accounting – Business Strategy Is it wise to milk a cash cow to feed your problem child? Steph Edwards Nutton explains how to use the BCG matrix to analyse your company’s product portfolio. Market growth The dotted lines indicate the movement of cash for reinvestment. December/January 2005/06 management 43 All businesses need to focus on those areas of activity that give them competitive strength and the greatest opportunity for future growth. Portfolio management is an approach that requires them to visualise their operations as a collection of assets that create income. This same principle applies whatever the type of asset they are considering. For example, risk and return can be used to assess an asset (investment) portfolio, a product portfolio or a customer portfolio. Managers must, therefore, make choices on the shareholders’ behalf about their company’s portfolio that will provide both a sustainable competitive advantage and a suitable financial contribution. A sustainable competitive advantage THE BCG MATRIX creates a profit, which converts to cash flows as growth slows and the investment requirements diminish. This creates the high returns and high business valuations that the shareholders require, which in turn make raising new capital easier and less expensive. The company then has the chance to repeat the process to reinvest in growth to pursue a competitive advantage with a new business or product. It’s crucial that the company keeps its resources fully employed in those areas that create the highest yields – actual or potential. It was the need to manage cash flow that provided the impetus for the Boston Consulting Group (BCG) to design the matrix in 1970 that has since become one of the most widely used portfolio analysis models. Companies use BCG analysis in brand marketing, product management, portfolio and strategic management to help them develop their various businesses or products. It involves rating products according to their relative market share and market growth rate, and plotting them on these axes on a scatter graph. The BCG matrix assumes that, as a result of economies of scale, a product’s earnings will grow faster the bigger its market share. This requires a comparison of your product’s market share relative to that of its largest competitor. If your product has a market share of 15 per cent and the largest competitor has a share of 45 per cent, the ratio would be 1:3, implying that your product is in a relatively weak position. If the largest competitor had a share of five per cent, the ratio would be 3:1 implying your product’s relatively strong position, which may well be reflected in better profits and cash flows. The conclusion is that market domination is essential for low costs and competitive success, so a high relative market share is sought within the BCG matrix. It’s worth noting at this point that the model was developed at about the same time as the concept of the learning curve when “big is beautiful” was the popular business strategy. Most companies want fast-growing products in growing markets. But these kinds of products nearly always require heavy investment. The matrix assumes, therefore, that a high growth rate indicates extra demands on investment. Market growth is a good indicator of a market’s attractiveness and potential – and of its attractiveness to future competitors. Every company needs to have products that can generate cash and every company needs to have products that require cash in order to develop, grow and eventually become cash generators themselves. So it’s easy to understand why they require a portfolio of products with different growth rates and market shares to maintain this cycle and remain successful. The low-growth products should be generating the cash needed to sustain the development of higher-growth products. Products with a big share of a market with slow (or negative) growth are called cash cows. Generally, they produce large amounts of cash that exceed the reinvestment required to keep the product’s market share steady. This excess should be invested elsewhere in the portfolio. You should safeguard your cash cows,
- 2. because they are the firm’s main cash generators. If protected, they will continue to fund their own position in the market, pay for dividends, fund R&D and subsidise higher-growth products. Products with a small share of a market with slow (or negative) growth are called dogs. They often show an accounting profit, but all of this must be reinvested to maintain their place in the market, leaving no extra cash for reinvestment elsewhere. They do not, therefore, support the rest of the portfolio. The BCG recommends that dogs are dropped, but the following questions must be answered before such action is taken: n Does the product still make a positive contribution? n What impact would dropping the dog have on the rest of the portfolio? Does the product influence the overall image of the company? Does it attract customers to the business? n Are the dog’s competitors likely to leave its market? If they do, its market share will grow by default and it will become a cash cow. In the late nineties Reckitt & Colman disposed of its mustard division and acquired a number of manufacturers of industrial toiletries products – a market with low margins and no growth. But these acquisitions allowed it to build a significant market share, so turning a dog into a cash cow. Products with a small share of a high-growth market are commonly known as problem children. They often require more cash to be invested in them than they themselves will return. If sufficient cash isn’t available, they often fail. The main feature of a problem child is that a lot of money must be invested for it to gain a bigger market share. The risk is that this high-investment product could become a liability if it doesn’t move towards the cash cow position and become a market leader, so a company must decide between investing large sums in the product to build market share or dropping it before it absorbs unnecessary amounts of money that it won’t be able to repay. Products with a big share of a high-growth market are called stars. They often generate a profit but may not always generate sufficient cash to sustain themselves. If a product is able to stay in this position, it should eventually become a cash cow when growth slows down and investment requirements diminish. Eventually, therefore, this product should create money to reinvest elsewhere in the portfolio. But a star must be invested in throughout its growth phase in order to do achieve this. The portfolio concept is simple to understand but less easy to apply. It’s often based on the idea that supserior profits depend largely on having a competitive advantage, and that growth can be achieved only if the market itself is growing. A superior market share often carries a competitive advantage, but this is not always the case. A competitive advantage could be based on advanced technology, quality, attention to specific customer requirements, location or speed of response – many factors that may or may not create overall market leadership. Companies may even choose to gain a competitive advantage via “focused” strategies that may involve contraction, not growth. A further problem with the portfolio concept is its idea of investing in market growth. The broad, large-scale market growth of the sixties and seventies is now a somewhat elusive goal. Growth occurred then as a result of a general high demand as consumers became more aware of what was on offer to them. But today’s consumers are more sophisticated and growth is now more likely to be stimulated by substitution, both of products and of better ways of doing things. Creating and exploiting growth opportunities requires a lot of insight, market awareness and risk-taking. In many cases, growth is where you make it – opportunities may in fact be lying dormant in areas widely considered too mature to grow any further. The BCG matrix ranks only market share and market growth, implying that profitability is the purpose of any enterprise. It overlooks other factors of industry attractiveness and competitive advantage. For example, it’s possible that particular products classed as dogs by the matrix can make a profitable contribution without requiring any extra cash from other products. Even though Paper p6 (also relevant to paper P5) financial 44 management December/January 2006/07 Photographs: iStockphoto
- 3. the market they are in may not be growing and their share of it may not be big, dogs can still create value in a portfolio, so it is not always a wise decision to shoot them. Also, many companies have entire portfolios with no market leaders – ie, no cash cows or stars. In this case it would be most unwise to disinvest in products that are profitable and require little support from elsewhere in the portfolio. Criticisms about the simplicity of the BCG matrix have been addressed to some extent by General Electric’s business screen matrix, which assesses a range of factors along the axes of business strength and industry attractiveness. Another major pitfall of the BCG matrix is its suggestion that cash cows should be milked in order to fund other products in the portfolio. But research has shown that, of all the products to be defended, it is the brand leader that needs the most protection. It may be generating large cash flows, but it should not be milked so extensively as to leave it vulnerable to attack by the competition. The only real link between products identified by the BCG matrix is that of the movement of cash. But other potential links do exist. The sale of one product may generate sales for another product via cross-selling (a simultaneous purchase) or sell-through (a later purchase). Many products in a portfolio may share the same fixed costs, so shooting a dog might make other products uneconomic. Dropping one product may, therefore, have a negative impact upon the rest of the portfolio. The concept of real portfolio analysis should recognise the group of products as a unit and the effects that they have on each other. One criticism of any prescriptive model, particularly the BCG matrix, is that the organisation using it becomes predictable, allowing its competitors to see its intentions. Strategy is increasingly about making innovative moves and outwitting the competition, which is one of the reasons why this particular model receives less and less coverage in strategy teaching. A further problem with the model is that it implies that a balanced portfolio can be achieved only by having products in each of the four quadrants. The focus is upon divesting money from the cash cows to fund the stars because sooner or later the cash cow will become the dog. Similarly, trying to move a problem child into a star position by once again using surplus cash cow funds demonstrates a need to ensure that the company has a number of products moving around the portfolio, balancing it out continually. The reality for most organisations is that their cash cows are the most important products. All of the others play a supporting role. It would be risky for any company to divest funds from a cash cow when those funds are needed to extend its own life. It is important to recognise a dog, but it would be foolish either to create one simply to balance the portfolio or to shoot one when it’s actually making a positive contribution. Similarly, many organisations may panic if they don’t have a star product, but a healthy cash cow, together with a potential problem child, may well be sufficient. The BCG matrix is a useful way to analyse a product portfolio, but it is important to recognise its limitations and not to follow its principles too rigidly. Product portfolio management requires a more detailed understanding of the market, the competitive position of a product and its place in the portfolio. Although it’s a handy tool, BCG analysis should not be relied upon when you’re making strategic decisions. FM Steph Edwards Nutton is a former CIMA examiner and lead marker for P6 Management Accounting – Business Strategy. Paper p6 (also relevant to paper P5) P6 Recommended reading N Botten, Management Accounting – Business Strategy Study System (2006 edition), CIMA Publishing, 2005. R Kaplan and K Atkinson, Advanced Management Accounting (third edition), Prentice Hall, 1998. C Emmanuel and D Otley, Accounting for Management Control (second edition), Chapman & Hall, 1999. J Gohnson and K Scholes, Exploring Corporate Strategy (sixth edition), FT/Prentice Hall, 2002. R Lynch, Corporate Strategy (third edition), Pearson Education, 2003. financial 46 management December/January 2006/07 Photographs: iStockphoto