Static Analysis Primer
What It Is
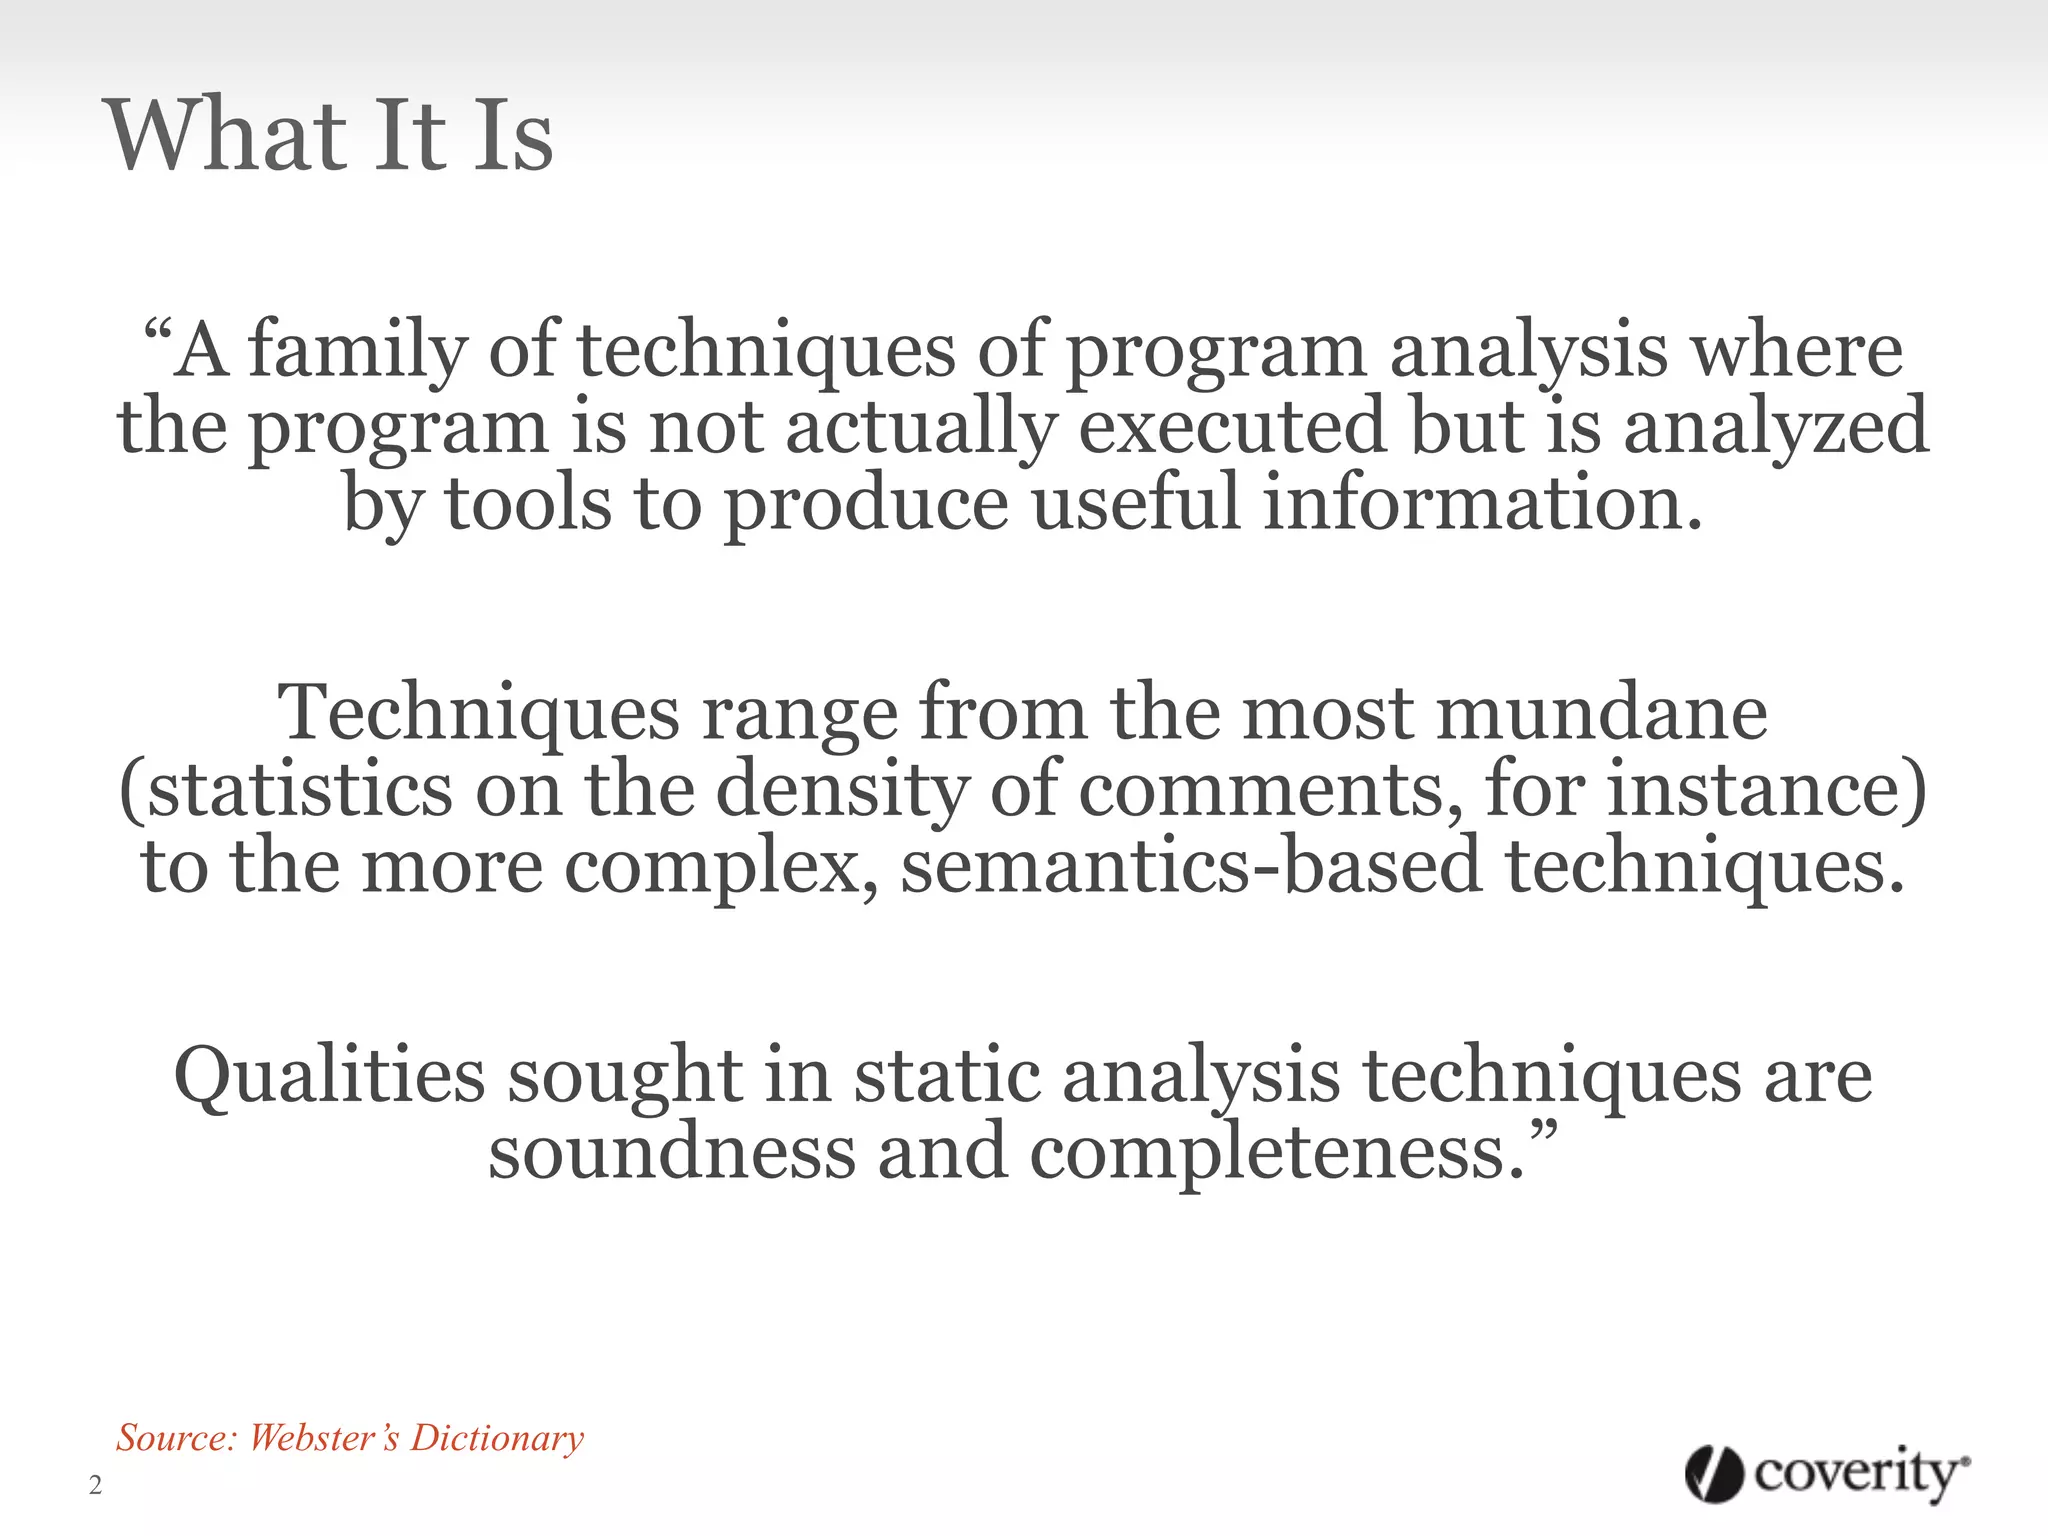
“A family of techniques of program analysis where
the program is not actually executed but is analyzed
by tools to produce useful information.
Techniques range from the most mundane
(statistics on the density of comments, for instance)
to the more complex, semantics-based techniques.
Qualities sought in static analysis techniques are
soundness and completeness.”
2
Source: Webster’s Dictionary
Why You Should Use It
1. It Saves Time and Money
Static Analysis: Why You Should Use It
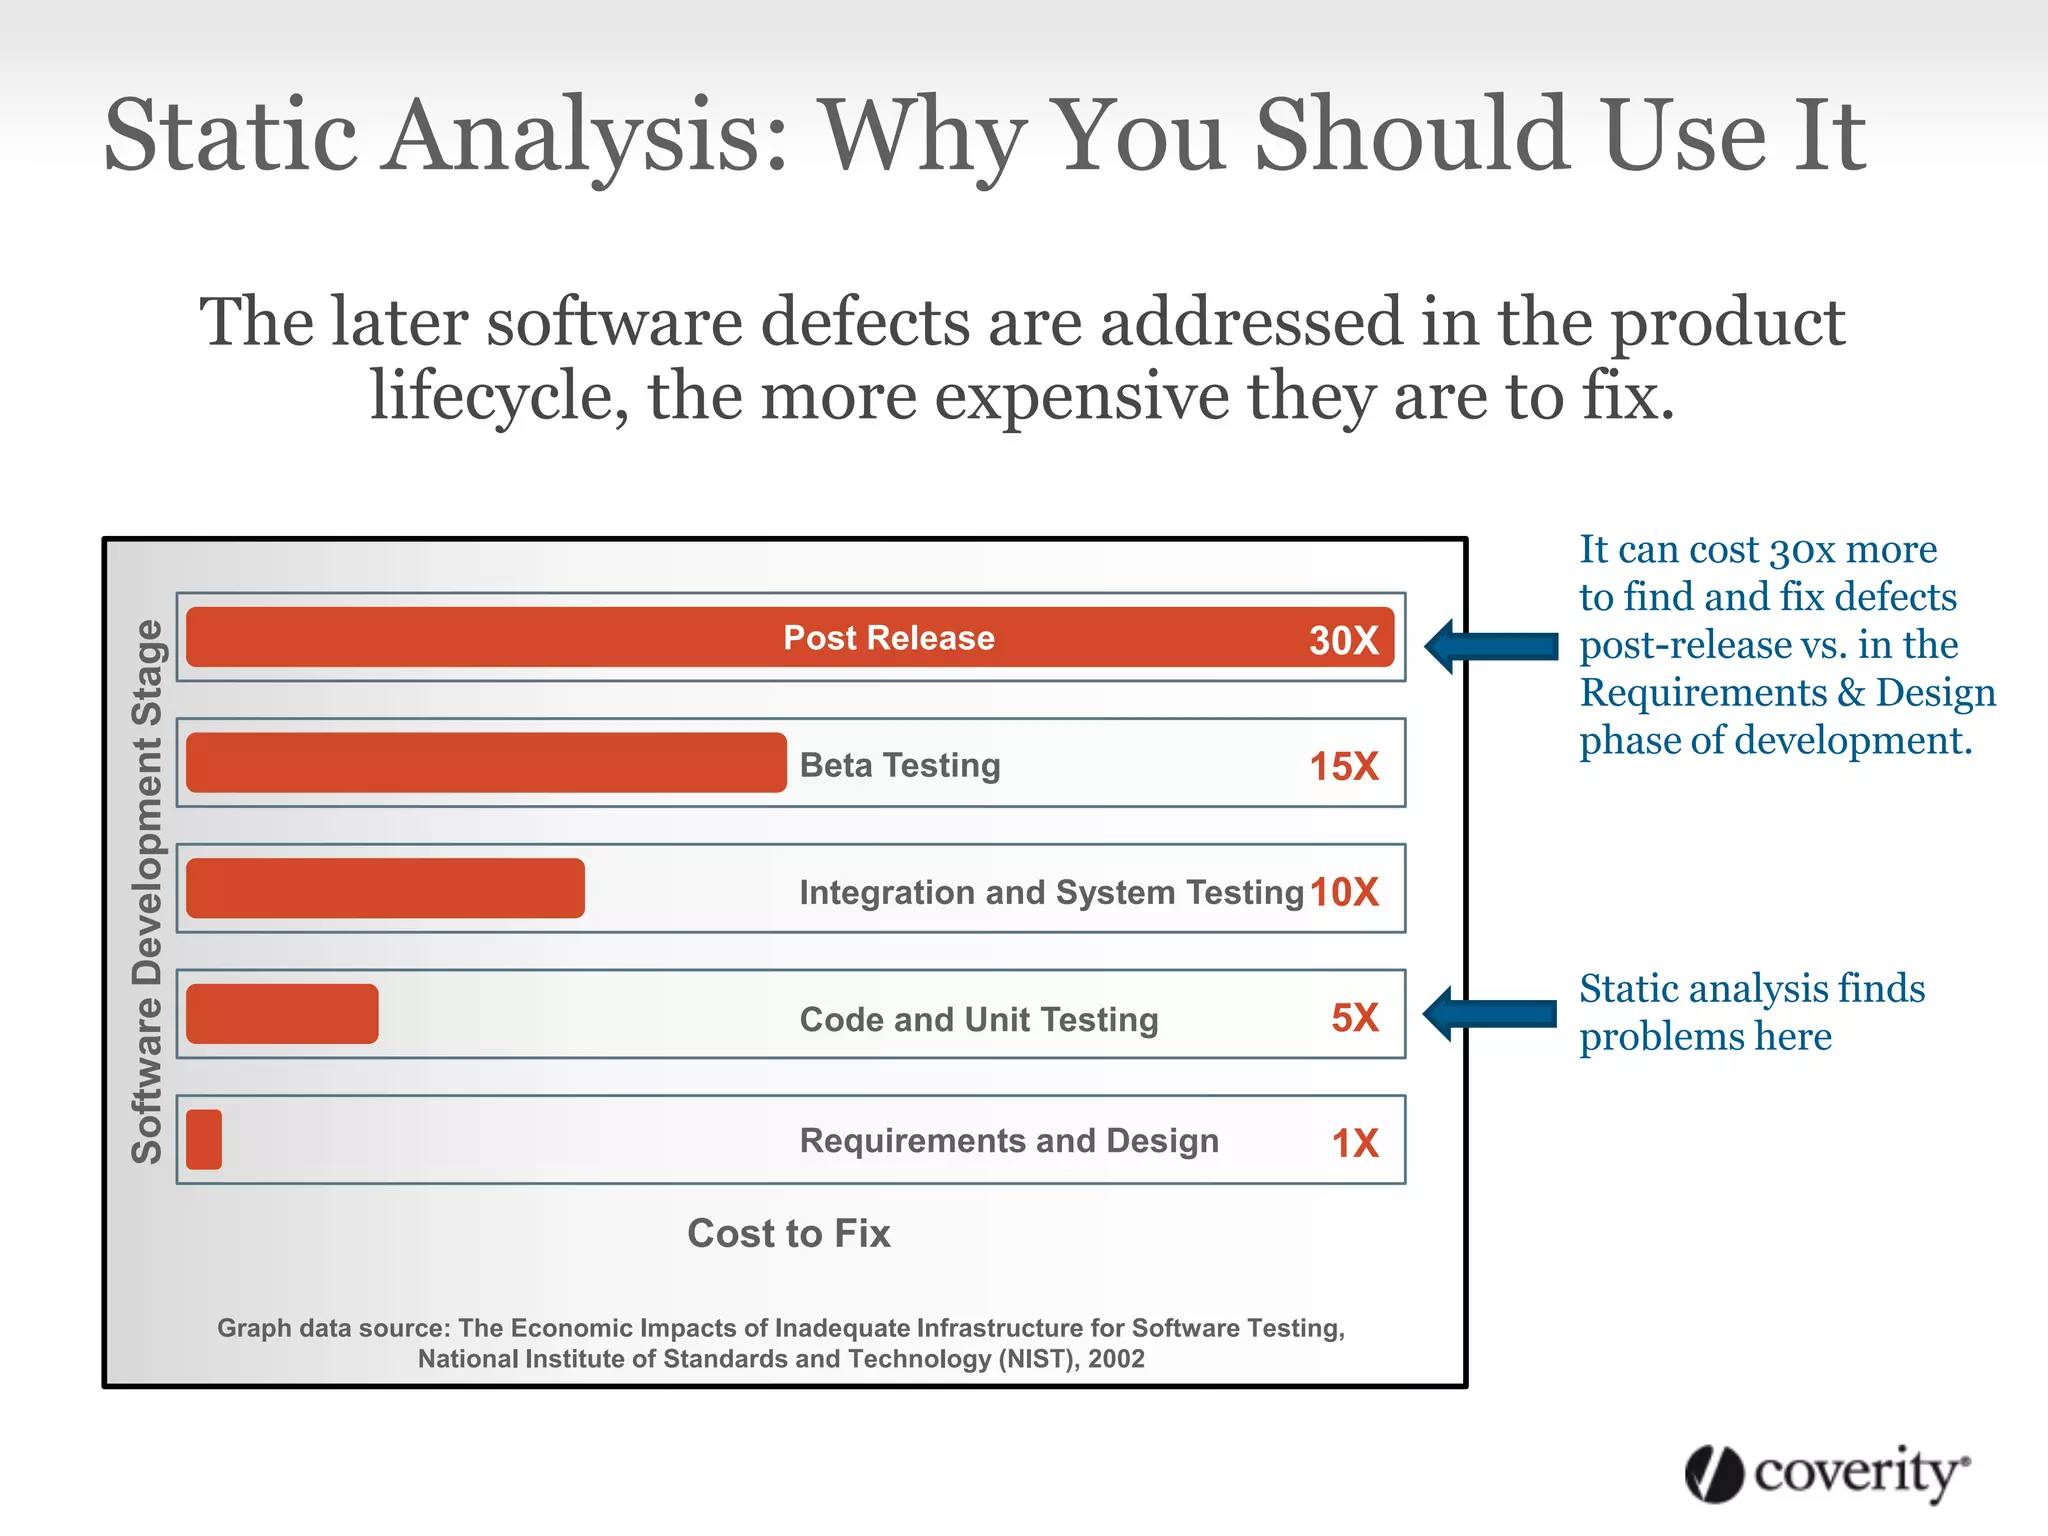
The later software defects are addressed in the product
lifecycle, the more expensive they are to fix.
SoftwareDevelopmentStage
Post Release
Beta Testing
Integration and System Testing
Code and Unit Testing
Requirements and Design
30X
15X
10X
5X
1X
Graph data source: The Economic Impacts of Inadequate Infrastructure for Software Testing,
National Institute of Standards and Technology (NIST), 2002
Cost to Fix
Static analysis finds
problems here
It can cost 30x more
to find and fix defects
post-release vs. in the
Requirements & Design
phase of development.
Why You Should Use It
2. It works while you sleep
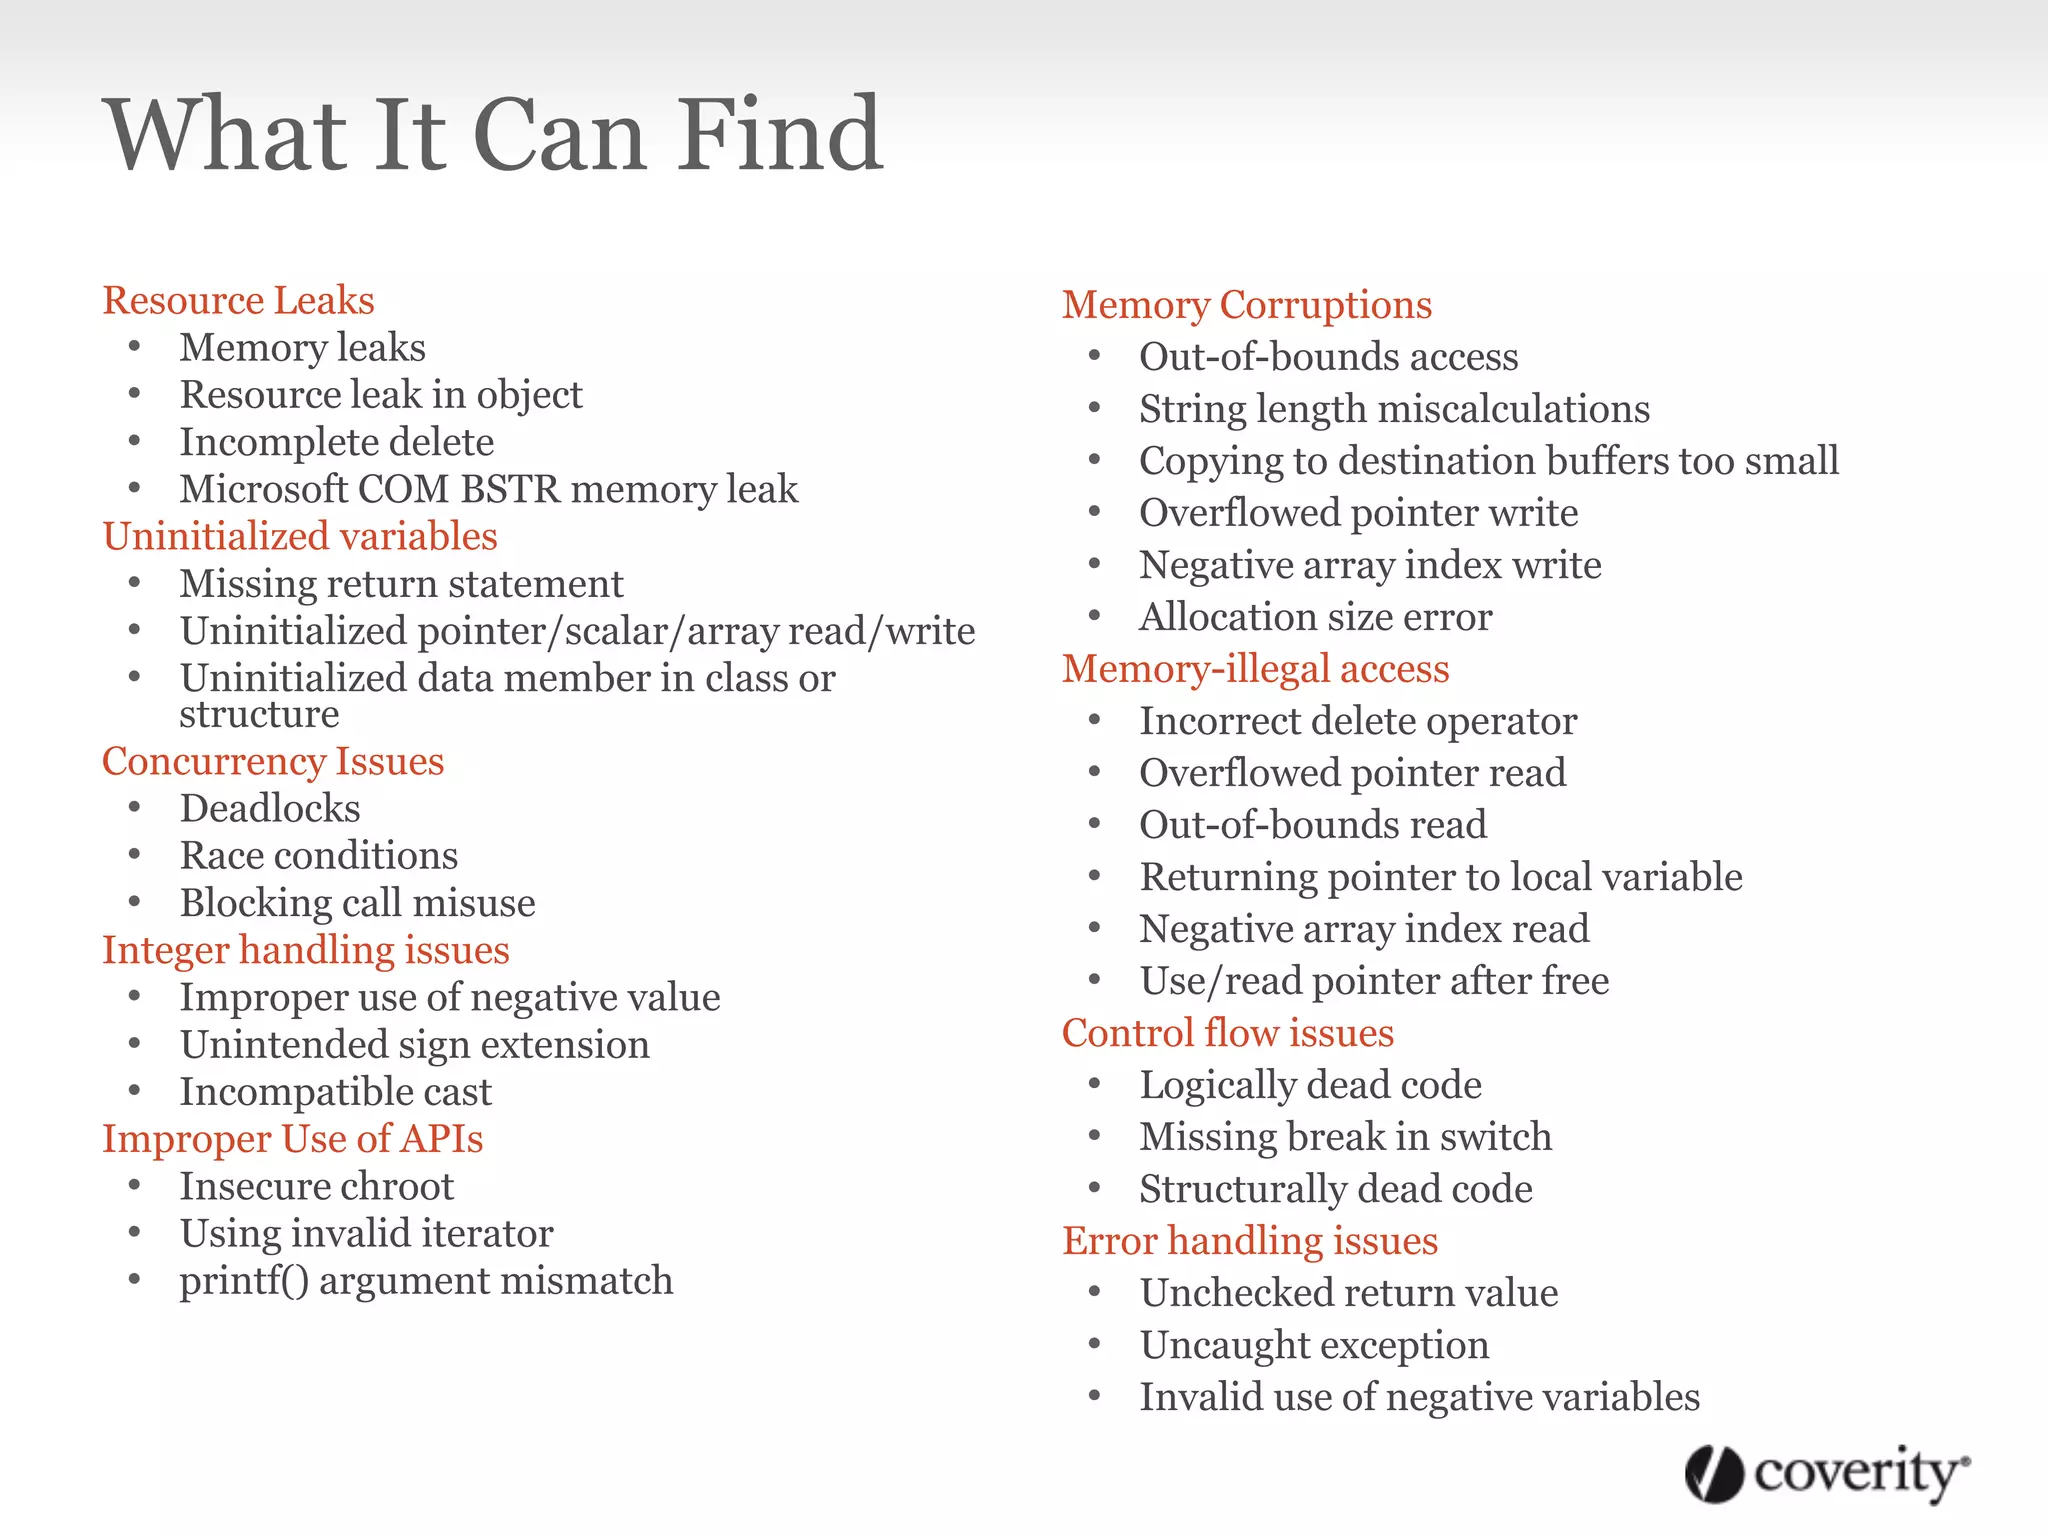
Resource Leaks
• Memory leaks
• Resource leak in object
• Incomplete delete
• Microsoft COM BSTR memory leak
Uninitialized variables
• Missing return statement
• Uninitialized pointer/scalar/array read/write
• Uninitialized data member in class or
structure
Concurrency Issues
• Deadlocks
• Race conditions
• Blocking call misuse
Integer handling issues
• Improper use of negative value
• Unintended sign extension
• Incompatible cast
Improper Use of APIs
• Insecure chroot
• Using invalid iterator
• printf() argument mismatch
Memory Corruptions
• Out-of-bounds access
• String length miscalculations
• Copying to destination buffers too small
• Overflowed pointer write
• Negative array index write
• Allocation size error
Memory-illegal access
• Incorrect delete operator
• Overflowed pointer read
• Out-of-bounds read
• Returning pointer to local variable
• Negative array index read
• Use/read pointer after free
Control flow issues
• Logically dead code
• Missing break in switch
• Structurally dead code
Error handling issues
• Unchecked return value
• Uncaught exception
• Invalid use of negative variables
What It Can Find
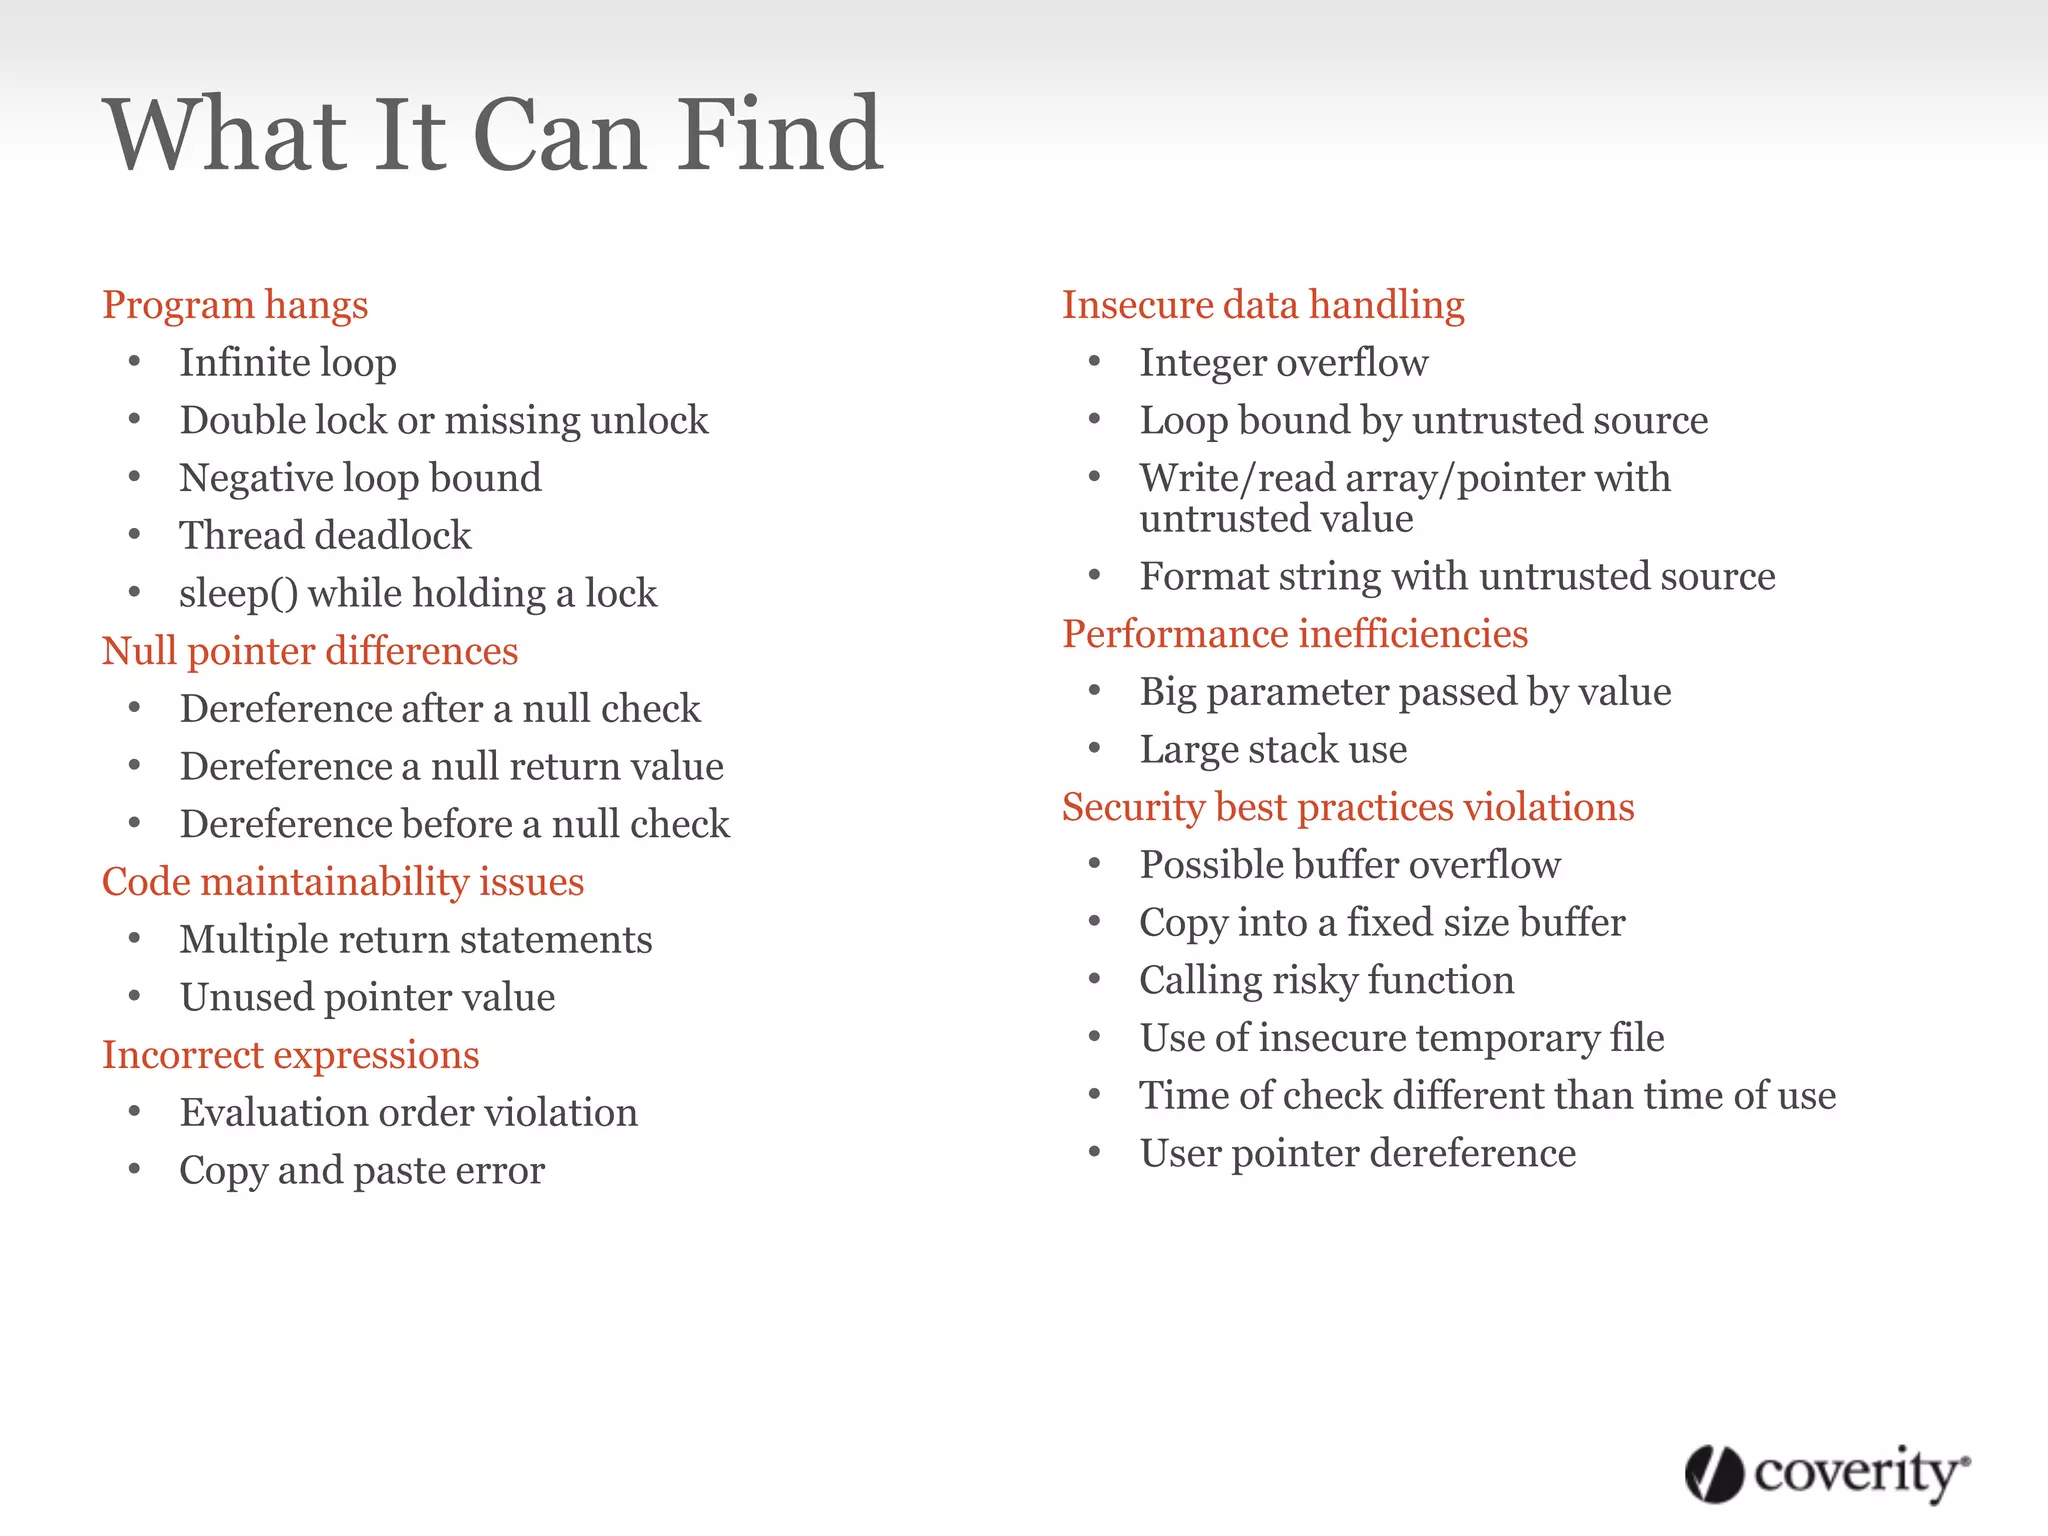
Program hangs
• Infinite loop
• Double lock or missing unlock
• Negative loop bound
• Thread deadlock
• sleep() while holding a lock
Null pointer differences
• Dereference after a null check
• Dereference a null return value
• Dereference before a null check
Code maintainability issues
• Multiple return statements
• Unused pointer value
Incorrect expressions
• Evaluation order violation
• Copy and paste error
Insecure data handling
• Integer overflow
• Loop bound by untrusted source
• Write/read array/pointer with
untrusted value
• Format string with untrusted source
Performance inefficiencies
• Big parameter passed by value
• Large stack use
Security best practices violations
• Possible buffer overflow
• Copy into a fixed size buffer
• Calling risky function
• Use of insecure temporary file
• Time of check different than time of use
• User pointer dereference
What It Can Find
How It Works
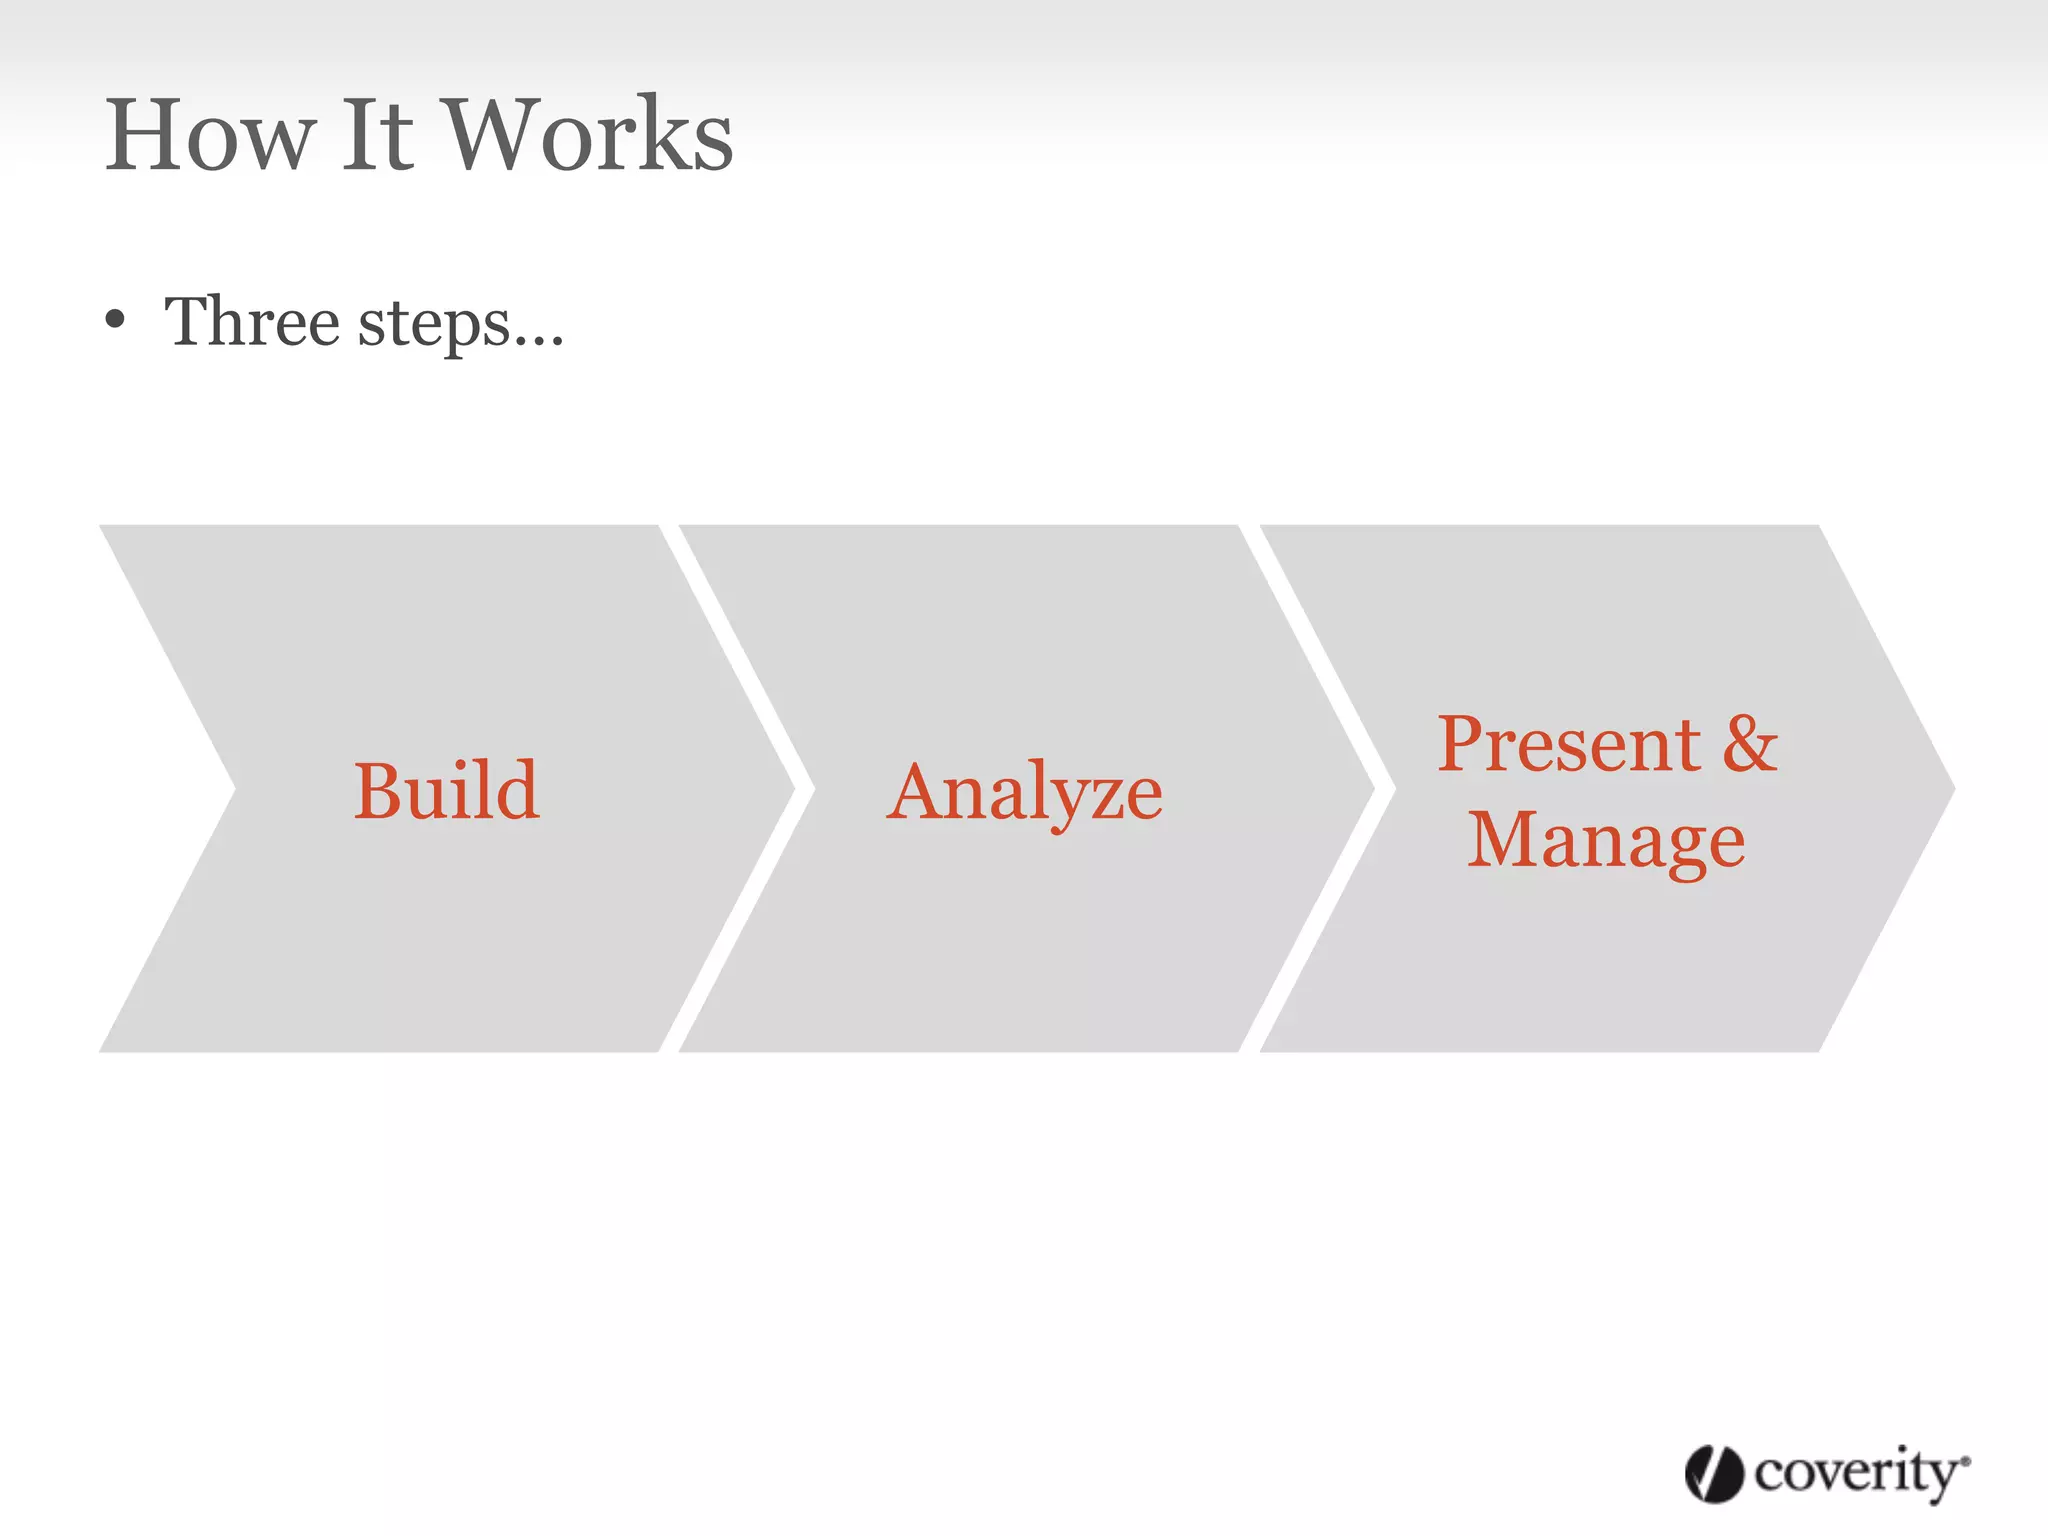
• Three steps…
AnalyzeBuild
Present &
Manage
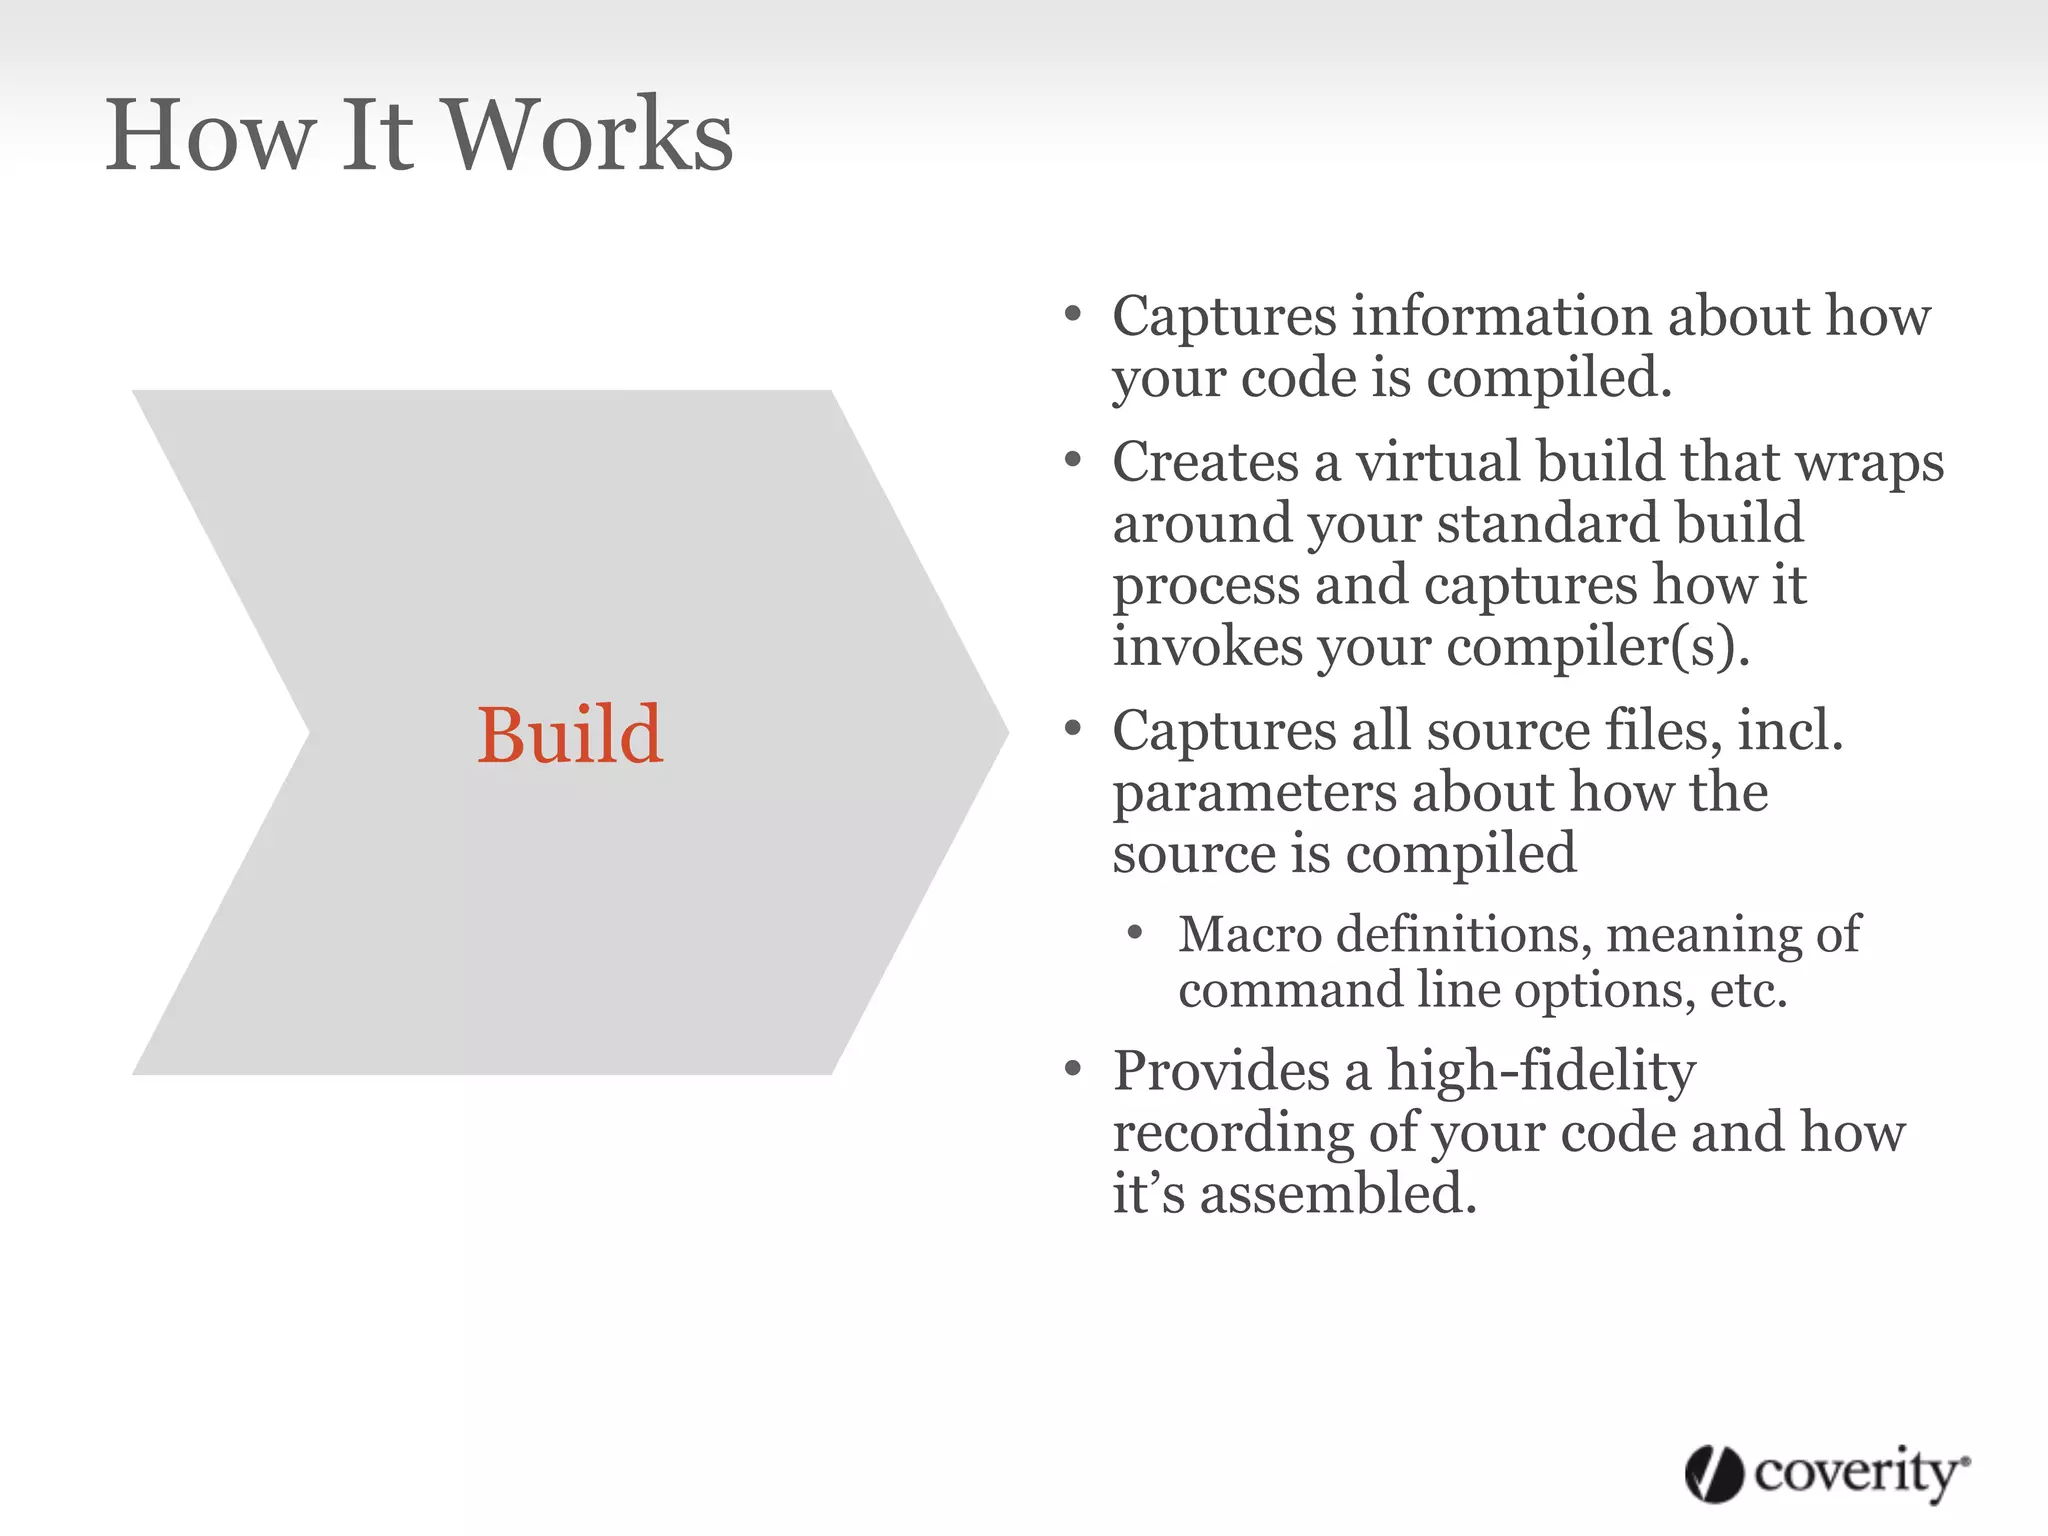
• Captures information about how
your code is compiled.
• Creates a virtual build that wraps
around your standard build
process and captures how it
invokes your compiler(s).
• Captures all source files, incl.
parameters about how the
source is compiled
• Macro definitions, meaning of
command line options, etc.
• Provides a high-fidelity
recording of your code and how
it’s assembled.
How It Works
Build
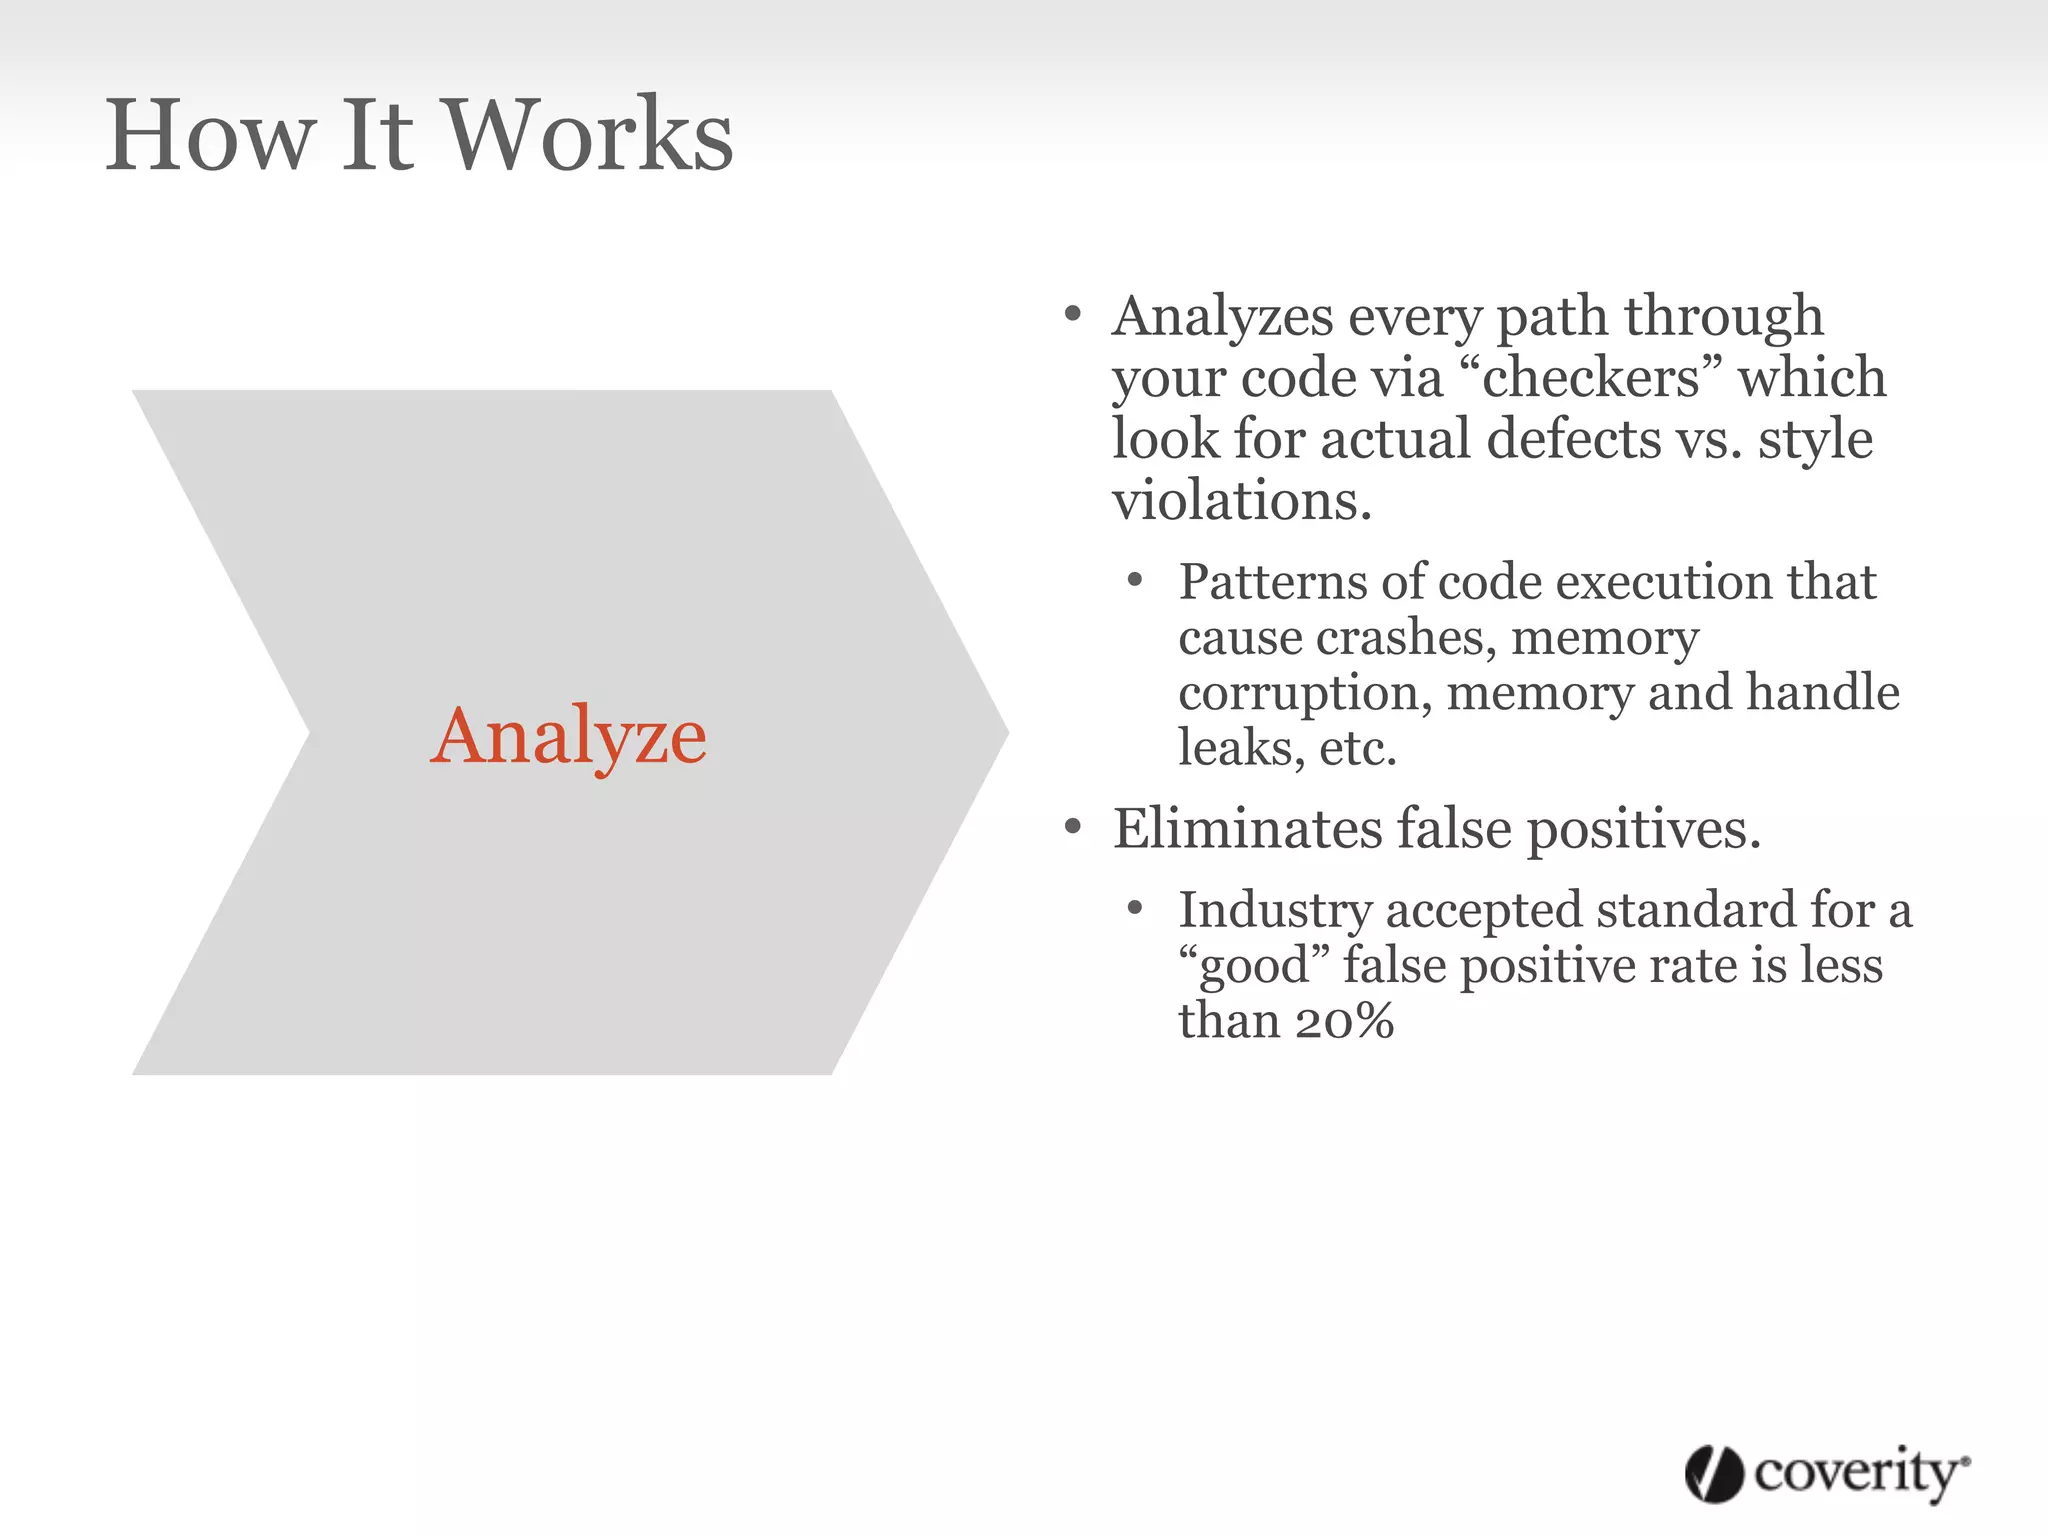
• Analyzes every path through
your code via “checkers” which
look for actual defects vs. style
violations.
• Patterns of code execution that
cause crashes, memory
corruption, memory and handle
leaks, etc.
• Eliminates false positives.
• Industry accepted standard for a
“good” false positive rate is less
than 20%
How It Works
Analyze
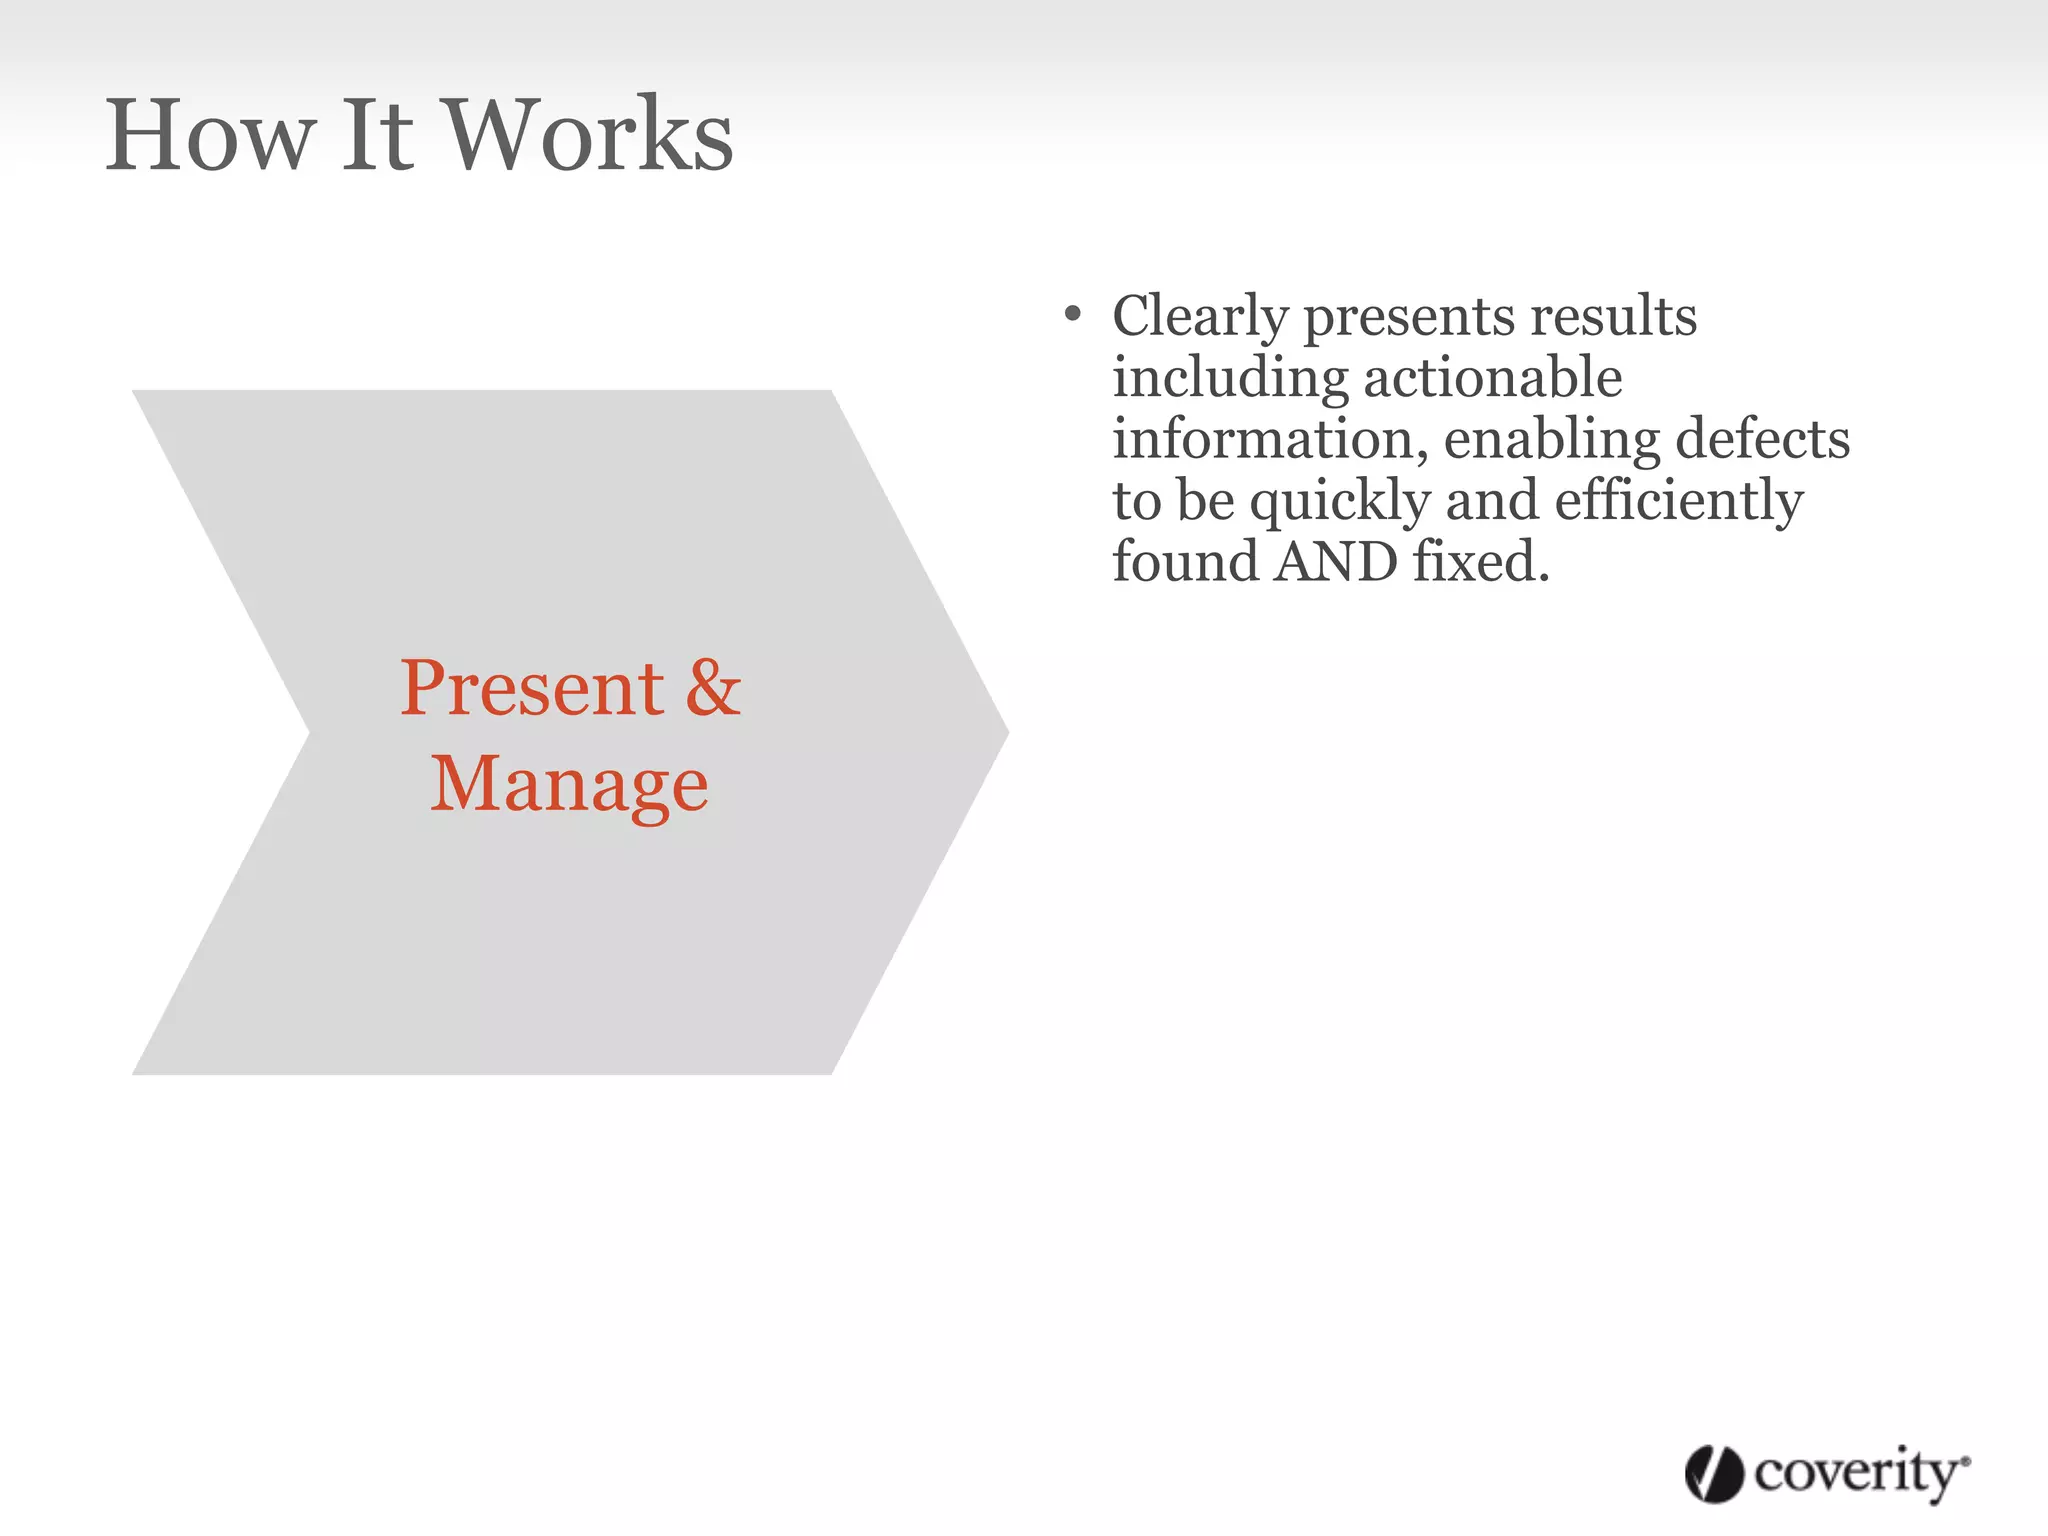
• Clearly presents results
including actionable
information, enabling defects
to be quickly and efficiently
found AND fixed.
How It Works
Present &
Manage
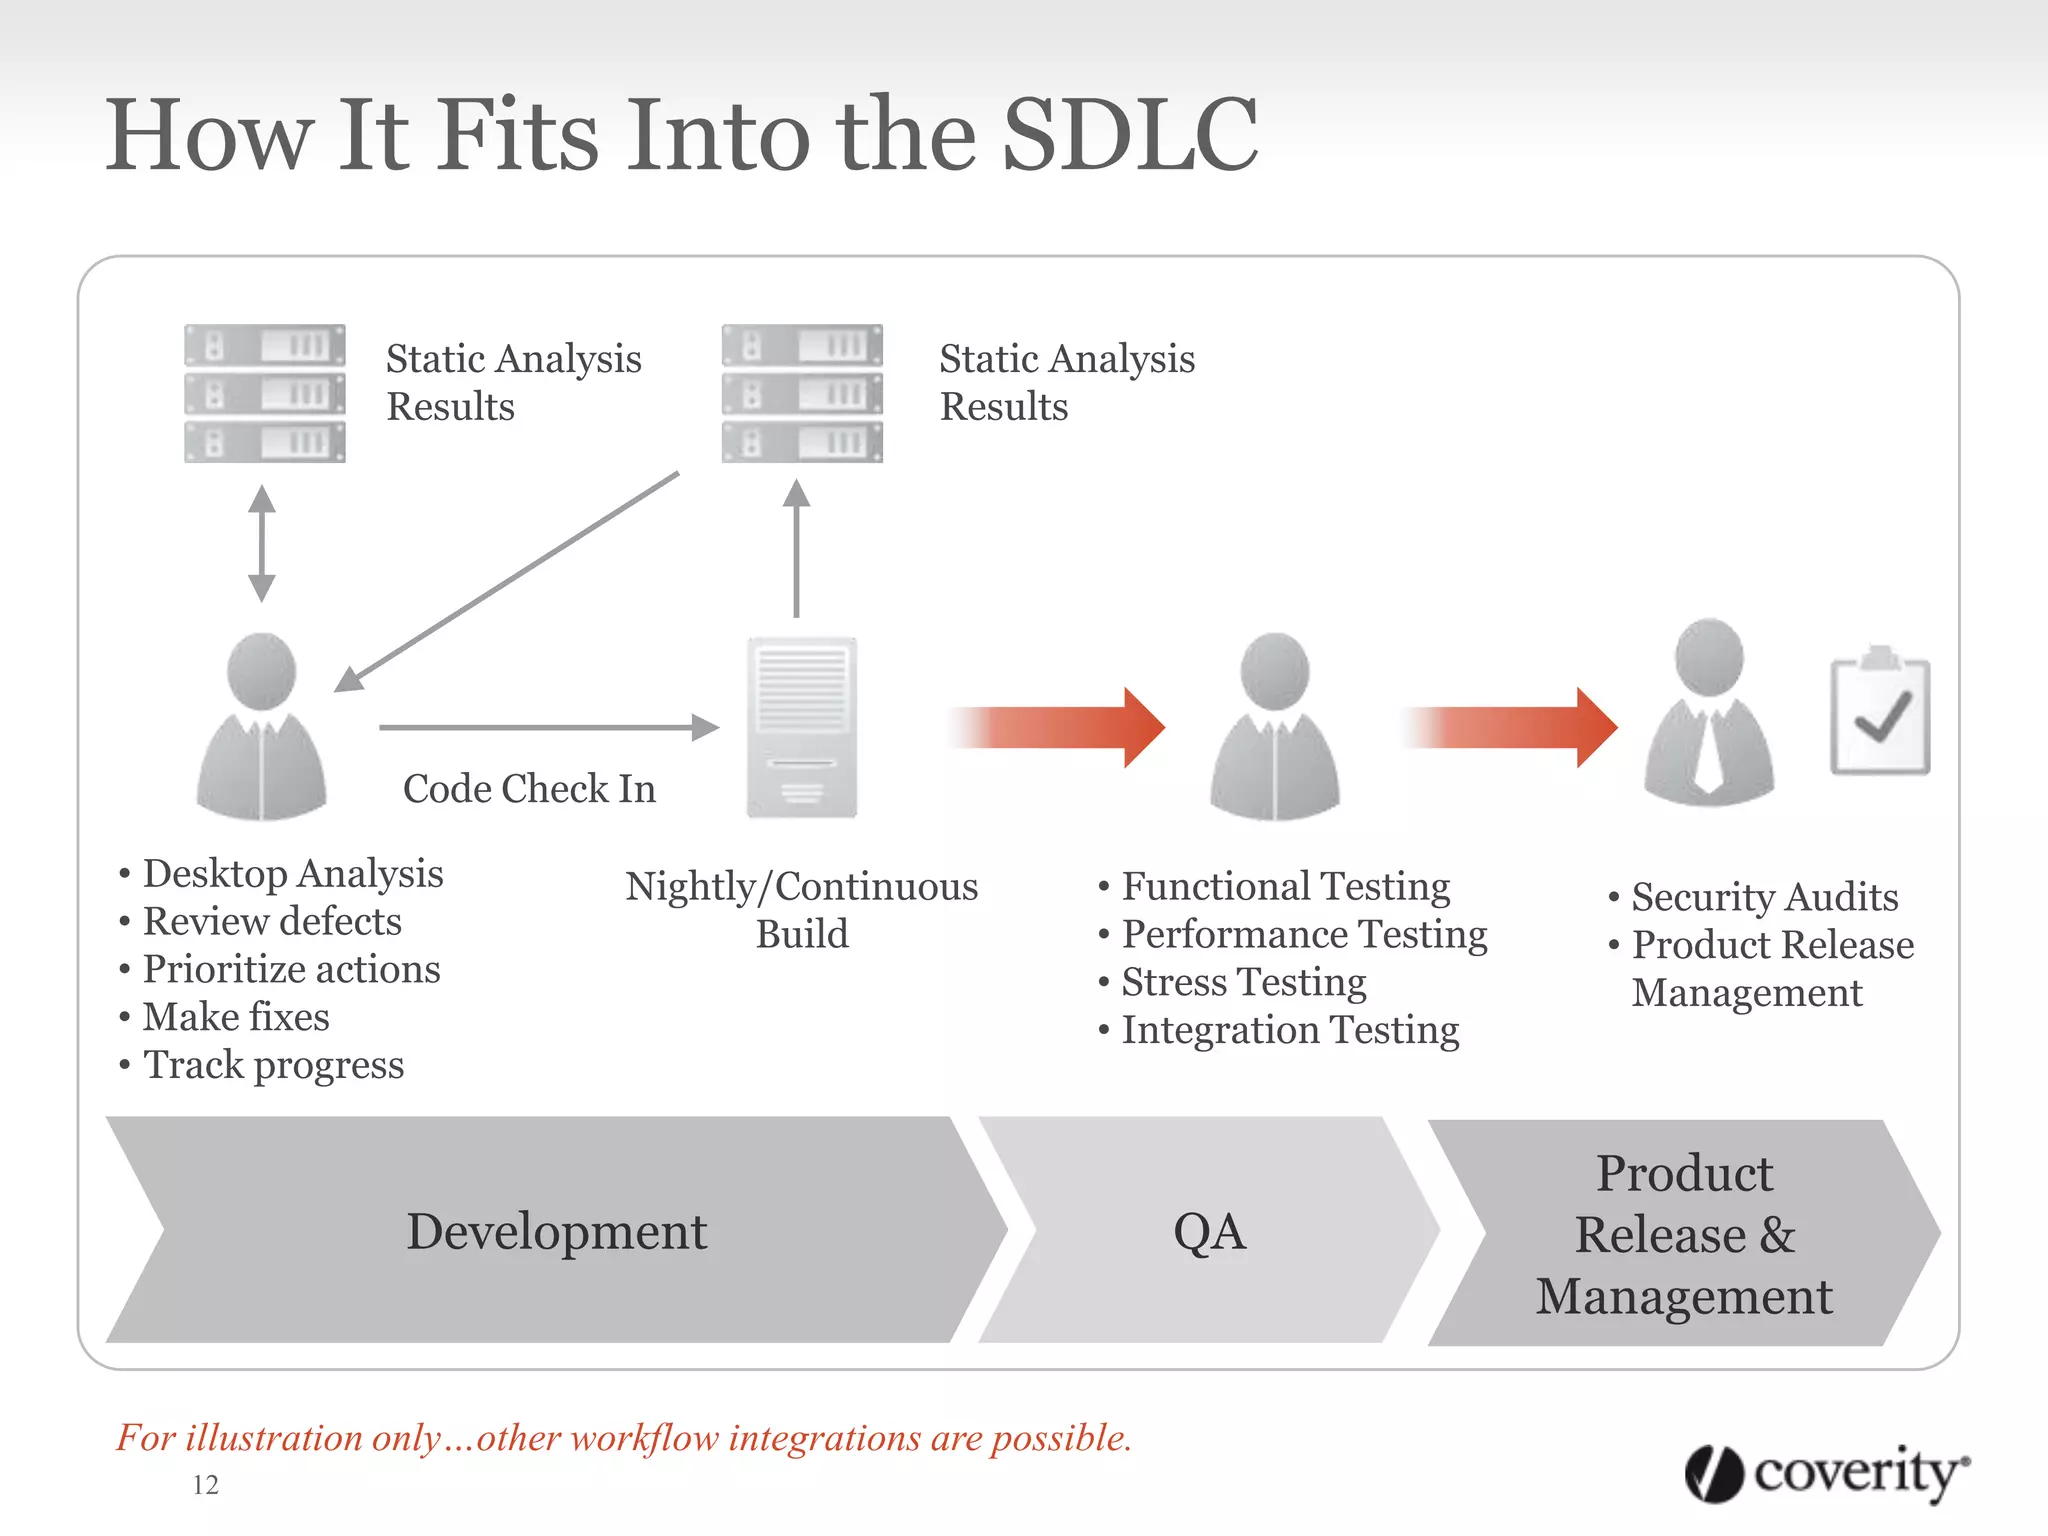
How It Fits Into the SDLC
12
• Security Audits
• Product Release
Management
QA
Nightly/Continuous
Build
• Desktop Analysis
• Review defects
• Prioritize actions
• Make fixes
• Track progress
Code Check In
Static Analysis
Results
• Functional Testing
• Performance Testing
• Stress Testing
• Integration Testing
Development
Product
Release &
Management
Static Analysis
Results
For illustration only…other workflow integrations are possible.
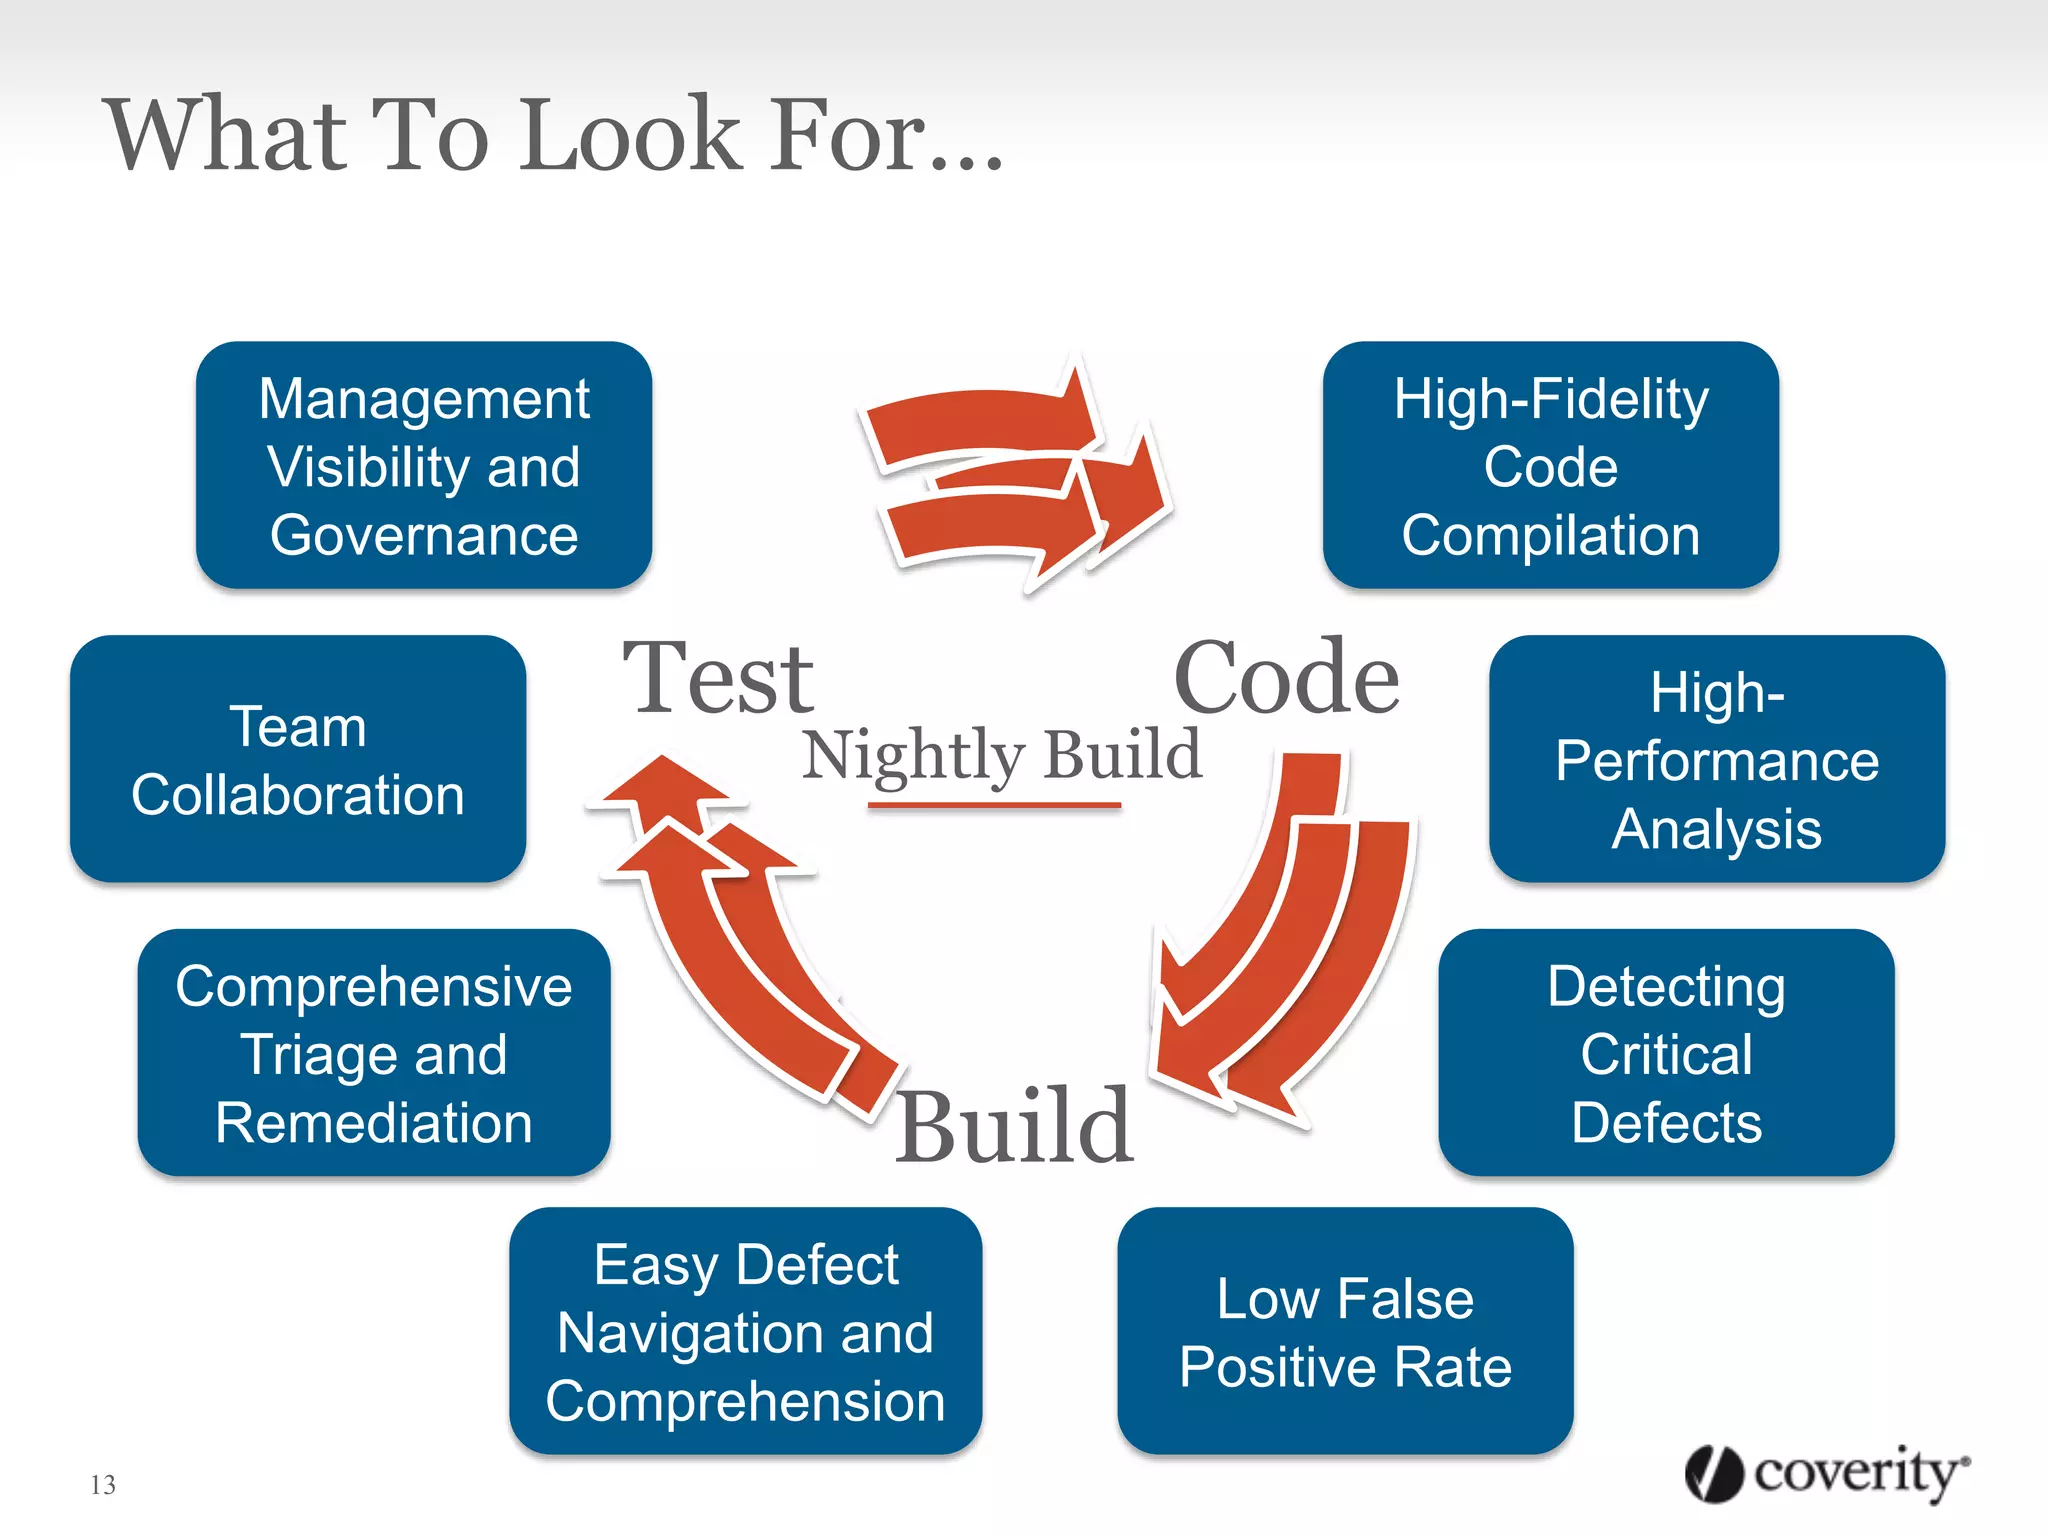
13
Code
Build
Test
Nightly Build
Continuous
Integration
High-Fidelity
Code
Compilation
High-
Performance
Analysis
Low False
Positive Rate
Detecting
Critical
Defects
Easy Defect
Navigation and
Comprehension
Comprehensive
Triage and
Remediation
Management
Visibility and
Governance
Team
Collaboration
What To Look For…
Copyright 2013 Coverity, Inc.

Static Analysis Primer

  • 1.
  • 2.
    What It Is “Afamily of techniques of program analysis where the program is not actually executed but is analyzed by tools to produce useful information. Techniques range from the most mundane (statistics on the density of comments, for instance) to the more complex, semantics-based techniques. Qualities sought in static analysis techniques are soundness and completeness.” 2 Source: Webster’s Dictionary
  • 3.
    Why You ShouldUse It 1. It Saves Time and Money
  • 4.
    Static Analysis: WhyYou Should Use It The later software defects are addressed in the product lifecycle, the more expensive they are to fix. SoftwareDevelopmentStage Post Release Beta Testing Integration and System Testing Code and Unit Testing Requirements and Design 30X 15X 10X 5X 1X Graph data source: The Economic Impacts of Inadequate Infrastructure for Software Testing, National Institute of Standards and Technology (NIST), 2002 Cost to Fix Static analysis finds problems here It can cost 30x more to find and fix defects post-release vs. in the Requirements & Design phase of development.
  • 5.
    Why You ShouldUse It 2. It works while you sleep
  • 6.
    Resource Leaks • Memoryleaks • Resource leak in object • Incomplete delete • Microsoft COM BSTR memory leak Uninitialized variables • Missing return statement • Uninitialized pointer/scalar/array read/write • Uninitialized data member in class or structure Concurrency Issues • Deadlocks • Race conditions • Blocking call misuse Integer handling issues • Improper use of negative value • Unintended sign extension • Incompatible cast Improper Use of APIs • Insecure chroot • Using invalid iterator • printf() argument mismatch Memory Corruptions • Out-of-bounds access • String length miscalculations • Copying to destination buffers too small • Overflowed pointer write • Negative array index write • Allocation size error Memory-illegal access • Incorrect delete operator • Overflowed pointer read • Out-of-bounds read • Returning pointer to local variable • Negative array index read • Use/read pointer after free Control flow issues • Logically dead code • Missing break in switch • Structurally dead code Error handling issues • Unchecked return value • Uncaught exception • Invalid use of negative variables What It Can Find
  • 7.
    Program hangs • Infiniteloop • Double lock or missing unlock • Negative loop bound • Thread deadlock • sleep() while holding a lock Null pointer differences • Dereference after a null check • Dereference a null return value • Dereference before a null check Code maintainability issues • Multiple return statements • Unused pointer value Incorrect expressions • Evaluation order violation • Copy and paste error Insecure data handling • Integer overflow • Loop bound by untrusted source • Write/read array/pointer with untrusted value • Format string with untrusted source Performance inefficiencies • Big parameter passed by value • Large stack use Security best practices violations • Possible buffer overflow • Copy into a fixed size buffer • Calling risky function • Use of insecure temporary file • Time of check different than time of use • User pointer dereference What It Can Find
  • 8.
    How It Works •Three steps… AnalyzeBuild Present & Manage
  • 9.
    • Captures informationabout how your code is compiled. • Creates a virtual build that wraps around your standard build process and captures how it invokes your compiler(s). • Captures all source files, incl. parameters about how the source is compiled • Macro definitions, meaning of command line options, etc. • Provides a high-fidelity recording of your code and how it’s assembled. How It Works Build
  • 10.
    • Analyzes everypath through your code via “checkers” which look for actual defects vs. style violations. • Patterns of code execution that cause crashes, memory corruption, memory and handle leaks, etc. • Eliminates false positives. • Industry accepted standard for a “good” false positive rate is less than 20% How It Works Analyze
  • 11.
    • Clearly presentsresults including actionable information, enabling defects to be quickly and efficiently found AND fixed. How It Works Present & Manage
  • 12.
    How It FitsInto the SDLC 12 • Security Audits • Product Release Management QA Nightly/Continuous Build • Desktop Analysis • Review defects • Prioritize actions • Make fixes • Track progress Code Check In Static Analysis Results • Functional Testing • Performance Testing • Stress Testing • Integration Testing Development Product Release & Management Static Analysis Results For illustration only…other workflow integrations are possible.
  • 13.
    13 Code Build Test Nightly Build Continuous Integration High-Fidelity Code Compilation High- Performance Analysis Low False PositiveRate Detecting Critical Defects Easy Defect Navigation and Comprehension Comprehensive Triage and Remediation Management Visibility and Governance Team Collaboration What To Look For…
  • 14.

Editor's Notes

  • #3 Given the diversity of approaches and goals for static analysis tools, I wanted to better understand how static analysis tools differ.
  • #9 There are three parts:the Build step captures information about how your code is compiled. We create a virtual build that wraps around your standard build process and transparently captures how it invokes your compiler(s). From this we capture all of the source files as well as the parameters describing how the source is compiled, including things like macro definitions and the meaning of command line options. This results in a high fidelity recording of your code and the way it’s assembled.The analysis is where we analyze every path through your code with a battery of tests, organized by what we call “checkers”. These checkers look for actual defects, not just coding style violations. These are patterns of code execution that can cause crashes, memory corruption, memory and handle leaks, and other kinds problems that are hard errors, not just stylistic rules. Throughout our analysis we have taken great care to try to eliminate false positives, which are error reports that are not true defects. Our false positive rate is the lowest in the industry, typically less than 20% out of the box. This is important because developers will not adopt tools that are mostly a waste of their time.Finally it’s important to present the results clearly because it’s not only about finding defects, it’s about fixing them. The results are stored in a database and presented to give actionable information so developers can fix them efficiently.We’ll focus this talk on the Analysis and Presentation. For more about the Build, click on the Build icon, otherwise we will skip this.
  • #10 The analysis is where we analyze every path through your code with a battery of tests, organized by what we call “checkers”. These checkers look for actual defects, not just coding style violations. These are patterns of code execution that can cause crashes, memory corruption, memory and handle leaks, and other kinds problems that are hard errors, not just stylistic rules. Throughout our analysis we have taken great care to try to eliminate false positives, which are error reports that are not true defects. Our false positive rate is the lowest in the industry, typically less than 20% out of the box. This is important because developers will not adopt tools that are mostly a waste of their time.Finally it’s important to present the results clearly because it’s not only about finding defects, it’s about fixing them. The results are stored in a database and presented to give actionable information so developers can fix them efficiently.We’ll focus this talk on the Analysis and Presentation. For more about the Build, click on the Build icon, otherwise we will skip this.