1. AN ABSTRACT OF THE DISSERTATION OF
Martin Precek for the degree of Doctor of Philosophy in Chemistry presented on
August 29, 2012.
Title: The Kinetic and Radiolytic Aspects of Control of the Redox Speciation of
Neptunium in Solutions of Nitric Acid
Abstract approved: ________________________________________________
Alena Paulenova
Neptunium, with its rich redox chemistry, has a special position in the chemistry of
actinides. With a decades-long history of development of aqueous separation methods for
used nuclear fuel (UNF), management of neptunium remains an unresolved issue because
of its not clearly defined redox speciation. Neptunium is present in two, pentavalent (V)
and hexavalent (VI) oxidation states, both in their dioxocation O=Np=O neptunyl form,
which differ greatly in their solvent extraction behavior. While the neptunium(VI)
dioxocation is being very well extracted, the dioxocation of pentavalent neptunium is
practically non-extractable by an organic solvent. As a result, neptunium is not well
separated and remains distributed in both organic and aqueous extraction phases. The aim
of this study was to develop or enhance the understanding of several key topics governing
the redox behavior of neptunium in nitric acid medium, which are of vital importance for
the engineering design of industrial-scale liquid-liquid separation systems.
In this work, reactions of neptunium(V) and (VI) with vanadium(V) and
acetohydroxamic acid - two redox agents envisioned for adjusting the neptunium
oxidation state in aqueous separations – were studied in order to determine their kinetic
characteristics, rate laws and rate constants, as a function of temperature and nitric acid
concentration. Further were analyzed the interactions of neptunium(V) and (VI) with
nitrous acid, which is formed as a product of radiolytic degradation of nitric acid caused
by high levels of radioactivity present in such systems. Once HNO3 is distributed
2. between both the aqueous solutions and organic solvent, nitrous acid is also formed in
both phases and has a key influence on redox speciation of neptunium; therefore, the
effects of gamma-radiation on the redox speciation of neptunium were investigated. The
work also includes the results of examination of scavenging of nitrous acid by hydrogen
peroxide, which is generated along with nitrous acid during radiolysis of aqueous
solutions of nitric acid, and also by chemical reactions with added scavenging agents
(methylurea, acetohydroxamic acid).
4. The Kinetic and Radiolytic Aspects of Control of the Redox Speciation of Neptunium
in Solutions of Nitric Acid
by
Martin Precek
A DISSERTATION
submitted to
Oregon State University
in partial fulfillment of
the requirements for the
degree of
Doctor of Philosophy
Presented August 29, 2012
Commencement June 2013
5. Doctor of Philosophy dissertation of Martin Precek presented on August 29, 2012.
APPROVED:
Major Professor, representing Chemistry
Chair of the Department of Chemistry
Dean of the Graduate School
I understand that my dissertation will become part of the permanent collection of Oregon
State University libraries. My signature below authorizes release of my dissertation to
any reader upon request.
Martin Precek, Author
6. ACKNOWLEDGEMENTS
Firstly, I would like to express my deep appreciation to Dr. Alena Paulenova, who has
more than fulfilled her duties of an academic advisor, who has never failed in arranging
for my financial support, and who has always made herself available to provide academic
and personal guidance through my doctoral studies.
I would also like to extend my appreciation to the past and present members of my
doctoral committee at OSU: Dr. James D. Ingle, Dr. Walter D. Loveland, Dr. Philip R.
Watson, Dr. Manish Gupta, Dr. Taifo Mahmud, and Dr. Abi T. Farsoni, who have found
time in their busy schedules to supervise the progression of my degree.
My additional thanks are directed at my collaborators and co-advisors Dr. Bruce J.
Mincher from the Idaho National Laboratory and Dr. Stephen Mezyk from the California
State University, Long Beach, for creating a wonderful and exciting atmosphere of
cooperation and for treating me as their equal.
I have been very lucky in getting to work in the wonderful collective of Dr. Paulenova’s
research group. I would like to especially acknowledge the support I had from the
following colleagues: Dr. Peter Tkac (the group “postdoc”), graduate students M. Alex
Brown, Vanessa E. Holfeltz, Joseph L. Lapka, and Brent S. Matteson, and also from
undergraduate researchers Kyle C. Hartig, Nathan Knapp, and Corey R. Wright.
My work would not be possible without the support work of the personnel of the OSU
Radiation Center, especially Scott A. Menn who facilitated my use of the Co-60
irradiator and provided necessary radiation protection oversight over my work.
I also address many thanks to the community of people of the town of Corvallis, Oregon,
especially to the international students of the European Student Association of OSU, to
Stephen Howell for the I.H.O.P., to Penelope Wollf and the Pro Musica Corvallis String
Orchestra, and to the Rebhuhn family, all of whom have allowed me to develop a very
fulfilling social life in what was initially a strange and foreign country to me.
Last, but not least, I need to express my thanks to the members of my family, especially
to my mother Katalin, father Zdeněk and sister Tamara, who have remotely supported me
during all the years while I left Europe in pursuit of my doctoral studies.
The Author
7. CONTRIBUTION OF AUTHORS
Dr. Peter Tkac and Nathan Knapp have undertaken the preliminary work on the effects of
nitric acid radiolysis, production of nitrous acid and effectiveness of small doses of
methylurea in scavenging nitrous acid.
Dr. Brent S Matteson has performed the initial kinetic experiments of Np(VI) reduction
by acetohydroxamic acid in nitric acid environment.
Dr. Bruce J Mincher – has provided for use the scientific equipment and the irradiator at
Idaho National Laboratory, and performed the irradiation of aqueous and organic nitric
acid solutions – and, together with Dr. Stephen Mezyk, has helped with the interpretation
of the data on kinetics of the reaction of H2O2 with HNO2.
8. TABLE OF CONTENTS
Page
1 Introduction ............................................................................................................................... 1
1.1 General Background ................................................................................................. 1
1.2 Motivation................................................................................................................. 1
1.3 Expected Outcomes................................................................................................... 2
1.4 Overview of the Dissertation .................................................................................... 3
2 Review of Literature.................................................................................................................. 5
2.1 Importance of Neptunium ......................................................................................... 5
2.1.1 Discovery ........................................................................................................ 5
2.1.2 Neptunium in the nuclear fuel cycle................................................................ 6
2.1.3 Long-term Radiotoxicity of Neptunium in SNF ............................................. 7
2.1.4 Non-proliferation issues .................................................................................. 8
2.1.5 Potential Uses of Neptunium........................................................................... 9
2.2 General chemical properties of neptunium among the actinide elements............... 11
2.3 Neptunium in Reprocessing of Used Nuclear Fuel................................................. 20
2.3.1 PUREX Process............................................................................................. 20
2.3.2 Advanced PUREX processes ........................................................................ 24
2.4 Control of the oxidation state of neptunium by redox reagents .............................. 27
2.4.1 Neptunium disproportionation and reaction with HNO3............................... 27
2.4.2 Uranium(IV).................................................................................................. 33
2.4.3 Iron(II)........................................................................................................... 34
2.4.4 Plutonium(III)................................................................................................ 35
2.4.5 Hydrazine ...................................................................................................... 36
2.4.6 Hydrogen peroxide........................................................................................ 38
2.4.7 Hydroxylamine.............................................................................................. 40
2.4.8 New prospective reducing agents.................................................................. 43
2.4.9 Vanadium(V) as a prospective oxidizing agent............................................. 50
2.5 Radiation chemistry of neptunium in nitric acid..................................................... 54
2.5.1 Radiolysis of water........................................................................................ 54
2.5.2 The radiation chemistry of actinides in nitric acid solutions......................... 56
3 Materials and Methods ............................................................................................................ 58
3.1 Materials.................................................................................................................. 58
3.1.1 Neptunium..................................................................................................... 58
3.1.2 Solutions and their preparation...................................................................... 60
3.1.3 Volumetric titration....................................................................................... 60
3.1.4 Nitric acid...................................................................................................... 61
3.1.5 Management of the instability of nitrous acid............................................... 62
3.2 Methods and Techniques ........................................................................................ 62
9. TABLE OF CONTENTS (Continued)
Page
3.2.1 Electrochemistry............................................................................................ 62
3.2.2 Spectrophotometry ........................................................................................ 68
3.2.3 Experimental techniques for analysis of reaction kinetics ............................ 77
3.2.4 Irradiation apparatus for radiolytic studies.................................................... 82
4 Kinetics of Oxidation of Pentavalent Neptunium by Pentavalent Vanadium in Solutions
of Nitric Acid .......................................................................................................................... 83
4.1 Abstract................................................................................................................... 84
4.2 Introduction............................................................................................................. 84
4.3 Experimental........................................................................................................... 86
4.3.1 Reagents ........................................................................................................ 86
4.3.2 Measurement ................................................................................................. 86
4.4 Results and discussion ............................................................................................ 87
4.4.1 Analysis of kinetic data................................................................................. 87
4.4.2 Effect of concentration of Np(V) and V(V) .................................................. 89
4.4.3 Effect of hydrogen ion concentration............................................................ 89
4.4.4 Effect of temperature on the rate of oxidation of Np(V) by V(V) ................ 92
4.5 Conclusion .............................................................................................................. 93
5 Kinetics of reduction of hexavalent neptunium by nitrous acid in solutions of nitric acid ..... 94
5.1 Abstract................................................................................................................... 95
5.2 Introduction............................................................................................................. 95
5.3 Experimental........................................................................................................... 97
5.3.1 Chemicals...................................................................................................... 97
5.3.2 Neptunium..................................................................................................... 97
5.3.3 Instrumentation.............................................................................................. 98
5.3.4 Observation of the kinetic progress............................................................... 99
5.3.5 Nitrous acid instability .................................................................................. 99
5.3.6 Data analysis ............................................................................................... 100
5.4 Results and discussion .......................................................................................... 100
5.4.1 Determination of reaction orders with respect to Np(VI) and HNO2.......... 100
5.4.2 Effect of H+
concentration and ionic strength ............................................. 101
5.4.3 Discussion on the form of the rate law........................................................ 102
5.4.4 Effect of temperature................................................................................... 104
5.5 Conclusion ............................................................................................................ 106
6 Kinetics of reduction of hexavalent neptunium by acetohydroxamic acid in solutions of
nitric acid............................................................................................................................... 107
6.1 Introduction........................................................................................................... 107
6.2 Experimental details.............................................................................................. 107
10. TABLE OF CONTENTS (Continued)
Page
6.3 Stoichiometry of the reaction of Np(VI) with acetohydroxamic acid (AHA) in
nitric acid ........................................................................................................................ 108
6.4 Analysis of the kinetics of the Np(VI) + AHA reaction in HNO3 ........................ 110
6.5 Conclusion ............................................................................................................ 114
7 Redox potential of the nitrous acid – nitric acid system........................................................ 115
7.1 Introduction........................................................................................................... 115
7.2 Experimental......................................................................................................... 116
7.3 Results and discussion .......................................................................................... 117
7.4 Conclusion ............................................................................................................ 120
8 Reaction of nitrous acid with acetohydroxamic acid in nitric acid solutions........................ 121
8.1 Introduction........................................................................................................... 121
8.2 Stoichiometry of the reaction................................................................................ 121
8.3 Investigation of the kinetic system........................................................................ 122
8.4 Influence of acidity, nitrate concentration and temperature.................................. 124
8.5 Conclusion ............................................................................................................ 127
9 Reaction of nitrous acid with hydrogen peroxide in nitric acid solutions ............................. 129
9.1 Introduction........................................................................................................... 129
9.2 Stoichiometry and reaction mechanism ................................................................ 129
9.3 Investigation of the kinetic system........................................................................ 130
9.4 Dependence of rate constants on acidity............................................................... 133
9.5 Dependence of rate constants on nitric acid and on total nitrate concentration .... 133
9.6 Dependence of rate constants on temperature....................................................... 136
9.7 Conclusion ............................................................................................................ 137
10 Effect of Gamma Irradiation on the Oxidation State of Neptunium in Nitric Acid in the
Presence of Selected Scavengers........................................................................................... 138
10.1 Abstract................................................................................................................. 139
10.2 Introduction........................................................................................................... 139
10.2.1 Radiolysis of Nitric Acid............................................................................. 139
10.2.2 Importance of HNO2 ................................................................................... 140
10.2.3 Methylurea and Acetamide ......................................................................... 140
10.2.4 Redox Reactions of Np with HNO2 and Vanadium(V)............................... 141
10.3 Experimental......................................................................................................... 142
10.3.1 Neptunium................................................................................................... 142
10.3.2 Nitrous acid ................................................................................................. 143
11. TABLE OF CONTENTS (Continued)
Page
10.3.3 Methylurea .................................................................................................. 143
10.4 Results and Discussion: ........................................................................................ 144
10.4.1 Nitrous Acid (HNO2) Radiolytic Production .............................................. 144
10.4.2 Methylurea .................................................................................................. 145
10.4.3 Methylurea Degradation by Gamma Irradiation ......................................... 146
10.4.4 Effect of Addition of Vanadium(V) ............................................................ 148
10.4.5 Effect of Low Concentrations of MU and V(V) on the Redox Speciation
of Neptunium after Irradiation ................................................................................. 148
10.4.6 Effect of High Concentrations of Methylurea on the Redox Speciation of
Neptunium after Irradiation...................................................................................... 149
10.5 Conclusion ............................................................................................................ 151
11 Reduction of Np(VI) in irradiated solutions of nitric acid .................................................... 152
11.1 Abstract................................................................................................................. 153
11.2 Introduction........................................................................................................... 153
11.3 Experimental......................................................................................................... 154
11.4 Results and Discussion.......................................................................................... 155
11.4.1 Effects of gamma radiation on neptunium(VI) in 4M HNO3...................... 155
11.4.2 Influence of nitric acid concentration.......................................................... 157
11.5 Conclusion ............................................................................................................ 160
12 Radiolytic production of nitrous acid in the HNO3 - TBP extraction system ....................... 162
12.1 Abstract................................................................................................................. 163
12.2 Introduction........................................................................................................... 163
12.3 Experimental......................................................................................................... 164
12.3.1 Chemicals.................................................................................................... 164
12.3.2 Nitrous acid instability, sample preparation and irradiation ....................... 165
12.3.3 Spectrophotometry ...................................................................................... 166
12.4 Results and Discussion.......................................................................................... 167
12.4.1 Extraction of HNO2 into 30% TBP/n-dodecane.......................................... 167
12.4.2 Radiolytic production of HNO2 in aqueous and organic solutions ............. 169
12.4.3 Combined organic and aqueous (biphasic system) system ......................... 171
12.4.4 Dependence of radiolytic yield of HNO2 on HNO3 concentration in
aqueous and organic phases ..................................................................................... 172
12.5 Conclusion ............................................................................................................ 173
13 General Conclusion ............................................................................................................... 174
13.1 Impact of work and summary of results................................................................ 174
13.2 Future work........................................................................................................... 176
12. TABLE OF CONTENTS (Continued)
Page
Bibliography ................................................................................................................................ 177
APPENDIX A. Analysis of Kinetic Data using Numeric Integration ........................................ 198
A.1 Background, rationale and significance ................................................................ 198
A.2 Chemical kinetics as a set of differential equations .............................................. 201
A.3 Runge-Kutta 4th
order (RK4) method ................................................................... 202
A.4 Solution of rate equations by the RK4 numeric method ....................................... 203
A.5 Implementation of the RK4 method in an Excel spreadsheet ............................... 204
APPENDIX B. Analysis Of Errors Of Pipetting Using Eppendorf Variable Volume Pipettes. 207
B.1 Introduction........................................................................................................... 207
B.2 Experimental......................................................................................................... 208
B.2.1 Dependence on the pipetting speed:............................................................ 209
B.2.2 Effect of Pipette Tip Pre-rinsing ................................................................. 210
B.3 Results................................................................................................................... 211
B.3.1 1 mL digital pipettor.................................................................................... 211
B.3.2 300µL digital pipettor ................................................................................. 212
B.3.3 5mL digital pipettor..................................................................................... 213
B.3.4 Dependence for the 10µL digital pipettor ................................................... 214
B.3.5 Manual 100 µL and 1000 µL pipettors........................................................ 215
B.4 Concluding Recommendations ............................................................................. 216
APPENDIX C. Review of Redox Reactions of Vanadium Ions with Neptunium and
Plutonium .............................................................................................................................. 218
C.1 Introduction........................................................................................................... 218
C.2 Review .................................................................................................................. 220
C.3 Conclusion ............................................................................................................ 227
13. LIST OF FIGURES
Figure Page
Figure 1 – Diagrams of formal redox potentials Eo’
in 1M HClO4 ................................................ 15
Figure 2 – Simplified scheme of the PUREX separation method.................................................. 20
Figure 3 - Distribution ratios of Np(IV), (V) and (VI) .................................................................. 22
Figure 4 – Overview of the steps of the UREX+3a separation scheme......................................... 25
Figure 5 - Effect of equilibrium HNO2 concentration on the redox speciation of neptunium ....... 30
Figure 6 – Chemical structures of formohydroxamic (left) and acetohydroxamic (right) acid ..... 46
Figure 7 – Design plan of the glass H-cell used for Np electrolysis.............................................. 66
Figure 8 - Dependence of reducing electrolytic current ................................................................ 67
Figure 9 – Neptunium(III), (IV), (V) and (VI) absorption spectra in 4.0M aq. HNO3 .................. 73
Figure 10 – Aqueous UV absorption spectra of the nitrite anion in water and of the
molecular nitrous acid and of the nitrate anions in HNO3 solution ............................................... 76
Figure 11 - Effect of the initial concentration of V(V) on reaction rate and equilibrium.............. 89
Figure 12 - Determination of reaction order with respect to concentration of Np(V) and V(V) ... 89
Figure 13 - Comparison of initial rates of oxidation of Np(V) by V(V) between reactions in
solutions of 1M HNO3 + 3 M LiNO3 and in 4M HNO3 (t = 25 °C) .............................................. 90
Figure 14 - Effect of the molar concentration of H+ on the apparent rate constant k1" and the
apparent equilibrium constant K' ................................................................................................... 91
Figure 15 - Determination of activation energy of oxidation of Np(V) by V(V) ......................... 92
Figure 16- Determination of reaction orders with respect to initial concentration of Np(VI)
and HNO2..................................................................................................................................... 101
Figure 17 - Effect of the molar concentration of hydrogen ions H+
and ionic strength μ on
the initial reaction rate ................................................................................................................. 102
Figure 18 - Determination of activation energy of reduction of Np(VI) by HNO2...................... 105
Figure 19 - Determination of the stoichiometry of the Np(VI) + AHA reaction in conditions
with excess AHA. ........................................................................................................................ 108
Figure 20 - Determination of the stoichiometry of the Np(VI) + AHA reaction in conditions
of excess Np(VI).......................................................................................................................... 109
14. LIST OF FIGURES (Continued)
Figure Page
Figure 21 – Fitting of the kinetic data of the reactions of Np(VI) with AHA by a second-
order rate law ............................................................................................................................... 110
Figure 22 – Identification of the role of H+
and NO3
-
ion in the effect of nitric acid on the
reaction rate of Np(VI) by AHA.................................................................................................. 112
Figure 23 – Determination of the activation energy of the reaction of Np(VI) with an excess
of AHA. ....................................................................................................................................... 113
Figure 24 - Nernstian plots for HNO2/HNO3 couple at 25.0°C ................................................... 117
Figure 25 - Dependence of the redox potential of 1mM HNO2 on the HNO3/H+
concentration................................................................................................................................ 118
Figure 26 - Dependence of the cell potential with 1mM HNO2 on the total nitrate .................... 119
Figure 27 – Temperature dependence of the redox potential....................................................... 120
Figure 28 - Determination of the stoichiometry of the HNO2 + AHA reaction in conditions
with excess AHA. ........................................................................................................................ 122
Figure 29 - Determination of the stoichiometry of the HNO2 + AHA reaction in conditions
with excess HNO2........................................................................................................................ 122
Figure 30 - Absorption spectra in 1M HNO3 of HNO2 and the long-lived reaction
intermediate identified during the reaction of AHA with HNO2. ................................................ 123
Figure 31 - Reaction of 7.5mM HNO2 with 9.5 mM AHA in 1M HNO3 at 25°C....................... 123
Figure 32 - Dependence of rate constants on acidity at constant nitrate concentration............... 125
Figure 33 - Dependence of rate constants on the total concentration of NO3
-
in the solution ..... 125
Figure 34 – Dependence of rate constants on reaction temperature ............................................ 126
Figure 35 - Spectrophotometric titration of 10 mM H2O2 by HNO2 (0.5M HClO4, t = 25°C).... 130
Figure 36 - Spectrophotometric titration of 10 mM NaNO2 by H2O2 (0.5M HClO4, t =25°C).... 130
Figure 37 - Absorption spectra of nitrous acid (HNO2) and peroxonitrous acids (HOONO)
used for fitting kinetic data .......................................................................................................... 131
Figure 38 - Reaction of 5.0 mM HNO2 with 10 mM H2O2 in 0.75 M HNO3 + 0.25 M LiNO3
at 2.5°C. ....................................................................................................................................... 131
Figure 39 - Dependence of HOONO formation rate constant kF on acidity - reaction of 5mM
HNO2, 10mM H2O2, t=2.5°C, 1M H/LiNO3 ............................................................................... 133
15. LIST OF FIGURES (Continued)
Figure Page
Figure 40 -Dependence of HOONO decay rate constant kD on acidity - reaction of 5mM
HNO2, 10mM H2O2, t=2.5°C, 1M H/LiNO3 ............................................................................... 133
Figure 41 - Determination of dependence of rate constants on HNO3 concentration.................. 134
Figure 42 -Dependence of rate constants on total concentration of nitrate - reaction of 5mM
HNO2 with 10mM H2O2, t=2.5°C, 0.25M HNO3 + 0.75-3.75 M LiNO3..................................... 135
Figure 43 -Dependence of rate constants on temperature - reaction of 5mM HNO2, 10mM
H2O2,............................................................................................................................................ 136
Figure 44 - Proposed nitrous acid scavengers.............................................................................. 140
Figure 45 - Methylurea nitrosation .............................................................................................. 141
Figure 46 - Increase of the final concentration of HNO2 produced by radiolysis of aqueous
solutions of HNO3 as a function of the effect of radiation dose (irradiation time). ..................... 144
Figure 47 - Change of UV absorption spectrum of HNO2 in HNO3 by addition of methylurea
(MU) ............................................................................................................................................ 145
Figure 48 - Changes in absorbance spectrum of solutions of 4M HNO3 with initial additions
of 10mM NaNO2 and variable concentrations of methylurea (MU) after irradiation by a dose
of 40.5 kGy. ................................................................................................................................. 146
Figure 49 - Degradation of 50 and 100 mM solutions of MU in 4 M HNO3 by radiolysis. ........ 147
Figure 50 - Time dependent change of redox speciation of 1.3 mM Np in aq. 4 M HNO3
containing 50 mM and 100mM methylurea of non-irradiated reference solutions...................... 149
Figure 51 - Dose dependent change of redox speciation of 1.3 mM Np in aq. 4 M HNO3
irradiated solutions containing 50 mM and 100 mM methylurea................................................ 150
Figure 52 - The concentrations of Np(V), Np(VI) and HNO2 versus absorbed dose .................. 156
Figure 53 - Irradiation at the 0.38 kGy/h dose rate: Concentration profile of Np(V) versus
absorbed dose in concentrations of HNO3. .................................................................................. 158
Figure 54 - Irradiation at the 0.38 kGy/h dose rate: Concentration profile of Np(V) and
HNO2 versus dose in two Np samples in 4M HNO3.................................................................... 158
Figure 55 – Normalized absorption spectrum of HNO2 in organic (0.23 M HNO3 in
30% TBP) and aqueous (1 M HNO3) phase ............................................................................... 166
Figure 56 – Distribution ratios of HNO3 and HNO2 for the non-irradiated and irradiated
(61kGy) system of the 30% TBP/n-dodecane and aqueous solutions of nitric acid.................... 168
16. LIST OF FIGURES (Continued)
Figure Page
Figure 57 – Concentrations of nitrous acid (±5 % system. error), produced by irradiation
different initial concentrations of HNO3 in aqueous solutions. ................................................... 168
Figure 58 - Concentrations of nitrous acid in organic phase (±15 % system. error), produced
by irradiation of 30% TBP equilibrated with different initial aqueous concentrations of
HNO3 (concentrations of extracted HNO3 are given in parentheses). ......................................... 170
Figure 59 - Comparison of the aqueous (±5 % system. error) and organic (±15 % systematic
error, error bars indicate random error) concentrations of HNO2 produced by a 61 kGy dose
in monophasic and biphasic experiments, plotted as a function of the nitric acid
concentration in aqueous phase. .................................................................................................. 171
Figure 60 – Density of water (ref. [204])..................................................................................... 210
Figure 61 – Example of dispension data...................................................................................... 210
Figure 62- Photography of pipette tips employed during this study............................................ 211
Figure 63 – Errors of the 1mL pipettor (fresh tips)..................................................................... 212
Figure 64 – Errors of the 1mL pipettor (rinsed tips)................................................................... 212
Figure 65 – Errors of the 300µL pipettor (fresh tips) ................................................................. 213
Figure 66 – Errors of the 300µL pipettor (rinsed tips)................................................................ 213
Figure 67 – Errors of the 5 mL pipettor....................................................................................... 214
Figure 68 – Errors of the 10µL pipettor....................................................................................... 215
Figure 69 – Errors of the 100 µL manual pipettor...................................................................... 216
Figure 70 – Errors of the 1 mL manual pipettor ......................................................................... 216
Figure 71 – Diagrams of formal redox potentials Eo’
for redox couples of Np and Pu in 1M
HClO4........................................................................................................................................... 219
17. LIST OF TABLES
Table Page
Table 1 – Overview of well-known oxidation states of lanthanide and actinides*........................ 11
Table 2 – Differences (in volts) in potentials of oxidation and reduction of tetravalent and
pentavalent uranides in 1M perchlorate system............................................................................. 17
Table 3 – Variation of the apparent equilibrium constants of Np(V) disproportionation in
HNO3 and HClO4 (data from Escure et al., 1971 [44]).................................................................. 27
Table 4 – Equilibrium data reported on the oxidation of Np(V) by nitric acid.............................. 29
Table 5 – Results and experimental conditions of kinetic studies of oxidation of Np(V) by
nitric acid ....................................................................................................................................... 31
Table 6 – Rate constants, reaction orders for H+
, and activation energies of Np(VI) and
Pu(IV) reduction by selected hydrazine and hydroxylamine derivatives in nitric acid / nitrate
solutions of 2 M ionic strength at the temperature of 25°C........................................................... 45
Table 7 -Comparison of standard (25°C) thermodynamic values for thermal activation at of
the reaction Np(V) + V(V) with published literary data................................................................ 93
Table 8 - Rate constants of the HNO2 + AHA reaction system in 1.0 M HNO3.......................... 124
Table 9 - Parameters of thermal activation for the processes of the AHA + HNO2 reaction
system .......................................................................................................................................... 127
Table 10 – Determined values of rate constants in experiments with various H2O2
concentration................................................................................................................................ 132
Table 11 – Parameters of thermal activation according to the activated complex theory. .......... 137
Table 12 - Overview of results of studies of radiolytic* yields of HNO2 from aqueous HNO3 .. 169
Table 13 - Comparison of radiolytic yields of HNO2 in aqueous and organic solutions of
HNO3 in concentrations corresponding to extraction equilibrium............................................... 172
Table 14 – Summary of all experimental results ......................................................................... 217
Table 15 – Standard electrochemical potentials for vanadium redox reactions [24]................... 219
Table 16 - Studied combinations of oxidation states of reactants in vanadium redox reactions
with neptunium ............................................................................................................................ 220
Table 17 - Studied combinations of oxidation states of reactants in vanadium redox reactions
with neptunium ............................................................................................................................ 225
18. LIST OF ACRONYMS
AHA Acetohydroxamic Acid
An Actinide element
ANL Argonne National Laboratory
ATALANTE ATelier Alpha et Laboratoires pour ANalyses, Transuraniens et Études de
retraitement
BASi Bioanalytical Systems, Inc.
CCD Chlorinated Cobalt Dicarbollide
CMPO Octyl(phenyl)-N,N-diisobutylcarboylmethyl-phosphine Oxide
DIAMEX DIAMide EXtraction
DOE Department of Energy
EDTA EthyleneDiamine Tetraacetic Acid
FHA Formohydroxamic Acid
FP Fission Product
FPEX Fission Product Extraction
H2Q Hydroquinone
HAN HydroxylAminium Nitrate
HDEHP Di-(2-ethylhexyl)phosphoric Acid
HPGe High Purity Germanium Detector
I Ionic Strength
INL Idaho National Laboratory
Ln Lanthanide element
LANL Los Alamos National Laboratory
LSC Liquid Scintillation Counting
MOX Mixed Oxide
MU Methylurea
NMU N-nitroso-methylurea
NaI Sodium Iodide Detector
NASA National Aeronautics and Space Administration
NPEX Neptunium Plutonium EXtraction
OLIS On-Line Instrument Systems, Inc.
OSR Off-site Source Recovery
PARC PARtitioning Conundrum key process
19. LIST OF ACRONYMS (Continued)
PEG Polyethylene Glycol
ppm Parts-Per-Million
PUREX Plutonium Uranium Reductional EXtraction
RK4 Runge-Kutta Fourth Order
RSM Rapid-Scanning Monochromator
RTG Radioisotope Thermoelectric Generator
SANEX Selective ActiNide EXtraction
SHE Standard Hydrogen Electrode
SIT Specific Ion Interaction Theory
SRP Standard Reduction Potential
SSC Silver-Silver Chloride electrode
TALSPEAK Trivalent Actinide Lanthanide Separations by Phosphorus-Reagent Extraction
from Aqueous Komplexes
TBP Tri-n-butyl Phosphate
THORP Thermal Oxide Reprocessing Plant
TRU Transuranic
TRUEX Transuranium Extraction
TRUELAB TRansUranic Element LABoratory
UNF Used Nuclear Fuel
UREX Uranium Extraction
UREX+ Uranium Extraction (Suite of Extraction Processes)
US DOE United States Department of Energy
UV-VIS-NIR UltraViolet-VISible-Near Infra-Red
20. LIST OF SYMBOLS
A Pre-Exponential Factor Alpha Decay
ai Molar Activity of Species i Order of Reaction
ci Molar Concentration of Species i β Beta Decay
D Distribution Ratio Gamma Radiation
E Half-Cell Potential (Specific Conditions) i Activity Coefficient
Eo
Standard Redox Potential ε Molar Absorption Coefficient
E’o
Formal Redox Potential μ Ionic Strength
Ea Activation Energy
G Gibbs Energy (Specific Conditions)
Go
Gibbs Energy (Standard Conditions)
H Enthalpy of Reaction
k Rate Constant
Kmn Equilibrium Constant
n Number of Exchanged Electrons
R Gas Constant
S Entropy of Reaction
T1/2 Half Life
v/v Volume Percentage
z Ionic Charge
22. 1
The Kinetic and Radiolytic Aspects of Control of the Redox Speciation of
Neptunium in Solutions of Nitric Acid
1 INTRODUCTION
1.1 General Background
Chemistry of radioactive elements has been an essential part of the development of
nuclear technology that began at the end of the 19th
century by the discovery of
radioactivity of uranium by Henri Becquerel in 1896 and of new chemical elements
present in its radioactive decay chain by Marie and Pierre Curie in 1898. At present day,
nuclear technology has many indispensable uses in research, medicine and general
industry, but the most prominent use is generation of nuclear energy from the fission of
heavy actinides. Prior to the March 2011 nuclear accident at the Fukushima Dai-ichi
power plant in Japan that resulted in significant alteration of policies of a few important
nuclear power producing countries (especially Germany), nuclear energy provided 5.8%
of world total primary energy supply, primarily in the form electricity - its share was
13.4% of the 20 thousand terawatt-hours of electric power generated around the world
per year . Despite a possible temporary setback, contemporary projections predict further
increase in the use of nuclear energy, driven especially by many large countries in Asia
(China, India, Korea). The activities of current world nuclear energy industry result in
generation of approximately 10 000 metric tons per year [1] of used nuclear fuel (UNF)*
– a complex mixture of chemical elements, each consisting of various isotopes.
Approximately 0.05-0.1% of the mass of UNF is made of the chemical element
neptunium (Np).
1.2 Motivation
Neptunium is an important actinide element from several different viewpoints (which
will be discussed later) and its separation from used nuclear fuel is a desirable target,
*
The author has decided to use in this document the more accurate and ideologically less burdened term
“used nuclear fuel” (UNF) despite the widespread past and present usage of its synonym “spent nuclear
fuel” (SNF).
23. 2
because of the issue of its long-term radiotoxicity and because of its valuable potential
application in production of the Pu-238 radionuclide, which has a recognized potential
for reliably powering inaccessible equipment, particularly in applications in space
technology.
At present, the technology of reprocessing of UNF employed by the nuclear fuel cycle
industry is called PUREX. This method is based on the selective liquid-liquid extraction
of uranium and plutonium from other elements in the nitric acid solutions of dissolved
used fuel using 30% tri-n-butylphosphate in kerosene. The process starts with the
dissolution of spent fuel rods in hot concentrated (8 M) nitric acid. The various nitrogen-
oxide compounds produced during the dissolution process and the high radiolysis rate in
the spent fuel solution result in neptunium existing in several different oxidation states –
primarily as Np(V) and Np(VI), possibly as Np(IV). Consequently, neptunium can be
distributed in both aqueous and organic product streams due to vastly different
extractability of these oxidation states, complicating the purification of the uranium and
plutonium products. Presently, neptunium is usually re-diverted into the highly active
raffinate waste stream [2].
In the recent research work on an advanced PUREX process called UREX+ at Argonne
National Laboratory in United States, original expectations about the behavior of
neptunium failed in predicting its speciation and movement in the liquid-liquid separation
process [3]. Despite significant adjustment of the feed solution (primarily by destroying
organic reducing agents and by increasing the concentration of nitric acid), the redox
speciation of neptunium did not reach the desired target. About a third of Np was not
extracted when desired and was ultimately recovered only in a later process stream [3].
Therefore, a better understanding of the kinetic and radiolytic aspects of the redox
chemistry of neptunium in nitric acid solutions is needed in order to effectively control
the destination of Np.
1.3 Expected Outcomes
The aim of this study was to develop or enhance the understanding of several key topics
governing the redox behavior of neptunium in nitric acid medium, all of which are of
vital importance for the engineering design of industrial-scale liquid separation systems:
24. 3
the kinetics of reactions of neptunium(V) and (VI) with several redox-active
compounds envisaged for use in the reprocessing and tested during UREX+
process development (vanadium-V, acetohydroxamic acid) – identification of
their rate law and determination of rate constants as a function of nitric acid
concentration and of temperature,
interactions of neptunium(V) and (VI) with nitrous acid (HNO2) as a key redox-
active compound in the nitric acid chemistry of neptunium,
effects of nitric acid radiolysis, which is perhaps the most important source of
nitrous acid in the real reprocessing solutions,
chemical reactions leading to scavenging of nitrous acid by artificially introduced
agents (methylurea, acetohydroxamic acid) or compounds generated due to
radiolysis of aqueous nitric solution (H2O2).
1.4 Overview of the Dissertation
The work presented in this dissertation was performed as part of the author’s graduate
studies at the Oregon State University and describes the scientific work performed in the
Radiochemistry research group of Prof. Alena Paulenova. The dissertation is written in a
manuscript format because most of its chapters will be published or have already been
published in scholarly journals. The text is organized into 12 chapters followed by a
bibliography and 3 appendices. The introduction sections of the manuscripts include
information that is also discussed in the general review of the dissertation.
The twelve chapters of this dissertation can be thematically divided in four main parts:
Chapters 1, 2, and 3 briefly describe the general purpose, motivation and expected goals
of the work, provide an argument about the importance of neptunium and describe its
position among the actinide elements, give an extensive overview on practical issues in
the control of neptunium redox state in extraction separation processes utilized for Used
Nuclear Fuel reprocessing, and, lastly, deal about the theoretical and practical
experimental details of the work described afterwards.
Chapters 4, 5, and 6 describe the research the author has undertaken to study the reactions
of neptunium with two redox agents artificially administered (pentavalent vanadium and
25. 4
acetohydroxamic acid) and one redox agent naturally present (nitrous acid) in the studied
system of nitric acid solution.
Chapters 7, 8, and 9 focus on the chemistry of nitrous acid itself in the nitric acid solution
and on the reactions leading to the scavenging of nitrous acid from the solution with
acetohydroxamic acid and hydrogen peroxide.
Chapters 10, 11, and 12 summarize the studies performed to better understand the
influence of radiation on the nitrous acid chemistry and especially on the redox chemistry
of neptunium in real reprocessing conditions.
The list of bibliography that supports this dissertation is followed by three appendices,
each related to a specific topic from the first three chapters of the dissertation, but in
bigger breadth than would be appropriate as a subsection of one of these chapters.
26. 5
2 REVIEW OF LITERATURE
2.1 Importance of Neptunium
2.1.1 Discovery
Neptunium, or element “93”, is a somewhat less well-known actinide chemical element,
lying between uranium and plutonium. The discovery of neptunium and its introduction
into the area of chemistry of transuranic elements has been made by Edwin M. McMillan
and Philip H. Abelson in 1939 soon after the effect of nuclear fission was discovered [4].
Since element 93 is the first element after uranium, it was named after Neptune, the first
planet to orbiting the Sun beyond Uranus. The neptunium isotope discovered was the
short-lived Np-239 (half-life of 2.3 days), the precursor of the more famous plutonium-
239, and the McMillan and Abelson have produced it using a neutron capture reaction:
1/2 1/2, 23 . , 2.3238 1 239 239 239
92 0 92 93 94
T min T days
U n U Np Pu
(1)
and proved its existence on the basis of Np-239 radioactive half-life.
Plutonium-239, which is an alpha-emitter, had a too long half-life of 24 110 years to be
discovered in the small amounts produced; consequently, McMillan and Abelson were
unsuccessful in detecting its radiation [5]. The discovery of the first plutonium isotope
(Pu-238) then took place a year later as a result of experiments of continuation of
transmutation experiments by Seaborg, Wahl and Kennedy [4, 6].
Even though Np-239 was the first isotope of neptunium to be discovered, due to its short
half-life it had very little significance in the investigation of its chemical properties.
These became of interest when Np-237 was discovered. It was first produced in
weighable quantities in nuclear reactors during the US Manhattan Program[7]. The
production of Np-237 happens by a thermal neutron capture on uranium-236, followed by
a beta-decay; U-236 is itself a product of nonfissioning neutron capture on the isotope
uranium-235, the fissile component of natural uranium. The process leading to Np-237
can be summarized in the following scheme:
1/2, 6.75235 236 237 237
92 92 92 93( , ) ( , ) T d
U n U n U Np
(2)
27. 6
In nuclear reactors featuring a fast neutron spectrum, which are so far relatively rare,
another process also leads to the production of neptunium directly from the more
abundant uranium isotope U-238 [8]:
1/2, 6.75238 237 237
92 92 93( ,2 ) T d
U n n U Np
(3)
Neptunium-237 is a long-lived nuclide that decays with a half-life of 2.144 million years
by an alpha-particle emission of several different energies between 4.5 - 4.9 MeV (most
prevalent is the energy 4.788 MeV at 47.64% intensity [9]). The radioactive decay is
accompanied by the emission of gamma-rays of various energies (29.4 keV and the
86.5 keV are of highest relevance with intensities of 15% and 12.4%, respectively [10]).
2.1.2 Neptunium in the nuclear fuel cycle
Since 1942, when the development of nuclear power started with Enrico Fermi’s Chicago
Pile 1 reactor experiment, hundreds of nuclear reactors have been operated around the
world for the purposes of production of electric and heat power (including naval
propulsion), plutonium for weapons, isotopes for medicine and industry, or just for
general research and education purposes.
Most of these reactors utilize the only naturally available fissile nuclide U-235 for their
fissile material. Presently, the primary reaction utilized for harvesting the energy
contained in uranium is the nuclear fission of the excited U-236 nucleus created by a
capture of a neutron on the nucleus of U-235. The reaction results in the production of
several neutrons (2.4 on average), one of which carries the nuclear chain reaction, and a
large variety of couples of two different-mass fragments L and H with atomic masses
distributed around 94 and 140, respectively [2] :
1 2
1 2
235 1 1
92 0 02 3A A
z zU n L H n (4)
A large amount of energy (187 MeV average) is released by this reaction, mostly in the
form of kinetic energy of the fragments, neutrons and gamma rays. The fission fragments
are in a highly unstable state which results in further radioactive transformation into more
stable fission products that releases additional decay energy (~10-15 MeV).
However, some neutron captures do not lead to nuclear fission and as a result of the
radiative neutron capture process (2), nuclear power reactors produce small, but
28. 7
significant quantities of neptunium-237. At present day, the ~440 reactors in operation
can be expected to create around 3000 kg of Np-237 annually [8]. Depending on the
initial enrichment and length of power operation, the content of neptunium in the used
nuclear fuel can reach up to nearly 1 kilogram per 1000 kg of initial uranium loading,
while the content of plutonium is approximately ten times larger [2].
2.1.3 Long-term Radiotoxicity of Neptunium in SNF
Light water reactors are the most common type of commercial nuclear power reactors
operated all over the world. Their fuel is initially made of uranium oxide, in which the
initial uranium-235 content is enriched to 3-5 % compared to its natural abundance of
0.72%, while the rest is the uranium-238 isotope. The used fuel coming from these
reactors consists of 94-96% uranium (with less than 1% U-235), 3-5% fission
products (FP), approximately 1% plutonium (over 50% is Pu-239, the rest is primarily
Pu-238, 240, 241 and 242), and around 0.1-0.2 % of the so called minor actinide (MA)
elements that are comprised of neptunium-237 and various isotopes of americium and
curium [2].
There are currently two main strategies of dealing with UNF – direct disposal without
any kind of treatment (Open Fuel Cycle) and reprocessing the fuel with the aim of
separating and recycling its uranium and plutonium content (Closed Fuel Cycle), while
leaving both fission products and minor actinides in the waste stream. In both strategies
neptunium ends up in a waste stream and is intended to be disposed of.
The 2.144 million year half-life of Np-237 represents an issue for the efforts of designing
repositories for waste containing neptunium. The 10-fold of the half-life (approximately
20 million years), which is the time necessary to let radioactivity reduce the amount of
neptunium 1000-fold, is too long for any engineered barriers to survive. Also, in certain
repository environments featuring oxidizing chemistry (such as is the recently halted
Yucca Mountain repository project [11]), neptunium favors the +V oxidation state, which
has the highest mobility of all actinide elements, which can then render even the
geological barrier of the repository much less effective [12].
29. 8
2.1.4 Non-proliferation issues
One of the more significant issues threatening the peaceful utilization of nuclear
technologies is the potential of misuse of used nuclear fuel for the purpose of
construction of nuclear explosive devices by non-recognized nuclear weapon states or
interest groups (the so called nuclear proliferation). The attention has been focused on
present-day industrial technologies for UNF reprocessing that lead to separation of fissile
plutonium from other constituents in used uranium fuel. Even though the isotopic
composition of plutonium from most kinds of civilian UNF is not entirely suitable for
nuclear weapon applications [13], the technical knowledge and real capabilities
associated with these separation technologies are under intensive international
surveillance.
Neptunium-237 has also been found to be a possible material for construction of nuclear
weapon (its bare sphere critical mass has been estimated to be around 60 kg, comparable
to U-235 [14]). However, in contrast to separated plutonium which has isotopes that
produce only weakly penetrating alpha and beta radiation and can thus be handled in
glove boxes, neptunium237 has an associated gamma-ray emission activity of its
radioactive decay daughter product protactinium233, which would significantly
complicate the handling of this material compared to handling of plutonium.
Therefore, neptunium has been considered as a tool for enhancement of proliferation
resistance of UNF reprocessing technologies by including both plutonium and neptunium
into one product stream [13], as opposed to the current practice of separating plutonium
from UNF in a pure form. Furthermore, plutonium is currently recycled in the form of
so–called Mixed Oxide (MOX) fuel. If the MOX fuel would also include neptunium,
further irradiation of Np237 by thermal neutrons would lead to the production of
Pu238:
1/2, 2.11237 238 238
93 93 94( , ) T d
Np n Np Pu
(5)
Plutonium-238 is a highly active alpha emitter due to its 87.7 years half-life and its
decays into the long-lived uranium-234, which is a main member of the decay chain of
natural uranium-238:
1/2 1/2 1/2, 87.7 , 245500 , 75380238 234 230
94 92 90
T y T y T y
Pu U Th
(6)
30. 9
Increased concentration of Pu-238 in plutonium would contribute significantly to its
specific heat generation (Pu-238 has an approximate power density of 0.5 W.g-1
).
Concentration of Pu-238 reaching 20% would most likely preclude its possible use in
preparation of a nuclear explosive device due to intensive heat generation (the critical
mass of a plutonium sphere is approximately 5 kg [2], resulting in 500 W heat power
generation – rendering the plutonium metal too hot to work with and possibly setting off
the plastic explosive lens surrounding the device). Nevertheless, recent analysis of this
particular application of neptunium has been considered rather impractical due to issues
with nuclear fuel neutronics and insufficient supply of neptunium in general [15].
2.1.5 Potential Uses of Neptunium
Besides of the somewhat unrealistic idea of employing neptunium in an industrial-scale
redox flow battery system investigated by Japanese scientists [16], the only practical use
of isolated neptunium-237 is in the production of pure Pu-238 by neutron irradiation.
Plutonium-238 is a very valuable material outside of the classical nuclear power
generation due to its high power density that is not accompanied by a significant gamma-
ray hazard. In combination with thermoelectric conversion it is the most prominent
material to be used in the so called Radioisotope Thermoelectric Generators (RTG),
which have been employed for operation in situation where uninterrupted operation,
maintenance and fuel replacement is too impractical or impossible – most notably as
cardiac pacemakers (cardiostimulators) inside the human body and for powering deep-
space probes [17].
In United States only, approximately 1600 pacemakers were implanted in 1970s,
typically containing approximately 0.2 to 0.5 grams Pu-238 (130-310 GBq α-activity) as
the heat source for the batteries. In terms of power reliability and longevity (only 11%
power decrease in 10 years of operation) RTG source at that time outperformed any
chemical battery sources; interestingly, most of these devices survived their users and are
being collected by the Off-Site Source Recovery (OSR) Project at the Los Alamos
National Laboratory (LANL) [18]. However, soon after the application of RTG
pacemakers, long-lasting lithium batteries (>10 years) were developed in 1974 and the
use of Pu-238 RTG-powered pacemakers has been discontinued [19].
31. 10
Presently, production of Pu-238 for space power applications of is the most prominent
practical application of neptunium. For a large space probe that ventures far from the
availability of solar power, multiple-kilogram Pu-238 heat sources were installed (e.g. the
famous Voyager 1, Voyager 2, and Cassini space probes had each over 10kg of Pu-238
[20])†
. Recently, constraints in availability of Pu-238 for space programs of the National
Aeronautics and Space Administration (NASA) have spurred the United States
Department of Energy (DOE) into revitalizing the neptunium irradiation program in order
to produce sufficient amounts (up to 2 kg per year) of Pu-238 for future expected
applications [21]. Neptunium targets are planned to be irradiated in existing DOE
research reactors, the High Flux Isotope Reactor in Oak Ridge National Laboratory and
the Advanced Test Reactor at Idaho National Laboratory and then reprocessed using
solvent extraction to extract Pu‐238 [22, 23].
†
The author has to also acknowledge the recent successful landing of the NASA Curiosity Mars rover that
took place on August 6, 2012, in the last days of compiling of this work [214]. Curiosity was launched with
a radioisotope thermoelectric generator containing 4.8kg of 238
PuO2 [215].
32. 11
2.2 General chemical properties of neptunium among the actinide elements
2.2.1.1 Oxidation states of actinide elements
Neptunium is a member of the 5f electron series called the actinide elements, the
discovery of which is primarily attributed to Glenn T. Seaborg. In contrast to the
lanthanide elements which exhibit a very homogeneous redox behavior with increasing
atomic number (with most stable oxidation state +III), the behavior of early actinides
(Ac, Th, Pa, U) is more similar to transition metals. As is demonstrated in Table 1,
actinide elements start to mimic lanthanide behavior only after curium.
Table 1 – Overview of well-known oxidation states of lanthanide and actinides*
Lanthanides La Ce Pr Nd Pm Sm Eu Gd Tb Dy Ho Er Tm Yb Lu
III III
IV
III
(IV)
(II)
III
(IV)
III
II
III
II
III III III
(IV)
(II)
III
(IV)
III III
(II)
III
II
III III
Actinides Ac Th Pa U Np Pu Am Cm Bk Cf Es Fm Md No Lr
III
(II)
(III)
IV
(III)
IV
V
III
IV
V
VI
III
IV
V
VI
VII
III
IV
V
VI
VII
(II)
III
IV
V
VI
III
IV
III
IV
(II)
III III
(II)
III
II
III
II
III III
* most stable oxidation states are indicated by being underscored and bold, oxidation states in brackets are
known from solids or non-aqueous solutions; table based on refs. [24, 25]
The elements of uranium, neptunium, plutonium and americium form a quite original
chemical group – uranides – that is characterized by multiplicity of possible oxidation
states in aqueous solutions. The properties of the corresponding oxidation states of these
four actinides exhibit significant similarities. The possible and common oxidation states
of uranides are +III, IV, V, and VI. In basic and strongly oxidizing solutions, stabilization
of the +VII oxidation state has been achieved for Np and Pu [24].
In acidic aqueous solution, the tri- and tetravalent cations are present in the form of M3+
and M4+
while penta- and hexavalent uranides form the nearly linear di-oxocations MO2
+
and MO2
2+
. These actinyl molecular cations are remarkably stable, and “bare” M5+
and
33. 12
M6+
ions have not been observed so far in aqueous environments (in non-aqueous
environment the hexafluorides of U, Np and Pu have been well studied [26]). The
structure of the actinyl ions is linear: O=M=O, the strength of the covalent bonds being
only somewhat weaker (length of bonds longer) for the +V compared to the +VI
oxidation state, without any significant change to the geometry.
All actinide ions are complexed by water or by other ligands present in aqueous
solutions, and the coordination numbers of water molecules is between 8 and 10 for tri-
and tetra-valent ions and between 5 and 6 for penta- and hexa-valent ions [27].
2.2.1.2 Basic principles of complexation chemistry of different redox states of actinides
The complexation chemistry of different redox states of actinides plays an enormously
important role in their separation from other elements and from each other by many
different separation processes, and especially so in liquid-liquid extraction or ion
exchange. The degree of complexation by hard ligands (such as sulfate, chloride or
nitrate anions) increases in the following order [27]:
M4+
> MO2
2+
>> M3+
> MO2
+
The tendency of forming complexes increases in the series from uranium(IV) to
americium(IV) and decreases from uranium(VI) to americium(VI). It is important to note
that the degree of complexation of the pentavalent ions cannot be considered as entirely
negligible since they form complexes with, e.g., NO3
-
, SCN-
and with anions of the
ethylenediamine tetraacetic acid (EDTA) [27].
In general, the stability of the actinide complexes with important inorganic and organic
anions increases in the order [27]:
ClO4
-
< I-
< Br-
< Cl-
< NO3
-
< SO4
2-
< CH3COO-
<< F-
≈ (COO)2
2-
< CO3
2-
< PO4
3-
The above-described rules are important for the understanding the differences in the
stability of even-charged oxidation states of actinides, especially the tetravalent state,
between non-complexing and complexing environment – one of the prime examples is
the stabilization of tetravalent plutonium in 3M hydrochloric acid [28] or
disproportionation of neptunium(V) into Np(IV) and Np(VI) in the medium of
complexing 2M sulfuric acid [17].
34. 13
Hydrolysis of actinide ions is a special case of complexation with hydroxide anions OH-
.
The degree of hydrolysis depends on the actinide oxidation state in the same order, as
described above for other complexants; therefore, it most strongly affects the tetravalent
actinides. The effects of hydrolysis on actinide speciation are of paramount importance in
neutral and alkalic solutions, but acidic solutions with pH<1 are mostly free of the effects
of hydrolysis [27].
2.2.1.3 Redox potentials of actinides in aqueous solutions
The explanation of stability and reactivity of different actinide oxidation state can be
most quantitated by the comparison of the standard reduction potentials Eo
(also standard
redox potential) of their redox couples. By definition, the Eo
is equal to the electric
potential difference of an electrochemical cell reaction of the reduction of the actinide (or
any other species) in higher oxidation state An(ox) to a lower oxidation state An(red) by
the oxidation of molecular hydrogen to solvated protons (in standard conditions of ideal
1 mol/L concentration activities of all solute reactants and of 100 kPa of H2 gas pressure
at the temperature of 25 °C = 298.15 K) [25]:
2( ) ( ) 2An ox H An red H
(7)
The reaction is characterized by the change in the value of Gibbs free energy ΔGo
(J/mol)
and the standard reduction potential is related to this thermodynamic quantity by the
relation:
ln
o
o G RT
E K
nF nF
(8)
where F is the Faraday constant of electric molar charge (F = 96 485 C/mol), R is the
ideal gas constant (R = 8.314 J/K/mol), T is the absolute temperature (in kelvins) and K is
the equilibrium constant of reaction (7).
By international scientific agreement, the value of Eo
of reaction (7) is made equivalent
with an ideal half-cell potential reaction that describes the reduction of the actinide (or
any other species) in higher oxidation state An(ox) to a lower oxidation state An(red) by
accepting a number of n electrons (e-
):
( ) ( )An ox n e An red
(9)
35. 14
The Nernst Law describes the potential E of such a half-cell when the concentration
activities aAn(Red) and aAn(Ox) of the reduced and oxidized form of the actinide species are
changing:
( ) ( )
( ) ( )
( )
ln ln
( )
An red An redo o
An ox An ox
a An redRT RT
E E E
nF a nF An ox
(10)
Due to complicated hydrolysis phenomena that take place in neutral solutions of very low
ionic strength, where the activity coefficients γ would be equal to 1, the redox potentials
of actinides have been tabulated as formal reduction potentials Eo
' that are defined by the
relationship:
( )
ln
( )
o An redRT
E E
nF An ox
(11)
The values of Eo
' are specific for a particular medium in which the activity coefficients of
the actinides are independent of their own concentrations.
For acidic solutions of actinides, formal reduction potentials are usually determined at
1M H+
concentration and therefore their values approximate the standard potentials – due
to its weak complexation power, 1M perchloric acid medium is usually the most popular
for accurate determination of actinide potentials.
Figure 1 shows the Latimer diagrams of the formal reduction potentials Eo
'(Anox
/Anred
) of
the couples of different oxidation states of uranides in acidic aqueous solutions. The
values are capable of explaining the tendency of progressive stabilization of lower
oxidation states in the order from uranium to americium, previously denoted in Table 1,
on the basis of comparison with the approximate half-cell potentials of reduction and
oxidation of the primary matrix component of aqueous solutions – water‡
[25]:
22 2H e H
E(H+
/H2)o
≈ 0.000 V (12)
2 24 4 2H e O H O
E(H+
,O2/H2O) ≈ 1.229 V (13)
Redox couples with potentials lower than that of reduction of hydrogen ions should
liberate hydrogen from aqueous solutions, which will oxidize the lower redox state of the
couple An(red)An(Ox), and, correspondingly, couples with redox potentials above the
‡
H+
ions in the reaction (12) are replenished by the autoionization of water: H2O ↔H+
+ OH-
36. 15
oxidation of water should liberate gaseous oxygen while the higher oxidation should get
reduced An(Ox)An(Red).
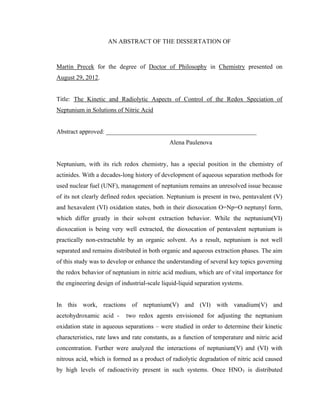
Figure 1 – Diagrams of formal redox potentials Eo’
in 1M HClO4
(in volts vs. normal hydrogen electrode at 25°C) for redox couples of U, Np, Pu and Am
data adopted from: U and Np - ref. [29], Pu – ref. [28], Am – ref. [30]
(data in brackets are standard potentials Eo
from ref. [25])
It is evident from Figure 1 that uranium(III), americium(II) and all uranides in their
elemental form are strong reducing agents capable of reducing water to hydrogen, while
americium(IV) and (VI) are powerful enough oxidizers to oxidize water to oxygen;
therefore, these actinide redox species are not stable in aqueous solutions. In the case of
U(VI) U(V) U(IV) U(III) U(0)
+0.065 (+0.38) -0.631 (-1.642)
+0.338 (-1.38)
Np(VI) Np(V) Np(IV) Np(III) Np(0)
+1.137 +0.740 +0.154 (-1.772)
(+0.882) (-1.274)
Pu(VI) Pu(V) Pu(IV) Pu(III) Pu(0)
+0.913 +1.172 +0.982 -2.023
+1.077
+1.022
+1.043 -1.272
Am(VI) Am(V) Am(IV) Am(III) Am(II) Am(0)
+1.60 +0.84 +2.62 -2.30 -1.95
-2.07
-0.90
+1.727
+1.683
37. 16
plutonium and neptunium, all oxidation states can be present in acidic aqueous solutions
that have been de-aerated – since neptunium(III) is easily oxidized by oxygen in air.
2.2.1.4 Disproportionation reactions of actinides
Among the individual oxidation states of a particular uranides element, there are three
possible types of reaction in acidic aqueous solutions:
3 2 4
2 2An AnO An AnO
(14)
4 3 2
2 22 2 4An H O An AnO H
(15)
4 2
2 2 22 4 2AnO H An AnO H O
(16)
These reactions can be observed with all uranides, but the equilibria depend on the nature
of the element, acidity and especially the complexing power of the solution – complexing
agents can significantly shift the equilibria by preferentially binding tetravalent and
hexavalent actinides. The tendency of tetravalent and pentavalent oxidation state toward
disproportionation can be assayed by calculating the differences in potentials of their
oxidation to a higher oxidation state and reduction to a lower oxidation state, defined as:
ΔE(IV) = Eo
(AnV
/AnIV
) – Eo
(AnIV
/AnIII
) (17)
ΔE(V) = Eo
(AnVI
/AnV
) – Eo
(AnV
/AnIV
) (18)
As can be derived from equation (8), variables ΔE(IV) and ΔE(V) are proportional to the
negative values of the Gibbs free energy change ΔGo
of reaction (15) and (16), which
describe the disproportionation of An(IV) and An(V), respectively.
Since a positive value of ΔE(IV) or ΔE(V) would indicate a positive value of the Gibbs
free energy change, the reaction (15) and (16) would not be spontaneous and the
respective oxidation state would be most likely stable. However, when the difference
ΔE(IV) or ΔE(V) is close to zero or negative, the particular ion An(IV) or An(V),
respectively, is liable to a partial or complete spontaneous disproportionation [31]. The
results based on calculations from data in Figure 1 are presented below in Table 2 and
show that pentavalent U and Pu are unstable toward disproportionation, as is tetravalent
Am. The value of ΔE(IV) in case of tetravalent plutonium is also low enough to allow its
disproportionation – so that solutions of initially pure Pu(IV) and Pu(V) in 1M HClO4
system will over time disproportionate into solutions that will preserve the average
38. 17
tetravalent or pentavalent oxidation state, respectively, but it will contain significant
fractions of all four aqueous oxidation states of plutonium: +III,+IV, +V and +VI [28].
Table 2 – Differences (in volts) in potentials of oxidation and reduction
of tetravalent and pentavalent uranides in 1M perchlorate system
U Np Pu Am
ΔE(IV) 1.01 0.59 0.19 -1.78
ΔE(V) -0.32 0.40 -0.26 0.76
2.2.1.5 General characteristics of kinetics redox reactions of actinides
In the study of redox behavior of actinide elements in solutions, information about the
kinetics of these processes (in combination with the knowledge of their thermodynamic
aspects) is necessary to develop a sufficient level of understanding of these processes for
their practical application in laboratory research and industrial use.
In a typical actinide reaction with redox agents, a 1:1 stoichiometry is observed - the
actinide element An changes its oxidation state from (X) to (Y), while the redox agent R
is converted to a product P or multiple different products:
( ) ( )An X R An Y P (19)
The kinetics studies are usually interested in the temporal dependence of the rate of these
reactions. Since sometimes the determination of stoichiometry is not possible, the rate in
homogeneous solutions is typically defined as the negative value of the time derivative of
the molar concentration of one of the reactants of interest, usually the actinide element in
its starting oxidation state An(X):
[ ( )]d An X
rate
dt
(20)
The standard dimension of the rate is traditionally mol/L per second, M.s-1
.
In general, the rate of most of such reactions usually follows a mathematical expression
called the rate equation or rate law, in which the rate at a particular point in reaction time
is proportional to a certain power of each of the immediate concentrations of the reacting
actinide [A(X)] and the redox agent [R]:
[ ( )]
[ ( )] [ ]
d A X
k An X R
dt
(21)
39. 18
The exponents α and β are called reaction orders with respect to the particular reactant
and the overall order of the reaction is determined by their sum, while k is the rate
constant, characteristic for each reaction. Actinide reactions usually follow some
variation of the so called overall second order process, in which the rate is of 1st
order
with respect to both the actinide An(X) and the redox agent R:
[ ( )]
[ ( )][ ]
d A X
k A X R
dt
(22)
The quantity k" is the apparent 2nd
order rate constant of the reaction and has a standard
dimension of M-1
s-1
. In the situation where one of the reactants (usually the redox agent)
is in a significant excess, e.g. in conditions where [A(X)] is much smaller than [R] already
at the beginning of the process, the reaction will follow an apparent 1st
order (pseudo-1st
order) rate equation:
[ ( )]
[ ( )]
d A X
k A X
dt
(23)
with k' being the apparent 1st
order standard rate constant of the standard dimension of
reciprocal time (s-1
).
The values of both apparent 1st
and 2nd
order constants usually depend on other
parameters of the reacting system, primarily on the acidity, ionic strength, and
temperature, which are usually assumed to be constant during a particular chemical
reaction. The temperature dependence of most reactions follows the Arrhenius Law:
aE
R T
k A e
(24)
in which T is the absolute temperature (in kelvins), R is the ideal gas constant
(8.314×10³
kJ.K1
mol1
) and A is the so called frequency factor of the same dimension as
the rate constant, and Ea (kJ/mol) is the activation energy [32].
equation (24) is usually employed in a logarithmic form to acquire the activation energy
from the slope of a linear relationship:
A
1ln ln
E
k A
R T
(25)
In combination with the knowledge of stoichiometric coefficients, the exact form of the
rate law (21), the value of the rate constant k and its dependence on the concentration of
the major constituents of the solution (e.g., hydrogen ions) at the standard ambient
40. 19
temperature of 25°C (298 K), and the activation energy Ea are the three characteristics
that usually used to describe the kinetics of a chemical reaction.
Furthermore, data on thermal activation are frequently analyzed by the assumptions of
Activated Complex Theory [32], where the rate constant is expected to be related to the
thermodynamics of an activated state, which is an unstable intermediary between the
reactants and the products. The activated state is usually characterized by several
thermodynamic quantities - the free Gibbs energy, entropy and enthalpy of the activation
process: ∆G≠
, ∆S≠
and ∆H≠
, which can be calculated by a modified Eyring formula [32]:
1 e e e e e e
AEG S H S
B B BRT R RT R RT
k T k T k T
k
h h h
(26)
where kB = 1.38×10⁻²³
J K-1
is the Boltzmann constant and h = 6.63×10⁻³⁴
J s is the Planck
constant. The activation entropy may contain information about the structural
relationships of the formation of the activated complex, negative entropy values
indicating associative processes and positive values hinting on dissociative processes[32].
A more detailed description of the applied methodology for the study of reaction kinetics
is provided in chapter 3.
41. 20
2.3 Neptunium in Reprocessing of Used Nuclear Fuel
2.3.1 PUREX Process
The essential step of UNF reprocessing is the world-wide used PUREX process
(Plutonium Uranium Reductional EXtraction), which is based on solvent extraction of
uranium and plutonium from fission products and minor actinides dissolved in aqueous
nitric acid, their partitioning, and purification. The process employs a 30% solution of tri-
n-butylphosphate (TBP) in an n-alkane diluent. The purpose of the diluent is to enhance
phase separation kinetics (by reducing the density and viscosity of the organic phase) and
also to fine-tune the extraction properties of TBP. The diluent is usually based on a
mixture of paraffin hydrocarbons (alkanes) such as kerosene (for purposes of scientific
research the most widely used standard is n-dodecane, C12H26) [33]. A significantly
simplified scheme of the method is displayed in Figure 2.
Several elementary steps are to be performed prior to the extraction, such as removal or
deterioration of fuel cladding, fuel dissolution in nitric acid, suction and purification of
liberated gases, removal of fuel cladding and insoluble fission products from the
dissolved UNF nitric acid solution, solution conditioning in preparation for liquid
extraction.
Figure 2 – Simplified scheme of the PUREX separation method
The most important chemical reactions for the most common nuclear fuel, which is
based on uranium dioxide, are the dissolution reactions and uranium oxidation to the +VI
state [2]:
UNF Chopping Dissolution
Cladding
Partitioning
Liquid-liquid
extraction
Off-gases Off-gases TBP/dodecane
Highly-active
raffinate
(Np, Am, Cm + FP)
Reductant
Plutonium
HNO3
Uranium
gas
solid
liquid, organic
liquid, aqueous
42. 21
3UO2 + 8 HNO3 → 2 UO2(NO3)2 + 2 NO + 4 H2O (< 10 M HNO3) (27)
UO2 + 4 HNO3 → UO2(NO3)2 + 2 NO2 + 2 H2O (> 10 M HNO3) (28)
By feeding oxygen to the dissolving cell it is possible to reduce the amount of nitrogen
oxide fumes [2]:
2 UO2 + 4 HNO3 + O2 → 2 UO2(NO3)2 + 2 H2O. (29)
During dissolution the whole radioactive gaseous inventory of UNF is liberated.
Explicitly they are radioactive gases like tritium, oxides of carbon-14, krypton-85, and
iodine129 and to some extent gaseous tetroxide of ruthenium-106. All these gases are
directed (together with the created nitrogen oxides) to processes of nitric acid
regeneration and purification systems.
The major advantage of the PUREX process is that it selectively extracts Pu(IV) and
U(VI) from dissolved UNF solutions of moderate (multimolar) nitric acid concentrations.
Tetravalent and hexavalent actinides such as U(VI), Pu(IV), Pu(VI), Np(IV) and Np(VI)
are readily extracted whereas trivalent and pentavalent actinides like Pu(III) and Np(V)
are almost inextractable – comparable to the extraction of the trivalent lanthanides that
form a large part of the fission product elements. After UNF dissolution, neptunium is
usually present as a mixture of inextractable Np(V) and extractable Np(VI) [2, 34].
A limited presence of small concentrations of the extractable Np(IV) is also possible, but
unlikely due to the highly oxidizing effects of hot nitric acid used during the dissolution
process. The extraction of actinides from the aqueous to the organic phase proceeds by
the formation of neutral solvates – adducts of TBP and uncharged nitrate complexes of
actinide ions molecules, which can then be transferred to the non-polar organic
phase [35]. The most important extracting species are U(VI), Pu(IV) and Np(IV):
UO2
2+
(aq.) + 2 NO3
-
(aq.) + 2 TBP(org.) ↔ UO2(NO3)2.2TBP(org.) (30)
Pu4+
(aq.) + 4 NO3
-
(aq.) + 2 TBP(org.) ↔ Pu(NO3)4.2TBP(org.). (31)
NpO2
2+
(aq.) + 2 NO3
-
(aq.) + 2 TBP(org.) ↔ NpO2(NO3)2.2TBP(org.) (32)
The affinity of a particular species present in the aqueous phase is described by its
distribution ratio D, which is defined as the ratio of the equilibrium concentration of the
particular species in the organic phase corg. against the concentration in the aqueous
phase caq.:
43. 22
.
.
org
aq
c
D
c
(33)
As is demonstrated in Figure 3 below the distribution ratios of the three neptunium redox
species that can exist in the PUREX system – Np(IV), Np(V) and Np(VI), are dependent
on the nitric acid concentration in the aqueous phase.
Figure 3 - Distribution ratios of Np(IV), (V) and (VI)
between aqueous nitric acid and 30% TBP/n-alkane (t= 20 to 30°C);
data from V.A. Drake, 1990 [17]
Besides the concentration of nitric acid, the distribution ratios are substantially influenced
by the concentration of uranium and plutonium in the solution and by the concentration
of TBP in organic phase. Decreased extraction of neptunium is a result of the tendency of
uranium to replace neptunium in the organic phase, because the uranium-TBP complex is
more stable than the neptunium-TBP complex [17]. As has been shown in equations (30)-
(32), the result of the extraction are TBP adducts of UO2
2+
, NpO2
2+
, and Pu4+
nitrates in
the organic phase and a mixture of fission products and minor actinides (which include
NpV) in the aqueous phase. The aqueous phase is called highly active raffinate and is the
primary high level active waste produced in reprocessing [36].
The following step of the PUREX process is separation of plutonium from uranium and is
traditionally called as partitioning [37]. It is performed by a reducing agent that converts
plutonium into its poorly extracting trivalent state so that it is selectively stripped from
the organic phase into the aqueous phase. There are multiple ways to reduce plutonium,
0.01
0.10
1.00
10.00
0 1 2 3 4 5 6 7 8 9 10
Npdistributionratio
c(HNO₃), M
Np(IV)
Np(V)
Np(VI)
44. 23
usually involving the use of a reducing agent. The historic use of salts of bivalent iron as
a reducing agents has been discontinued to avoid the increasing of the weight and volume
of the non-evaporable salt material content of the highly active waste, which is to be
eventually be vitrified [36]. Presently, most facilities ended up utilizing reduced
tetravalent uranium U4+
as a waste-free reducing agent for Pu4+
:
U4+
+ 2 Pu4+
+ 2 H2O → UO2
2+
+ 2 Pu3+
+ 4 H+
. (34)
Preparation of U4+
is performed in a later step of the PUREX process where it is
produced from pure uranium(VI) nitrate solution by electrolysis or by hydrogen
reduction [36]. Alternatively, Pu4+
can be reduced by electrolysis directly [38], but
despite its considerable advantages this method has been utilized in commercial
reprocessing only in Russia [39]. Recently, stripping agents based on rapid selective
complexation of tetravalent plutonium have been proposed, having the advantage of
faster stripping kinetics compared to reducing agents [40].
The partitioned uranium and plutonium fractions are then several times purified with
extraction and re-extraction (backwashing) steps in isolated uranium and plutonium
purification cycles. The desired products of reprocessing – uranium and plutonium – are
generated in the form of highly purified nitrate solutions which are thereafter subjected to
several processes that result in solid U and Pu oxides [2]. Meanwhile, the contaminated
nitric acid is recycled for repeated utilization in the process. Since neptunium is usually
an undesirable contaminant in U or Pu product, it is routed along back to the waste
processing of the highly active raffinate and ultimately ends up in a vitrified form.
The extraction of uranium and plutonium is performed either in a series of mixer-settlers
or in several meters high continual pulsed columns [36]. In these devices the heavier
aqueous phase of nitrate solution is contacted with the lighter organic phase containing
TBP. A modern generation of contacting devices – centrifugal contactors – has various
potential advantages (especially their compactness and throughput) and has been in
research and development use for several decades [41], but has not met practical
industrial application yet in the PUREX industry due to already previously established
facilities. On the other hand, it is assumed that future reprocessing facilities will use
centrifugal contactors for liquid-liquid extraction, due to much shorter residence times of
45. 24
these contactors in comparison to mixer-settlers and pulsed columns, newer sufficiently
fast redox reagents had to be identified [42].
2.3.2 Advanced PUREX processes
Since the 1990s there has been an increased international interest in advanced nuclear
fuel cycles that would improve on the deficiencies of the current closed fuel cycle [43,
44]. Both partially closed cycles in which Pu is recycled as mixed-oxide fuel (MOX) and
fully closed cycle which recycle all the transuranium (TRU) elements (Np, Pu, Am and
Cm) have been suggested. It has been generally agreed that separation of neptunium
alone is feasible with slight modifications of the PUREX process, because it is possible to
maintain Np in a hexavalent state. Aside from neptunium, modification of the established
PUREX process also enables the separation of iodine and technetium, important fission
products with significantly long-lived radioactive isotopes (I-129 and Tc-99 have half-
lives of 1.6×10⁷
and 2.14×10⁵
years, respectively). The case of separation of Am and Cm,
which are most stable in their TBP-inextractable trivalent oxidation state, necessitates the
employment of substantially different extraction systems (e.g. based on weak nitrogen
donor extractants) [42].
Many advanced fuel cycle concepts were proposed and examined – e.g.
DIAMEX/SANEX processes (CEA, France), “four-group process” (Japan) [42, 44]. In
the United States a family of processes called under a generic name of UREX+ was in
development by the US Department of Energy under the Advanced Fuel Cycle
Initiative [3]. All of the UREX+ processes are distinguished by the fact that they do not
separate pure plutonium, which is the main nonproliferation advantage of this UNF
reprocessing concept [13].
The UREX+ process in general is a series of different solvent extraction processes and
one ion exchange operation. Two of the solvent extraction steps are a modification from
the PUREX process (based on extraction by TBP organic solution from aqueous nitric
acid); the other solvent extraction processes utilize different organic extractants. The
most recent demonstration of the process modification called UREX+3a, the scheme of
which is summarized in Figure 4, was performed in 2007 in Argonne National
Laboratory [45].
46. 25
Figure 4 – Overview of the steps of the UREX+3a separation scheme
In the individual steps of the UREX+3a visible in Figure 4, the oxidation state of
neptunium is conditioned by redox agents in the UREX and the NPEX steps.
The UREX step is a modified version of the first PUREX step involving the extraction of
uranium and technetium by 30% TBP from a low-concentration (< 1 M) aqueous nitric
acid solution of UNF. An aqueous complexing / reducing agent (acetohydroxamic acid,
AHA) is employed to prevent extraction of plutonium (by formation of poorly extracted
complexes of tetravalent Pu) and neptunium (by reduction of Np to the inextractable
pentavalent oxidation state) from the aqueous phase.
In NPEX, which is based on another modification of the first PUREX step, the aqueous
stream of the FPEX process is adjusted by heating and evaporation to increase the
concentration of nitric acid in the solution and destroy the remaining acetohydroxamic
acid complexant/reductant. An oxidizing agent like vanadium(V) as VO2
+
is also added
to ensure that most of neptunium is in the extractable hexavalent state [17] (a potential
need of treating of the aqueous solution with a nitrous acid scavenger, such as is sulfamic
acid, was also identified [46]); consequently, plutonium is extracted together with
neptunium into the 30% TBP organic phase and separated from the rest of the fission
products and minor actinides (Am, Cm).
The increased proliferation resistance of the UREX+3a process is based on the fact the
neptunium follows plutonium until the product phase, where mixed plutonium-neptunium
oxides are expected to be made. As has been discussed before in chapter 2.1.4, an Np-237
impurity in plutonium would substantially increase the gamma-ray emission rate from the
product material (somewhat discouraging its use as a weapons material) and lead to
Dissolved
UNF
UREX
Ion exchange
U Tc
FPEX NPEX TRUEX TALSPEAK
TBP AHA
calixarene +
crown-ether
TBP
Pu + Np Non-Ln FP
Ln FP
Am+CmCs+Sr
TBP+CMPO HDEHP
Lactate
+ DTPAVO2
+
47. 26
Pu238 production if used as MOX fuel in a nuclear reactor, further disqualifying the
plutonium fraction from any consequent weapons material use, if the used MOX fuel
were to be reprocessed. On the other hand, it is as yet an open question how hard it would
be for a rogue agency to physically modify an industrial-scale UREX+ process to ensure
the isolation of pure plutonium [13].
48. 27
2.4 Control of the oxidation state of neptunium by redox reagents
2.4.1 Neptunium disproportionation and reaction with HNO3
In strongly acidic solutions, such as is multimolar nitric acid used in most UNF
reprocessing systems, Np(V) can partially disproportionate to Np(IV) and Np(VI). The
reaction is dependent on the acid concentration, following the equilibrium reaction:
4 2
2 2 22 4 2NpO H Np NpO H O
(35)
The apparent neptunium equilibrium concentration constant Kc and the fraction RNp(V) of
pentavalent neptunium in total neptunium [Np]t:
4 2
2
2
2
[ ][ ]
[ ]
c
Np NpO
K
NpO
(36) ( )
[ ( )] 1
[ ] 1 2
Np V
t c
Np V
R
Np K
(37)
are dependent not only on the hydrogen ion concentration, but also on the complexing
power of the anions of the particular acid. Examples of experimental values of the
constant Kc and fraction of Np(V) in very weakly complexing perchloric acid and
moderately complexing nitric acid environment are in Table 3.
Table 3 – Variation of the apparent equilibrium constants of Np(V) disproportionation in
HNO3 and HClO4 (data from Escure et al., 1971 [47])
Kc = concentration constant, Acid concentration (M)
RNp(V) = Np(V) fraction 5.5 6.0 6.5 7.0 7.5 8.0
Kc(HNO3) 2.55 7.0 18.0 50 130 350
Kc(HClO4) 0.02 0.09 0.4 0.8 8 35
RNp(V) (HNO3) 24% 16% 11% 7% 4% 3%
RNp(V) (HClO4) 78% 63% 44% 36% 15% 8%
These results would indicate that the complexing nature of nitric acid would lead to a
progressive disproportionation of neptunium(V) and a significant portion of tetravalent
neptunium should be present in multimolar nitric acid. This is, however, not the case due
to the fact that the rate of the disproportionation reaction is very slow. The forward
reaction (35) was found by Koltunov and Tikhonov [48] to obey the following rate law:
2 2[ ( )]
2 [ ] [ ( )]
d Np V
k H Np V
dt
(38)
49. 28
The value of the rate constant was determined in 2.1 - 4 M HNO3 to be k = 1.9×10³
M3
s1
at 90°C [48], along with the value of the activation energy of Ea = 68.6 kJ/mol [48]. The
reasons for the low rate of the reaction is that the conversion of Np(V) to Np(IV) requires
the breaking of the very stable oxygen bonds in the neptunyl molecular ion. This results
in a relatively high activation barrier, so that the rate at temperature of 25°C in < 4M
HNO3 the rate of the disproportionation can therefore be considered negligible.
The redox chemistry of neptunium in nitric acid is therefore determined by an entirely
different reaction, which is the oxidation of Np(V) by HNO3 [47]:
2. 2
2 3 2 2 22 3 2
catal HNO
NpO NO H NpO HNO H O , (39)
which has been labeled as one of the most complicated and troublesome reactions in the
PUREX process [17]. As is indicated above, this reaction is autocatalytic – i.e. the
product of the reaction – nitrous acid – catalyzes the oxidation of Np(V) by nitric acid.
Eventually an equilibrium is established when HNO2 is produced in high enough
concentration to shift the equilibrium back to the left. The thermodynamic equilibrium
constant (in terms of activities) is given by the equation:
2
2 2 2
2 3
3
NpO HNO H O
NpO H NO
a a a
K
a a a
(40)
However, the authors who studied the equilibrium have generally arranged their findings
in terms of the apparent concentration constant, which is calculated from the total
analytical concentration of nitric acid [HNO3]t as:
2
2
3
[ ][ ( )]
[ ( )] [ ]
app
t
HNONp VI
K
Np V HNO
(41)
As can be seen in the summary of the results of past studies of the reaction in [17], there
is not a very good agreement on the value of the apparent equilibrium constant Kapp,
which was also found to change with nitric acid concentrations in most studies. Most
authors agree that the large variation in the values is caused by the significant changes of
the values of activity coefficients with the increase of nitric acid concentration.
50. 29
Table 4 – Equilibrium data reported on the oxidation of Np(V) by nitric acid
Reference Kapp, 10-4
M-1.5
Experimental conditions*
Siddal & Dukes, 1959 [49] 5.2 ± 1.2 2.0 – 3.5 M HNO3, 24.5°C, distr.
Swanson, 1969 [50] 9.7 ± 4.2 2.0 – 4.7 M HNO3, 24°C, spec.
Gourisse, 1971 [51] 5.9 ± 2.7 1.0 – 3.9 M HNO3, 24°C, distr.
Shilin & Nazarov,1973 [52] 5.2 / 7.2 2 – 3 M HNO3, 20 / 30°C, , spec.
Tochiyama et al.,1995 [53] 21.0 ± 11.0 3.0 – 6.0 M HNO3, 25°C, distr.
* distr. – distribution, spec. – spectrophotometry
The last published study of the reaction by Tochiyama et al. [53] was probably the most
thorough, going to great lengths to compensate for most of the effects of changing ionic
strength µ and of the changing distribution coefficients of both nitric and nitrous acid.
They summarized their data in a practical empirical expression of the dependence of Kapp
on nitric acid concentration:
2
3 3 3log 2.77 0.01121[ ] 0.4074[ ] 0.7187 [ ]appK HNO HNO HNO (42)
Using known values of Kapp and by modifying the equation (41), the fraction of
pentavalent neptunium in total neptunium RNp(V) can be then calculated from known
analytical concentrations of HNO3 and HNO2:
( ) 2
3
2
[ ( )] 1 1
[ ( )] [ ][ ( )] [ ( )] 1 1
[ ( )] [ ]
Np V
t
app
Np V
R
Np VI HNONp V Np VI
K
Np V HNO
(43)
The results of these calculations reveal the paramount importance of nitrous acid on
neptunium redox speciation in multimolar nitric acid. As is evident from Figure 5 below,
where the values of the Np(V) fraction have been calculated, even minor equilibrium
concentrations of approximately 1mM HNO2 stabilize more than 50% of Np in its
pentavalent form in 4 M and lower concentrations of nitric acid.