LSSC2011 Optimization of intermolecular interaction potential energy paramete...
PCA-CompChem_seminar
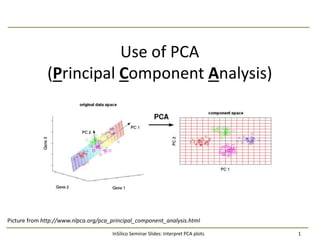
1. Use of PCA
(Principal Component Analysis)
1InSilico Seminar Slides: Interpret PCA plots
Picture from http://www.nlpca.org/pca_principal_component_analysis.html
2. General information on PCA
2InSilico Seminar Slides: Interpret PCA plots
X
E
(Noise)
P1
P2
∙
∙
P (Loading Matrix)
Data Matrix T (Scoring Matrix)
t1 t2 ∙ ∙ ∙
Approximation of data matrix, X = TP + E
General steps of PCA :
* Pretreatment of data: scaling
* Calculate Covariance / Correlation matrix
* Calculate eigen values and eigen vector
(PC1,PC2,… which constitutes loading matrix)
* Calculate scores, [X][PT]-1= [T]
λ1
λ2
Q1
PC1
PC2
Q2
• PC2 is orthogonal to PC1
• Eigen value (λ1 and λ2 ) decide the length of
the major and minor axes of the ellipse
• Q1 (slope of major axis) : ratio of elements of
eigen vector of the corresponding high λ1
• Q2 (slope of minor axis): ratio of eigen vector
of the corresponding second high λ2
X1
X2
0
0
3. General information on PCA
3InSilico Seminar Slides: Interpret PCA plots
Generate few informative plots, suitable for data overview
PCA rotates the data points to capture maximum variability.
Use of PCA
Outlier
detection
Prediction
Classification
Variable
Selection
4. List of articles considered…
4InSilico Seminar Slides: Interpret PCA plots
Conformation Diversity
* Mapping the nucleotide and isoform-dependent structural and dynamical features of Ras proteins.
Structure (2008),16(6):885-896.
* The distinct conformational dynamics of K-Ras and H-Ras A59G. PLOS Computational Biology
(2010),6(9).
Explore Enzyme-Ligand Interactions
* Exploration of enzyme-ligand interactions in CYP2D6 & 3A4 homology models and crystal
structures using a novel computational approach. Journal of Chemical Information and Modeling
(2007), 47(3):1234-1247.
SAR of peptides
* Quantitative structure-activity relationship of peptides binding to the class II major
histocompatibility complex molecule Aq associated with autoimmune arthritis. Journal of
Medicinal Chemistry (2007), 50(9):2049-2059.
5. Conformational Diversity
Structure (2008),16(6):885-896 and PLOS Computational Biology (2010),6(9)
provide means to visualize the existence of
distinct conformational groupings.
5InSilico Seminar Slides: Interpret PCA plots
6. Conformational Diversity: Structural insight
Structure (2008),16(6):885-896 and PLOS Computational Biology (2010),6(9)
6InSilico Seminar Slides: Interpret PCA plots
GTPase H-Ras : Conformational switches involved in
regulating cell division in response to growth factor
stimulation .
Experiment : To understand the conformational
transition between inactive GDP-bound and active GTP-
bound states.
Structural Insight :
Based on mutational study:
* magenta colored residues: associated with a large
number of cancers.
* brown colored residues : associated with various
cancers and developmental diseases.
Ras catalytic domain: composed of a six stranded central
β-sheet surrounded by five α-helices (bottom left).
Nucleotide binds to conserved phosphate- binding loop
(P-loop) shown as green in the figures.
Two switch loop regions (switch1, blue and switch2, red)
and loop 3 region colored orange are also highlighted in
the figures .
7. 7InSilico Seminar Slides: Interpret PCA plots
Conformational Diversity: PCA plot
Structure (2008),16(6):885-896 and PLOS Computational Biology (2010),6(9)
Inter-conformer analysis : 46 chains from
41 H-ras crystal structures which included
both GDP and GTP bound forms.
PCA was used to examine the major
conformational differences between
structures.
Covariance matrix : cartesian coordinates
of aligned Cα-atoms.
Over 57.4% variance was captured in two
dimensions (PC1 and PC2).
Figure (left) shows the relationship
between structures ( conformational
differences) captured by the first two PCs
(PC1 and PC2).
GDP
GTP
* Two major clusters are evident along PC1 corresponding to distinct GTP and GDP bound conformations
with an exception of PDB 6q21.
* The GTP/GTP-analog/ GDP structures which had mutations at the P-loop or switch regions were
situated out of GTP-cluster/ GDP-cluster.
8. 8InSilico Seminar Slides: Interpret PCA plots
The contribution of each residue to the first
three PCs is displayed in figure (left).
Ras catalytic domain, with displacements scaled
along the first PC (PC1) is shown in figure (top).
The height of each bar represents the relative
displacement of each residue.
* Dominant feature described by PC1: Displacement of the switch region.
* Dominant feature described by PC2 and PC3: Displacement of switch region, α3-β5 loop region and β2-β3
loop
Conformational Diversity: Analysis
Structure (2008),16(6):885-896 and PLOS Computational Biology (2010),6(9)
9. Enzyme-Ligand Interactions
Journal of Chemical Information and Modeling (2007), 47(3):1234-1247.
Separates protein structures on the basis of
the amino acids relevant for the interaction
with the ligand
9InSilico Seminar Slides: Interpret PCA plots
10. 10InSilico Seminar Slides: Interpret PCA plots
Enzyme-Ligand Interactions : Introduction
Journal of Chemical Information and Modeling (2007), 47(3):1234-1247.
Flow Chart of the Experiment Aim of the experiment:
* Compare homology model with crystal
structure.
* Identify the sites of interaction.
Area of focus:
Consensus PCA (CPCA) and PCA
performed on CYP3A4.
Data set:
* Four structures
• PDB without inhibitor : 1TQN & 1WOE
• PDB with inhibitor : 2J0D
(erythromycin)
• Homology model: J.Comput.-Aided
Mol. Des. (2000), 14:93-116
* Compounds for interaction study
• 25 compounds of opioid analgesics
• 15 well known CYP3A4 inhibitors
11. 11InSilico Seminar Slides: Interpret PCA plots
Probe Chemical group Used in
OH2 water CPCA/dockings
DRY hydrophobic CPCA/dockings
H neutral hydrogen dockings
N1
neutral flat NH
(e.g., amide)
CPCA/dockings
N1/2/3+ sp3
amine cation CPCA/dockings
N: sp3
N with lone pair dockings
O sp2
carbonyl oxygen CPCA/dockings
O- sp2
phenolate oxygen CPCA
O:: sp2
carboxy oxygen dockings
O1 alkyl hydroxy OH group dockings
OC1
aromatic/aliphatic
ether oxygen
dockings
Energy calculation
Identify amino acid
responsible for the
interaction with each probe
Accumulate all energy
values for each amino
acid and docking pose
Spreadsheet with
energy values
PCA
Enzyme-Ligand Interactions : PCA based workflow
Journal of Chemical Information and Modeling (2007), 47(3):1234-1247.
Grid probes used for calculation of
Molecular Interaction Fields (MIFs) in
CPCA & Dockings with GLUE
Flowchart over
Energy Calculation
Define atom types and
assign appropriate GRID
probes
Docking Pose
Docking pose filter: Those that were within 6Å
from any atom of the heme were selected.
12. 12InSilico Seminar Slides: Interpret PCA plots
Enzyme-Ligand Interactions : CPCA based workflow
Journal of Chemical Information and Modeling (2007), 47(3):1234-1247.
(X1,Y1,Z1) (Xi,Yi,Zi)
K grid points (variables)
Probe 1 Probe 2 Probe n∙ ∙ ∙ ∙ ∙
Block-2 (Target 2)
Block-1 (Target 1)
CPCA (Consensus PCA):
Two levels PCA (Block level
and super level)
Super-level: capture the
influence of each probe on the
whole model.
Super- level is a super weight
matrix, which gives the
partition of each probe on the
overall scores
Block-2 (Target 2)
Block-1 (Target 1)
Super-level: consensus of blocks
Block-level: PCA
Extract scoring matrix
Extract scoring matrix
PCA: combined scoring matrix
13. 13InSilico Seminar Slides: Interpret PCA plots
PCA results on energy calculations from dockings of
opioid analgesics in CYP3A4 homology model (▵)
and crystal structures 2j0d (gray □), 1tqn (▪), and
1woe (*). (a) PCA score plot; (b) PCA loading plot.
Enzyme-Ligand Interactions : PCA based analysis
Journal of Chemical Information and Modeling (2007), 47(3):1234-1247.
The score plot and loading plot are related…
* Variables that influence on an observation
are positioned in same place in the loading
plot as the observation in the score plot.
* But here we deal with negative energies, so
variables are positioned with same
coordinates but with opposite signs in
loading plot
Over PC1 of score plot: 1TQN and homology
model are best separated.
Most discriminative interactions (loading plot):
* Homology model: Phe304, Thr309 and heme
* 1TQN: Arg212, Phe215, Ala370 and Glu374
* 2J0D: Ser119 and Phe304
* 1WOE: No pronounced different interactions
compared to the other structures.
14. 14InSilico Seminar Slides: Interpret PCA plots
CPCA on all CYP3A4 structures based on
molecular interaction fields.
(a) Super-weights plot describing the
influence of the different probes.
(b) PCA score plot showing the inter-
correlation between the structures.
Interactions Homology
Ligand
complex
Ligand free
2J0D 1TQN 1WOE
Common
A305, E308, T309,R372 - -
- A370, M371 -
- - R212
L483 L483
I369 I369
- F108,F213
F304, E374, G481, L482
Uncommon
N104, R105,
V111, T310,
S312,V313,R372,
Heme
R106, F241,
G306, Y307,
L373
D76, I120,
D214, Q484
F215
Enzyme-Ligand Interactions : CPCA based analysis
Journal of Chemical Information and Modeling (2007), 47(3):1234-1247.
* Over PC2 of Super-weights plot: Hydrophobic probe (DRY)
differs from the rest
* Over PC1 of score plot: Homology is separated from crystal
structures.
* Over PC2 of score plot: Erythromycin bound structure(1J0D)
is separated from substrate free structures (1WOE and 1TQN)
15. SAR of peptides
Journal of Medicinal Chemistry (2007), 50(9):2049-2059.
Provides means to study molecular property
preferences for peptides binding to Aq
15InSilico Seminar Slides: Interpret PCA plots
16. 16InSilico Seminar Slides: Interpret PCA plots
SAR of peptides: Structural insight
Journal of Medicinal Chemistry (2007), 50(9):2049-2059.
Rheumatoid arthritis (RA), autoimmune
inflammatory disease is linked to major
histocompatibility complex (MHC) class II
molecules DR1 and DR4.
RA is directed against type-2 collagen(CII).
Animal model of RA: Collagen induced
arthritis (CIA) linked to mouse MHC class II
molecule Aq.
Octa-peptide (CII260-267) is required for
binding to Aq and induce T-cell response.
Peptide scaffold used to study molecular property preferences for peptide binding to Aq
Aqueous
solubility
17. 17InSilico Seminar Slides: Interpret PCA plots
SAR of peptides: Statistical Molecular Design (SMD)
Journal of Medicinal Chemistry (2007), 50(9):2049-2059.
Amino acids indicated in red (Met, Ala, Thr) and green (Val, Ser) were chosen as building blocks for the
variations at positions 1−3.
The building blocks in blue (Arg, Asn, Tyr, Asp) and green (Val, Ser) was used for positions 4 and 5.
: Size Descriptors
: Electronic property/ polarity Descriptors
: Lipophilicity Descriptors
: Solubility Descriptors
: Size/Polarity Descriptors
: Size/ Lipophilicity Descriptors
: H-Bonding Descriptors
: Shape & flexibility Descriptors
: Flexibility Descriptors
: Saturation Descriptors
* t1 to t3 principal components described 65% of the variation
* t1 separated amino acids(Aa) based on size: Gly & Ala have High score, while Arg & Try
have low score
* t2 separated based on lipophilicity and flexibility (similarly trend observed for t3)
* Three groups of Aa could be distinguished in the t1 vs t2 score plot.
Aromatic
Score (a) and loading plots (b) resulting from PCA of the 20 coded
amino acids described by 28 molecular descriptors.
18. 18InSilico Seminar Slides: Interpret PCA plots
Virtual library of 4500 peptides (53 X 62) : generated by varying the selected amino acids (Aa)
at five positions.
D-optimal design applied: to reduce the size of library to 22 peptides.
* Maximizing the volume spanned in the principal property space.
Principal property space:
* Each Aa at the five altered positions were represented by the three values of the scaled
principal property (t1 to t3)
* Each peptide is represented by 15 values which in turn represented the principal property
space for D-optimal design.
Peptide-1
Pos1-t1 Pos1-t2 Pos1-t3 ∙ ∙ ∙ ∙ ∙ ∙ ∙ ∙ ∙ ∙ ∙ Pos5-t1 Pos5-t2 Pos5-t3
Peptide-4500
∙
∙
Data matrix: 4500 rows X 15 columns
Scoring plot extracted for D-optimal design
SAR of peptides: Library design
Journal of Medicinal Chemistry (2007), 50(9):2049-2059.
19. 19InSilico Seminar Slides: Interpret PCA plots
SAR of peptides: Partial Least Square (PLS) model
Journal of Medicinal Chemistry (2007), 50(9):2049-2059.
Main contributors at position 1 & 2 :
* Small sized, rigid groups (positive
weights for t1-t3)
Main contributors at position 3:
* Flexible Hydrophobic preferred
(negative weights for t2 and t3)
Main contributors at position 4:
* Large sized, flexible groups. (t1 & t3
negatively correlated with the
response)
* H-bond donors/ acceptors preferred
(Positive weight for t2)
Main contributors at position 5:
* Large sized, flexible groups.(similar to
position 4)
* Hydrophobic preferred (negative
weight for t2)
PLS weight values (w × c) for the QSAR model based on 15
principal property values (t1−t3 at positions 1−5) and three
biological responses represented as % inhibition at three
different peptide concentrations (Y2: 250μM, Y3: 83μM,
Y4: 28μM).
Discrimination
t1: Size
t2: Hydrophilicity
t3: Rigidity
20. 20InSilico Seminar Slides: Interpret PCA plots
SAR of peptides: Scope of use
Journal of Medicinal Chemistry (2007), 50(9):2049-2059.
Scope of use: Lets discuss!
Protein sequence alignment: Nature Structural & Molecular Biology (1995), 2(2):171-178
PCA was used on multiple sequence alignments to identify possible functional residues.
Columns in the alignment : a vector of binary variables of length 20, which represented the
absence/presence of an amino acid at this position.
Small molecule statistical molecular design(SMD) based SAR analysis: Bioorganic & Medicinal
Chemistry (2010), 18(7):2686-2703.
Extracted PCA score vectors for different substitutions (i.e. Salicylic aldehydes and Hydrazides)
Performed Hierarchical –Partial Least square (Hi-PLS) model to interpret SAR
Softwares which could be used: R language, PanelCheck, Cimpl2, Codessa, Canvas
21. 21InSilico Seminar Slides: Interpret PCA plots
Take home message…
Use of PCA
* Discriminate the observations (e.g. active / inactive) based on the influence of different
variables (e.g. descriptors)
* Data reduction: visualize high dimensional data
* Generate informative plots
Limitation of PCA
* Assumes linear relationship between variables
* Requires preprocessing step
* Unsupervised method
Points to be cautious
* Relate both score and loading plots
• Observations with high score on a given PC (principal component) are positively
correlated with variables with high positive loading [ beware of variables with
negatively signed values (e.g. negative energies)]
Let your conscience be your guide: check your results with raw data

![General information on PCA
2InSilico Seminar Slides: Interpret PCA plots
X
E
(Noise)
P1
P2
∙
∙
P (Loading Matrix)
Data Matrix T (Scoring Matrix)
t1 t2 ∙ ∙ ∙
Approximation of data matrix, X = TP + E
General steps of PCA :
* Pretreatment of data: scaling
* Calculate Covariance / Correlation matrix
* Calculate eigen values and eigen vector
(PC1,PC2,… which constitutes loading matrix)
* Calculate scores, [X][PT]-1= [T]
λ1
λ2
Q1
PC1
PC2
Q2
• PC2 is orthogonal to PC1
• Eigen value (λ1 and λ2 ) decide the length of
the major and minor axes of the ellipse
• Q1 (slope of major axis) : ratio of elements of
eigen vector of the corresponding high λ1
• Q2 (slope of minor axis): ratio of eigen vector
of the corresponding second high λ2
X1
X2
0
0](data:image/gif;base64,R0lGODlhAQABAIAAAAAAAP///yH5BAEAAAAALAAAAAABAAEAAAIBRAA7)