SlideShare a Scribd company logo
1 of 23
Download to read offline
Overall
B.2. What was accomplished under these goals?
(to be converted to PDF; images are allowed)
Measuring success
● 131 publications citing NRNB grant in the reporting period
● Over 10,000 visits per week to Cytoscape.org
● 17,000 downloads per month for Cytoscape
● 3600 Cytoscape application launches per day
● 43,930 page views in January 2018 for the Cytoscape App Store
● 1000 downloads per day among 333 Cytoscape apps
● A total of 23 tools supported by NRNB
● 75 new and ongoing collaborations with external investigators on diverse topics
● 20 students trained through Google Summer of Code
● 8 NRNB coordinated training events in 7 locations in 4 countries
● Over 100 users trained on Cytoscape by NRNB staff
● 1,000 views in a typical week at tutorials.cytoscape.org
● 536 members in our Network Biology LinkedIn group
● 3,900 members on our moderated Google groups for Cytoscape
TRD 1: Differential Networks
● We have now developed a modeling framework for network inference to handle time
resolved data. We have used time resolved drug response measurements in melanoma
cells. The aim of this task was to improve the perturbation biology method (developed by
Nelander, Molinelli, and Korkut) for a more thorough understanding of protein networks
and their responses to drug perturbations.
● We continue to develop protein-protein interaction network alignment algorithms since
publishing “GreedyPlus: An Algorithm for the Alignment of Interface Interaction
Networks” in 2015, the first such algorithm for protein interaction networks that includes
binding site information. We have designed an interactome portal for their project at
http://interactome.baderlab.org/ that will include network alignment features.
● We continued development of the ​stringApp​ for Cytoscape by Dr. Morris. STRING
(http://www.string-db.org/) is an important public interaction database, widely regarded
by mass spec practitioners.
● The ​stringApp​ is incorporated into a new tutorial called “Functional Enrichment Analysis”.
Mass spectrometry practitioners and analysts routinely work with network models
constructed from fundamental interaction measurements.
● We revised the ​idmapper App ​to support automation and scriptibility. Automation is a
key new feature of the Cytoscape architecture in version 3.7. Idmapper served as an
early use case in adding command functionality to apps. The integration of identifier
mapping into Cytoscape as a built-in feature, for example, in addition to the ​stringApp
greatly enhances the user experience for mass spec practitioners as well as many other
users.
TRD 2: Descriptive to Predictive Networks
● We demonstrate the features of the netDx framework by integrating up to six
heterogeneous data types, including clinical variables, DNA methylation, somatic
mutations, mRNA, miRNA and protein expression profiles, for survival prediction in
kidney, lung, ovarian and brain cancer.
● We have made some preliminary progress on the network-constrained regression
methodology during this reporting period. Our starting point is the recently published
GELnet method. Using the GELnet method, we analyzed the Sanger GDSC
pharmacogenomic data for 1080 cell lines across 42 tumor classifications, including:
transcript expression, mutation, and drug response profiling on 297 compounds. The
overall goal of this project is the identification of biomarkers involved in the progression
of cancer and the response to pharmaceutical treatment.
● Using a newly constructed Evolutionarily Selected Pathways Map, we analyzed the
major cancer genome atlases to derive a hierarchical classification of tumor subtypes
linked to characteristic mutated pathways. The resulting new stratification of tumors
corresponded only weakly to known clinical subtypes and variables, or not at all,
suggesting new disease subtypes and pathways worthy of further investigation​.
● We built DCell, an interpretable neural network (VNN) simulating a basic eukaryotic cell.
The structure of this model is formulated from extensive prior knowledge of the cell’s
hierarchy of subsystems documented for the budding yeast Saccharomyces cerevisiae.
● We prepared the first automation workflow example: Advanced Cancer Networks and
Data. We then prepared a workshop around this example and have directly presented it
to over 100 users during across 4 events during this reporting period.
TRD 3: Multiscale Networks
● We report the development of a software framework, the Data-driven Ontology Toolkit
(DDOT), which enables the construction and analysis of hierarchical models in a Python
package and their visualization in a web application. To demonstrate the ease of
computational modeling enabled by DDOT, we programmatically constructed a
compendium of data-driven gene ontologies that describe the mechanisms underlying
650 diseases.
● We used previous CliXO work to build a data-driven hierarchy supervised by the
topology of human curated resources and compared with human curated Gene Ontology
(GO). The resulting “baseline” hierarchy captured most of the conserved biological
processes and protein complexes.
● We developed an efficient parallel algorithm (“Ultra-fast CliXO ”) to accelerate the
construction of data driven ontology. The central idea of our approach is to replace all
data structures with matrices and re-formulize the original algorithmic framework as a
series of matrix operations.
● We have undertaken new research and development work to infer cell-cell interaction
networks with a focus on perfecting the workflow to take single cell RNA-seq data and
identify cell types, that can then be analyzed to predict intercellular interaction networks..
Driving Biological Projects
Current mapping of DBP and TRD projects for this reporting period. See the DBP Component
for more details.
New Working Group
During this reporting period, we made a special effort to launch ​Working Groups​ within the
NRNB organization to promote intra-collaboration. One burgeoning area of common interest,
relating to NRNB goals was Single Cell RNA-seq Analysis and Visualization. Gary Bader,
Scooter Morris and Alex Pico organized bi-monthly working group meetings, starting with a
survey of opportunities and needs. As we were developing a research strategy, Dr. Morris
identified a supplemental funding opportunity to cover a new postdoc and serve as other
support on a set of aims complementary to our NRNB effort. This is an excellent example of
NRNB catalyzing new, relevant projects in Network Biology. So, in this new component, we will
report on the aspects of the working group subproject ​not​ covered by the independent funding,
which will begin during the next reporting period.
A key component and NRNB relevance of this project will be the set of tools we will build and
contribute to the Cytoscape network analysis ecosystem, allowing researchers to leverage
dozens of analysis and visualization methods in single cell analysis pipeline. This includes the
development of a methods to group cells based on similarities in their transcriptional profiles
and effectively identify those groups​ by comparison with previously collected profiles with
"known" groups.
During our initial survey of the problem space, we noted the current standards in benchmarking
and evaluation of scRNA-seq protocols and statistical methods. The novel assignment of
biologically meaningful labels is clearly lacking and will require additional evaluation. Current
benchmarks involving known cell populations, e.g., as spike-ins, can be extended in our pipeline
benchmark to evaluate the functional labels assigned to the clusters. We rely on established
ontologies and cell fate maps to quantify the accuracy and sensitivity of the label assignments,
including the work of Jill Mesirov in our Collaboration Network to extend MSigDB with curated
cell type-specific signatures. Combining version control, immediate write access and
transparency, the evaluation of the functional label assignments will be an ongoing activity by
the research community, continually approaching consensus.
Evaluation of the utility of the system will leverage existing collaborations ongoing in the Bader
lab (e.g. scRNA-seq human liver samples from Dr. Ian McGilvray and Dr. Sonya MacParland,
mouse brain development) and with Dr. Morris’s scRNA-seq methods work with the DeRisi lab
at UCSF and Dr. Pico’s scRNA-seq analyses through the Gladstone Bioinformatics Core.
These ongoing collaborations will allow us to test algorithms as well as the user interfaces of the
overall system.
Training
The table below lists the events since our last annual report. Additional one- on-one training
requests are tracked as services in our CSP report.
Google Summer of Code
Accepted for our 10th year as a mentoring organization, we gathered ~60 project ideas and ~40
mentors for GSoC 2017. We had our largest and most successful years yet, with 20 or 21
enrolled students completing their projects. Once again, we prepared a Mentor Resource
Packet, a collection of resources designed to help mentors with recruiting students. The packet
includes tips on how and where to recruit, as well as ready-to-use slides, flyers and other
materials. In addition to the technical accomplishments and productivity of our students, we are
also proud of the many important aspects of diversity our students represent in the GSoC
program, including geographical, gender and academic. New this year, we prepared 5 Student
Profiles in interview-style format to highlight some of our best students.
Infrastructure
● We improved the availability, performance and robustness of our Kubernetes cluster by
adding sensors to restart failed services; implementing separate clusters for production,
staging and testing; and defining policies for promotion of services from one cluster to
the next.
● We also added common logging, tracing and metering functionality that can be
leveraged by all services, including both Diffusion and Cytoscape itself.
● We created the CXMate service framework supported by a continuous integration
pipeline comprising CircleCI, Github and Docker, which together automates service
deployment and release.
● We demonstrated and further developed CXMate, by first upgrading the Diffusion
(Python) service to use it, and then writing new services to perform network alignment
using the C++ based SANA algorithm, network format conversion (from CX to .png), and
image caching (for .png images).
● we continued our development and deployment of CyComponents (formerly CyWidgets)
to support the development of novel network biology web apps (e.g., HiView and DCell
in TRD 2.2 and 3.1).
● We migrated all 21 NRNB virtual machines to the VM cluster. Previously, they were
hosted on a 4 year old single processor Dell R420 server whose failure would have been
catastrophic.
● We also established a Jupyter notebook server as a VM (provisioned with 90GB and 4
cores).
● We made significant progress in fleshing out the features needed in Cytoscape from the
standpoint of usability, e.g., the user interface for setting user preferences and
configuration information has been reorganized and presented and graphics capabilities
were supplemented with more line stroking, arrowheads and geometric shapes to fully
support the requirements of pathway analysis.
● We have begun work on a new app called Legend Creator, which adds an additional
control panel to Cytoscape for determining which properties of the graph should be used
to generate the legend and then to create annotations of the graph to represent that
information. Although this is a secondary function of visualization software, it is an
essential part of a finished report, so users have been frustrated by having to manually
construct their legends in outside software and add it to their figures outside of
Cytoscape.
Additional Highlights
Cytoscape tutorials
In the past year, we have moved our tutorial content from our previous Open Tutorials site to
GitHub Pages reachable via ​tutorials.cytoscape.org​. Cytoscape tutorials allows NRNB to reach
our goal of providing tutorial support to a broad and diverse community. Currently, the site
includes tutorials mainly for users. In the past year, Cytoscape tutorials have been significantly
updated and are now built using the ​reveal.js​ presentation framework​, which enables easy
creation of attractive interactive slide decks using HTML. The tutorials and presentations are
modularized, making it easy to reuse content and extend content. See Training component for
more details.
Figure 1. Screenshot of the Cytoscape tutorials main page. Tutorials are organized into 4 main
categories: Data Visualization, Importing Data, Network Analysis, Exporting and Publishing.
Cytoscape automation training
We launched a new repository dedicated to promoting and collecting Cytoscape automation
training materials in the form of Python and R workflows:
https://github.com/cytoscape/cytoscape-automation
During this reporting period we added the following materials:
● Advanced: Cancer Networks and Data (R & Python)
● Basic: Fundamentals (R & Python)
● Basic: iGraph (R)
● Basic: Visual Styles (R)
● Basic: Feature Demos (Python)
● Challenge: PPI Network Pipeline (R) -- community contributed
● Challenge: Visualization of Cluster-Filtered Network (R) -- community contributed
● Challenge: Data Mining and Visualization (Python) -- community contributed
● Challenge: SBML Time Course Data (Python) -- community contributed
Cytoscape App Store
The maintenance of the site allows it to host over 333 apps (an 8% increase over last year)
developed by 563 different developers around the world and support ​Cytoscape users
downloading an average of 1,046 apps per day​ (a ​24% increase​ over the past 12 months). That
has accumulated to just over 1,100,000 total app downloads since the launch of the App Store.
The top 3 downloaded apps, ClueGO, BiNGO and CluePedia, have accumulated over 192,000
downloads combined.​ ​During the month of January 2018, the site received over 43,000 page
views.
F1000Research: Cytoscape App Channel
The F1000Research Cytoscape App Channel now has a total of 36 peer-reviewed articles and 3
posters, with 3 articles revised in the last year. NRNB staff are gearing up for another round as
guest editors in 2018 to attract a new bolus of app articles leveraging Cytoscape automation.
TRD 1: Differential Networks
B.2. What was accomplished under these goals?
(to be converted to PDF; images are allowed)
TRD 1.1: Tools for Inference of Differential Networks from
Protein States and Abundances Over Time
Background​: The aim of this task was to improve the perturbation biology method (developed
by Nelander, Molinelli, and Korkut) for a more thorough understanding of protein networks and
their responses to drug perturbations. The perturbation biology method involves inference of
quantitative signaling models from high throughput drug response data. In recent years, we
solved the network inference problem through implementation of a probabilistic statistical
physics algorithm called belief propagation (BP). In network inference, we also benefit from
pathway database extracted prior information to improve model accuracy. The network models
are based on coupled nonlinear ordinary differential equations that represent the temporal
changes to perturbations.
Equation 1​:
In Equation 1, ​x​μ​
i​ are the perturbed and/or measured variables, ​μ​, represent the perturbations,
w​ij​ quantifies the edge strength, ​α​i​ constant is the tendency of the system to return to the initial
state, and ​ε​i​ constant defines the dynamic range of each variable ​i​. The transfer function, ​Φ
ensures that each variable has a sigmoidal temporal behavior.
However, our earlier BP approach was developed for static data obtained at a single time-point,
and based steady state assumptions. We have therefore further developed the network
inference framework to be able to account for time resolved measurements.
Progress This Year:​ We have now developed a modeling framework for network inference to
handle time resolved data. We have used time resolved drug response measurements in
melanoma cells. The data contains protein measurements as well as phenotypic measurements
(cell death and cell growth) for 54 different drug combinations. To infer model parameters, we
have developed a framework in TensorFlow to solve the ODEs (Equation 1) and thereby find
the optimal values of the parameters (​w​ij​, ​α​i​, and ​ε​i​) by comparing model simulations with data
for all measured time points. TensorFlow uses automatic differentiation to compute the
gradients of the loss function efficiently, and therefore gives fast optimization with gradient
descent methods, even for large optimization problems. To handle overfitting, we used an L1
norm in the loss function, and thereby found networks with 200-300 edges between 136 nodes.
The network models was developed with the following steps:
1. We used leave-8-out cross-validation to confirm that the data was of high quality, and
that the modeling framework produced models with a predictive power. We thus divided
the data into a training set and a test set for each drug, where the test set consisted of
all combinations of a particular drug and all other drugs. The left out data was predicted
with good accuracy, as exemplified for one of the drugs (MEKi) in Figure 1.
2. The modeling framework was then used to create network models for all available data.
We ran the optimization in TensorFlow 10 times and calculated an average network out
of the networks that was produced (Figure 2). The average network was calculated from
the obtain mean value of each value of wij, and wegthed to how ofter the model was in
the network. The obtained average network reproduces known features for drug –
protein interactions (e.g. the node AKTi inhibitis the node AKT-S473) as well as protein –
protein interactions (e.g. the node MEK1/2-S217 activates the node ERK1/2-T202), and
also predicts new interactions that potentially can be experimentally tested.
Figures
Figure 1. Leave-8-out cross-validation. ​An example of the performance of the modeling
framework. MEKi is one of the drugs in the data, and Xi represent any of the other drugs. The
model was created using data for all drug combinations without MEKi, as well as data for MEKi
as a single drug. The left out combinations (MEKi + Xi) was predicted and compared to the
corresponding data for proteomic nodes (left) and phenotypic nodes (right). Colors represent the
drug combined with MEKi, as states in the legend. The same analysis was made for all drugs
(not shown). The Pearson correlation coefficient (corrcoef) shows a good agreement between
model simulations and left out data.
Figure 2. A resulting average network.​ A graphical representation of the average network
obtained from 10 models generated with the modeling framework. The thickness of an edge is
based on both the value of the parameter wij and how often the edge occur in the obtained
models. Blue nodes represent drug effects, pink nodes represent protein measurements, and
grey nodes represent phenotypic measurements.
TRD 1.2: Protein network alignment algorithm and viewer;
DBP 2: Vidal and Hill
TRD1, Differential networks Aim 2. As previously reported, we continue to develop
protein-protein interaction network alignment algorithms since publishing “GreedyPlus: An
Algorithm for the Alignment of Interface Interaction Networks” in 2015, the first such algorithm
for protein interaction networks that includes binding site information. This work has led us to
design a new technology for ortholog function assessment that simultaneously considers protein
and network evolution, ​but focused on two interacting proteins and their immediate interactors.
To support DBP 2 (Vidal and Hill) “Mapping the human interactome and its rewiring by disease
mutations”, we continue to engage in weekly discussions with the Vidal team to consult on the
analysis of their ongoing human interactome project, in particular where their work includes
differential network analysis and consideration of binding sites. ​We have designed an
interactome portal for their project at http://interactome.baderlab.org/ that will include network
alignment features.
TRD 1.3: Facilitating the interpretation of AP-MS data as
interaction networks
STRING app
This project to enable mass spec practitioners to perform network analysis is successfully
transitioning from Stage 3 to Stage 4, from deployment of public tools to promoting wide
adoption. As such, we report on major updates to the ​stringApp​, a major component of AP-MS
and other proteomics workflows as well as a concerted effort to build interactive tutorials and
example usage.
The major activity was the continued development of the ​stringApp​ for Cytoscape by Dr. Morris.
STRING (http://www.string-db.org/) is an important public interaction database, widely regarded
by mass spec practitioners. With input from both mass spec practitioners and the
developers/maintainers of the STRING database, Dr. Morris implemented the app to take full
advantage of all the unique aspects of STRING, as described in the NAR special database
issue for 2017 [3]. The ​stringApp​ has been downloaded over 7400 times since its original
release in December of 2015 and is freely available at the Cytoscape App Store:
http://apps.cytoscape.org/apps/stringapp​.
Figure 1. Screenshot of STITCH compound-protein network. ​This is the result of a query for
Coumadin (Warfarin®), a common blood thinner used to prevent thrombosis. Queries of
proteins or compounds are supported. The nodes in Cytoscape preserve the signature STRING
style with structures and glass bobble effects.
During this reporting period, Dr. Morris implemented critical support for STITCH as a fourth
query option in the ​stringApp​ (Figure 1). The STITCH database includes both physical
interactions and functional associations between chemical compounds and proteins
(http://stitch.embl.de). Now, in addition to ​protein​, ​PubMed​ and ​disease​ queries, Cytoscape
users can select ​STITCH: protein/compound query​ and interrogate the STITCH database for
protein-compound interactions. This new dimension of interactions allows researchers to
extend protein networks into compound space or build protein networks from a set of one or
more compounds. This nicely complements any network or protein interaction resource tools
already available in Cytoscape. It is particularly relevant to the growing demand and data deluge
for drug compound screens and metabolomics, which includes mass spectrometry practitioners.
Another feature added to the ​stringApp​ during this period is enrichment analysis. This was a
major step in the AP-MS protocol that once again required the installation and operation of a
separate app. Now, upon import of any network via the ​stringApp​ the user can choose to
perform enrichment analysis and obtain Gene Ontology terms and KEGG pathway results.
Enrichment results may be visualized as both a table and as charts on the nodes (Figure 2).
The ​stringApp​ provides a number of different chart types, as well as the ability to filter terms to
specific categories and to remove redundant terms (using Jaccard overlap). This is a valuable
addition to workflows that involve STRING, DISEASE, or STITCH networks.
Figure 2: Screenshot of ​stringApp​ enrichment results.​ This shows the results of performing
a DISEASE query for the top 10 proteins associated with Alzheimer’s disease. The enrichment
results have been filtered to show only the GO Process category and to remove redundant
terms. The “Split donut” chart (the default) has been used to show the enrichment of each
protein.
Identifier Mapper Core App
The Id-Mapper app performs a critical role in integrating disparate databases. Proteins and
compounds identified in AP-MS experiments are not generally labeled sufficiently for querying
external analysis, Our analysis of the protocol showed that a lot of complexity experienced in
mass spec analysis stems from identifier and terminology mismatch. Our experience has been
that each iteration of developing this workflow involves improvements to the id-mapper core
app. During this past year, the app was revised to support automation and scriptibility.
Automation is a key new feature of the Cytoscape architecture in version 3.7. Id-mapper served
as an early use case in adding command functionality to apps. Because this app is an
extension of the table browser subsystem, it serves as a forerunner for a series of features in
table processing, which is a key function in the near future following the roadmap of the project.
WikiPathways as Demonstration of Automation and New Network Search Bar
Another important improvement Cytoscape recently added to expedite workflows is the network
search bar. Most searches can now be queried directly in the network control panel, instead of
asking the user to find a menu to open a dialog to type a keyword. These seemingly minor
hurdles accumulate into a lot of extra work for users, and slow the performance of tasks. So it is
important that the software evolve to reduce repetitive tasks and expedite workflows. The
network search bar facilitates apps to perform enrichment of networks faster than the previous
solution of provide different control panels depending on the database being searched.
The current release of WikiPathways is among the first app to support commands and
automated execution. The app provides specific functionality for searching and importing from
the WikiPathways web resource. Now that the app can be controlled via CyREST, imports of
pathway networks can be scripted from a variety of languages, including R, Java and Python.
Promoting Wide Adoption
The ​stringApp​ is incorporated into a new tutorial called “Functional Enrichment Analysis”
(​https://cytoscape.github.io/cytoscape-tutorials/protocols/modules/functional-enrichment/#/​).
Mass spectrometry practitioners and analysts routinely work with network models constructed
from fundamental interaction measurements. The data inform the biomedical understanding of
host-pathogen interactions, signaling networks and network ​rewiring​ in cancer, to name a few
examples. This is a critical field of research with which to provide powerful and accessible
network visualization and analysis technology. This project component is aimed at making
specific improvements and implementing new features to Cytoscape to enhance its applicability
and adoption by mass spec community. The main objectives are to augment Cytoscape to
streamline the typical mass spec analysis pipeline and provide better access to public mass
spec data and annotation repositories relevant to researchers. This is relevant to mass spec
practitioners who want to view their interaction data in the context of other public interaction
data and other annotations. The integration of identifier mapping into Cytoscape as a built-in
feature, for example, in addition to the ​stringApp​ greatly enhances the user experience for mass
spec practitioners as well as many other users. See the before/after comparison of the steps
required in the published mass spec Nature Protocol. The simplification goes beyond app
integration and user interface work. For example, rather than requiring the user to explicitly
connect to a database source, the new tool automatically connects to existing web service
provided by BridgeDb. And rather than requiring the user to explicitly choose a source identifier
type, the new tool infers the identifier from the values extracted from the column indicated by the
user in the right click action that initiated the dialog. We also included better options, based on
prior experience using and training.
References
1. Morris, J.H.K., G.M.; Verschueren, E.; Johnson, J.R.; Cimermancic, P.; Greninger, A.L.;
Pico, A.R. Affinity Purification-Mass Spectrometry and Network Analysis to Understand Protein-
Protein Interactions. ​Nature Protocol ​(2014) 9, 2539-54.
2. Gao J, Zhang C, van Iersel M, et al. BridgeDb app: unifying identifier mapping services for
Cytoscape. F1000Research. 2014;3:148..
3. Szklarczyk D, Morris JH, Cook H, et al. The STRING database in 2017: quality-controlled
protein–protein association networks, made broadly accessible. Nucleic Acids Research.
2017;45(Database issue):D362-D368.
TRD 2: Descriptive to Predictive Networks
B.2. What was accomplished under these goals?
(to be converted to PDF; images are allowed)
TRD 2.1: Predicting clinical outcome using patient similarity
networks
Patient classification has widespread biomedical and clinical applications, including diagnosis,
prognosis, disease subtyping and treatment response prediction. A general purpose and
clinically relevant prediction algorithm should be accurate, generalizable, be able to integrate
diverse data types (e.g. clinical, genomic, metabolomic, imaging), handle sparse data, be
compatible with patient privacy protection systems and be intuitive to interpret. Last time, we
reported on the development of netDx (http://netdx.org/), a supervised patient classification
framework based on patient similarity networks that meets the above criteria. netDx models
input data as patient networks and uses the GeneMANIA machine learning algorithm that we
previously developed for network integration and feature selection. ​We demonstrate the
features of this framework by integrating up to six heterogeneous data types, including clinical
variables, DNA methylation, somatic mutations, mRNA, miRNA and protein expression profiles,
for survival prediction in kidney, lung, ovarian and brain cancer.​ We benchmarked netDx
performance as a machine-learning method by predicting binary survival in four tumour types.
netDx ranks at the top for two tumours and within the top 20th percentile for all four,
demonstrating consistently good performance and we continue to work on improving
performance. In comparison to traditional machine learning-based patient classifiers, netDx
results are more interpretable, visualizing the decision boundary in the context of patient
similarity space and identifying biological pathways and other features important for prediction.
By defining patient similarity using pathway-level gene expression, netDx identifies known
molecular correlates of poor survival in kidney cancer, and identifies potentially novel pathways
and biomarkers. Thus, netDx can serve both as a useful classifier and as a tool for discovery of
biological features characteristic of disease. An open-source R/Java implementation of netDx is
available along with sample files and automation workflows packaged as vignettes.
To support ​DBP 5​: Sage Bionetworks: Molecular stratification of colorectal cancer and DREAM
challenges, we have revisited all major DREAM challenges where data are available and where
the challenge experimental design is compatible with netDX’s classification engine (two class
classification). ​We have broadly searched for additional similar data to analyze as well.​ We will
report the results in a publication, such as the netDX paper.
TRD 2.2a: Predicting cellular response to perturbation w/
network-guided regression
Background:​ ​The overall goal of this project is the identification of biomarkers involved in the
progression of cancer and the response to pharmaceutical treatment. This goal is to
accomplished through the used for regression-based methods that subject to biological network
constraints so that biomarkers can be understood in the context of regulatory processes.
Current progress:​ ​ In conjunction with ​DBP 8​, ​we have made some preliminary progress on
the network-constrained regression methodology during this reporting period. Our starting point
is the recently published GELnet method.
Using the GELnet method, we analyzed the Sanger GDSC pharmacogenomic data for 1080 cell
lines across 42 tumor classifications, including: transcript expression, mutation, and drug
response profiling on 297 compounds. Transcript expression included information on 19,562
genes and gene-level summarized mutations for 16,532 genes. The network used was either 1)
the entire PC database (pcAll), covering 22 interaction databases, or 2) only the CORUM
protein complex database (pcCorum). We compared LASSO and GELNet regression
methodologies to understand the benefits of GELNet over the commonly used LASSO method.
Figure 1 summarizes our findings comparing the two methods. The LASSO models tends to
produce models that more accurately correlate with the observed drug response, but there
combinations of feature sets where the GELNet models outperform. For example, using
mutation information, the entirety of the Pathway Commons network, and starting set of genes
that includes 1) genes correlated with the response and 2) genes in genesets of interest.
In the example described above, what we find is that even though we find these models to be
more accurate, but they come with a limitation which is that tend to be larger than then
accompanying LASSO models. Understanding the properties of these models is ongoing.
Figure 1: ​Faceted visualization of input feature combinations for LASSO and GelNet models
(see Data section for term descriptions). A) Drug Response Correlations: In all cases of network
and feature set combinations, models developed with expression data resulted in sets of models
where the median correlation to drug response for the resulting LASSO models was higher than
GelNet models. This was similar to the case when mutation data was used except when the
entire Pathway Commons network was used regardless of feature set. Example drugs where
this was the case, included S-trityl-L-cysteine (mitotic progression inhibitor) and romedepsin
(histone deacetylase inhibitor). B) Feature Counts: In cases where mutation data produced
more numerically accurate models, these models tended to have larger feature counts.
TRD 2.2b: Predicting cellular response to perturbation w/
network-guided regression
Part I
The goal of this part is to identify important biomarkers involved in the progression of cancer
and the response to pharmaceutical treatment in the context of biological network constraints. A
very popular approach is heat diffusion, also called network propagation, by which individual
gene mutations in a tumor are diffused across the network. Such diffusion creates “hot” network
neighborhoods of genes proximal to mutated genes. This type approach could help to define
driver genes and potential drug targets for cancer therapy. They also allow patients to be
clustered into subtypes, because the neighborhoods, unlike individual genes, are commonly
mutated and thus provide a basis for grouping tumors. In this project we find that the informative
genes and pathways driving cancer pathogenesis and subtypes can be remarkably difficult to
identify in the presence of gene interactions irrelevant to cancer. We show that this problem can
be addressed by assembly of a focused Evolutionarily Selected Pathways Map (ESPmap), in
which all interactions are supported by both protein-protein binding and genetic epistasis during
somatic tumor evolution. Our approach creates stringent tumor-specific networks of biophysical
protein interactions, identified by signatures of epistatic selection during tumor evolution. Using
such newly constructed network, we analyzed the major cancer genome atlases to derive a
hierarchical classification of tumor subtypes linked to characteristic mutated pathways. The
resulting new stratification of tumors corresponded only weakly to known clinical subtypes and
variables, or not at all, ​suggesting new disease subtypes and pathways worthy of further
investigation​. These pathways are clinically prognostic and predictive, including the
TP53-AXIN-ARHGEF17 combination in liver and CYLC2-STK11-STK11IP in lung cancer, which
we validate in independent cohorts. Further investigation was carried out in a panel of liver and
lung cancer cell lines characterized in the Genomics of Drug Sensitivity in Cancer (GDSC)
dataset. We found the pathways we detected were associated with different types drug
response.
Part II
In this project, we built DCell, an interpretable neural network (VNN) simulating a basic
eukaryotic cell. The structure of this model is formulated from extensive prior knowledge of the
cell’s hierarchy of subsystems documented for the budding yeast Saccharomyces cerevisiae. It
is drawn from either of two sources: the Gene Ontology (GO), a literature-curated reference
database from which we extracted 2526 intracellular components, processes, and functions and
CliXO, an alternative ontology of similar size inferred from large-scale molecular datasets rather
than literature curation. Such hierarchies form a natural bridge from variations in genotype (at
the scale of nucleotides and genes) to variations in phenotype (at the scale of cells and
organisms).
The function of our new interpretable neural network is learned during a training phase, in which
perturbations to genes propagate through the hierarchy to impact parent subsystems that
contain them. This gives rise to functional changes in protein complexes, biological processes,
organelles and, ultimately, a predicted response at the level of cell growth phenotype. Unlike
standard neural network model, our interpretable neural network was tied to an extensive
hierarchy of internal biological subsystems with states that could be queried. This ‘visible’
aspect raises the possibility that our approaches could be used for in-silico studies of biological
mechanism, of which we focused on four major types: 1) Explaining a genotype-phenotype
association, 2) Prioritizing all important mechanisms in determination of phenotype overall, 3)
Characterization of the genetic logic implemented by a process, 4) Discovery of new biological
processes and states.
TRD 2.3: Cytoscape Apps for accessible network analysis of
genetic variant data
The initial work on this subproject was focused on surveying the current capabilities of
Cytoscape for visualizing genetic variant data and performing diffusion analysis and subnetwork
generation based on variant data. To this end, we prepared the first automation workflow
example: Advanced Cancer Networks and Data.
https://github.com/cytoscape/cytoscape-automation/blob/master/for-scripters/R/advanced-cance
r-networks-and-data-rcy3.Rmd
We then prepared a workshop around this example and have directly presented it to over 100
users during across 4 events during this reporting period (see Training). We will expand on
these materials as we implement new tools per the original timeline for this subproject.
TRD 3: Multiscale Networks
B.2. What was accomplished under these goals?
(to be converted to PDF; images are allowed)
TRD 3.1: Data-driven assembly & refinement of gene
ontologies from networks
We report the development of a software framework, the Data-driven Ontology Toolkit (DDOT),
which enables the construction and analysis of hierarchical models in a Python package and
their visualization in a web application. In contrast to existing tools for studying hierarchical
models and literature-curated ontologies, DDOT supports general hierarchies known as directed
acyclic graphs (instead of trees) and focuses on the analysis of data-driven structure (instead of
semantic relations by traditional ontology software).
To demonstrate the ease of computational modeling enabled by DDOT, we programmatically
constructed a compendium of data-driven gene ontologies that describe the mechanisms
underlying 650 diseases. These ontologies were based on two types of input data: a set of
known gene associations for each disease and a gene-gene similarity network based on several
‘omics datasets. By calling DDOT functions, the software pipeline was very concise, consisting
of 16 lines of code for loading input data and setting parameters and 8 lines for modeling in a
single Python script. For each disease, its ontology suggests an association with new genes as
well as new cellular subsystems, many of which are not found in the literature-curated Gene
Ontology. For example, we studied Fanconi Anemia (FA), a rare genetic disorder that is
associated with bone marrow failure, myeloid dysplasia, and increased cancer risk. The
resulting ontology consisted of 194 genes arranged in a hierarchy of 74 cellular subsystems,
which includes the known association with DNA repair pathways but also proposes a previously
unknown role of orthogonal subsystems such as splicing and telomere maintenance.
A major component of DDOT is the HiView web application, which provides an interactive
visualization of two major features of a data-driven ontology: (1) the hierarchical structure
relating genes and subsystems and (2) the data supporting the inference of each subsystem. To
provide the first feature, HiView allows the user to interactively zoom between more expansive
views of the entire hierarchy and more focused views of particular subsystems. It also provides
techniques for visualizing multi-parent and multi-children relations in ontologies. To provide the
second feature, HiView also visualizes the network of gene-gene interactions that were used to
support the inference of each subsystem in the ontology (​Figure 1​).
Figure 1. Screenshot of the HiView application to visualize ontologies (http://hiview.ucsd.edu)
TRD 3.2: Functionalized gene ontologies as a hierarchy of
functional prediction
Part I. We used previous CliXO work to build a data-driven hierarchy supervised by the topology
of human curated resources and compared with human curated Gene Ontology (GO). The
resulting “baseline” hierarchy captured most of the conserved biological processes and protein
complexes. As a starting point to study context dependent interactions, we integrated cell-line
specific PPIs measured by AP-MS (Krogan lab) into our model, and aimed to interpret these
interactions by comparing the iterated model to the baseline model. We are also working on
improving CliXO by optimizing it to produce significantly fewer false positive subsystems. The
resulting human data-driven ontology is much more robust and contains fewer false positive
subsystems in comparison to our previous version.
Part II. In this project, we developed an efficient parallel algorithm (“Ultra-fast CliXO ”) to
accelerate the construction of data driven ontology. The central idea of our approach is to
replace all data structures with matrices and re-formulize the original algorithmic framework as a
series of matrix operations. There are two major advantages of our re-formulization relating to
both hardware architecture and software developing cost: 1) Faster transfer of memory from
RAM to CPU/GPU; 2) “Embarrassingly parallel” computation. Experimental results validate that
the new implementation significantly outperforms original data driven ontology construction
algorithm under various settings. We achieved a practical 200-fold decrease in runtime when
applied to representative yeast and human molecular datasets. Importantly, each individual
component of the pipeline, including clique detection, clique growing, clique merging, as well as
the novel data structure for dynamic sparse matrices, can be extended for use in other
applications in the biological, physical and social sciences.
TRD 3.3: Bridging ligand-receptor networks to cell-cell
communication networks
As previously described, we have undertaken new research and development work to infer
cell-cell interaction networks. In particular, we have extensively used single cell RNA-seq data to
infer higher resolution cell-cell networks and have developed applications to cancer stem cell
biology and regenerative medicine (e.g. DBP 9), both areas where cell communication is
important for tumour or normal tissue development. ​Our main work in 2017 to continue this work
has been to focus on perfecting the workflow to take single cell RNA-seq data and identify cell
types, that can then be analyzed to predict intercellular interaction networks.
To support DBP 9: Engineering blood for regenerative medicine, we are continuing work to
automate our cell-cell interaction network inference pipeline.

More Related Content

What's hot

Technology R&D Theme 3: Multi-scale Network Representations
Technology R&D Theme 3: Multi-scale Network RepresentationsTechnology R&D Theme 3: Multi-scale Network Representations
Technology R&D Theme 3: Multi-scale Network RepresentationsAlexander Pico
 
NRNB Annual Report 2011
NRNB Annual Report 2011NRNB Annual Report 2011
NRNB Annual Report 2011Alexander Pico
 
NetBioSIG2012 chrisevelo
NetBioSIG2012 chriseveloNetBioSIG2012 chrisevelo
NetBioSIG2012 chriseveloAlexander Pico
 
Technology R&D Theme 2: From Descriptive to Predictive Networks
Technology R&D Theme 2: From Descriptive to Predictive NetworksTechnology R&D Theme 2: From Descriptive to Predictive Networks
Technology R&D Theme 2: From Descriptive to Predictive NetworksAlexander Pico
 
NetBioSIG2013-Talk Tijana Milenkovic
NetBioSIG2013-Talk Tijana MilenkovicNetBioSIG2013-Talk Tijana Milenkovic
NetBioSIG2013-Talk Tijana MilenkovicAlexander Pico
 
NetBioSIG2012 anyatsalenko-en-viz
NetBioSIG2012 anyatsalenko-en-vizNetBioSIG2012 anyatsalenko-en-viz
NetBioSIG2012 anyatsalenko-en-vizAlexander Pico
 
NetBioSIG2013-Talk Martina Kutmon
NetBioSIG2013-Talk Martina KutmonNetBioSIG2013-Talk Martina Kutmon
NetBioSIG2013-Talk Martina KutmonAlexander Pico
 
NetBioSIG2013-Talk Gang Su
NetBioSIG2013-Talk Gang SuNetBioSIG2013-Talk Gang Su
NetBioSIG2013-Talk Gang SuAlexander Pico
 
NetBioSIG2014-Talk by Tijana Milenkovic
NetBioSIG2014-Talk by Tijana MilenkovicNetBioSIG2014-Talk by Tijana Milenkovic
NetBioSIG2014-Talk by Tijana MilenkovicAlexander Pico
 
NetBioSIG2013-Talk Robin Haw
NetBioSIG2013-Talk Robin Haw NetBioSIG2013-Talk Robin Haw
NetBioSIG2013-Talk Robin Haw Alexander Pico
 
NetBioSIG2014-Talk by Hyunghoon Cho
NetBioSIG2014-Talk by Hyunghoon ChoNetBioSIG2014-Talk by Hyunghoon Cho
NetBioSIG2014-Talk by Hyunghoon ChoAlexander Pico
 
NetBioSIG2013-KEYNOTE Benno Schwikowski
NetBioSIG2013-KEYNOTE Benno SchwikowskiNetBioSIG2013-KEYNOTE Benno Schwikowski
NetBioSIG2013-KEYNOTE Benno SchwikowskiAlexander Pico
 
NetBioSIG2013-Talk Vuk Janjic
NetBioSIG2013-Talk Vuk JanjicNetBioSIG2013-Talk Vuk Janjic
NetBioSIG2013-Talk Vuk JanjicAlexander Pico
 
Community Finding with Applications on Phylogenetic Networks [Extended Abstract]
Community Finding with Applications on Phylogenetic Networks [Extended Abstract]Community Finding with Applications on Phylogenetic Networks [Extended Abstract]
Community Finding with Applications on Phylogenetic Networks [Extended Abstract]Luís Rita
 
NetBioSIG2012 ugurdogrusoz-cbio
NetBioSIG2012 ugurdogrusoz-cbioNetBioSIG2012 ugurdogrusoz-cbio
NetBioSIG2012 ugurdogrusoz-cbioAlexander Pico
 
Java tutorial: Programmatic Access to Molecular Interactions
Java tutorial: Programmatic Access to Molecular InteractionsJava tutorial: Programmatic Access to Molecular Interactions
Java tutorial: Programmatic Access to Molecular InteractionsRafael C. Jimenez
 
A genetic algorithm approach for predicting ribonucleic acid sequencing data ...
A genetic algorithm approach for predicting ribonucleic acid sequencing data ...A genetic algorithm approach for predicting ribonucleic acid sequencing data ...
A genetic algorithm approach for predicting ribonucleic acid sequencing data ...TELKOMNIKA JOURNAL
 
Network embedding in biomedical data science
Network embedding in biomedical data scienceNetwork embedding in biomedical data science
Network embedding in biomedical data scienceArindam Ghosh
 
Free webinar-introduction to bioinformatics - biologist-1
Free webinar-introduction to bioinformatics - biologist-1Free webinar-introduction to bioinformatics - biologist-1
Free webinar-introduction to bioinformatics - biologist-1Elia Brodsky
 
NetBioSIG2013-Talk David Amar
NetBioSIG2013-Talk David AmarNetBioSIG2013-Talk David Amar
NetBioSIG2013-Talk David AmarAlexander Pico
 

What's hot (20)

Technology R&D Theme 3: Multi-scale Network Representations
Technology R&D Theme 3: Multi-scale Network RepresentationsTechnology R&D Theme 3: Multi-scale Network Representations
Technology R&D Theme 3: Multi-scale Network Representations
 
NRNB Annual Report 2011
NRNB Annual Report 2011NRNB Annual Report 2011
NRNB Annual Report 2011
 
NetBioSIG2012 chrisevelo
NetBioSIG2012 chriseveloNetBioSIG2012 chrisevelo
NetBioSIG2012 chrisevelo
 
Technology R&D Theme 2: From Descriptive to Predictive Networks
Technology R&D Theme 2: From Descriptive to Predictive NetworksTechnology R&D Theme 2: From Descriptive to Predictive Networks
Technology R&D Theme 2: From Descriptive to Predictive Networks
 
NetBioSIG2013-Talk Tijana Milenkovic
NetBioSIG2013-Talk Tijana MilenkovicNetBioSIG2013-Talk Tijana Milenkovic
NetBioSIG2013-Talk Tijana Milenkovic
 
NetBioSIG2012 anyatsalenko-en-viz
NetBioSIG2012 anyatsalenko-en-vizNetBioSIG2012 anyatsalenko-en-viz
NetBioSIG2012 anyatsalenko-en-viz
 
NetBioSIG2013-Talk Martina Kutmon
NetBioSIG2013-Talk Martina KutmonNetBioSIG2013-Talk Martina Kutmon
NetBioSIG2013-Talk Martina Kutmon
 
NetBioSIG2013-Talk Gang Su
NetBioSIG2013-Talk Gang SuNetBioSIG2013-Talk Gang Su
NetBioSIG2013-Talk Gang Su
 
NetBioSIG2014-Talk by Tijana Milenkovic
NetBioSIG2014-Talk by Tijana MilenkovicNetBioSIG2014-Talk by Tijana Milenkovic
NetBioSIG2014-Talk by Tijana Milenkovic
 
NetBioSIG2013-Talk Robin Haw
NetBioSIG2013-Talk Robin Haw NetBioSIG2013-Talk Robin Haw
NetBioSIG2013-Talk Robin Haw
 
NetBioSIG2014-Talk by Hyunghoon Cho
NetBioSIG2014-Talk by Hyunghoon ChoNetBioSIG2014-Talk by Hyunghoon Cho
NetBioSIG2014-Talk by Hyunghoon Cho
 
NetBioSIG2013-KEYNOTE Benno Schwikowski
NetBioSIG2013-KEYNOTE Benno SchwikowskiNetBioSIG2013-KEYNOTE Benno Schwikowski
NetBioSIG2013-KEYNOTE Benno Schwikowski
 
NetBioSIG2013-Talk Vuk Janjic
NetBioSIG2013-Talk Vuk JanjicNetBioSIG2013-Talk Vuk Janjic
NetBioSIG2013-Talk Vuk Janjic
 
Community Finding with Applications on Phylogenetic Networks [Extended Abstract]
Community Finding with Applications on Phylogenetic Networks [Extended Abstract]Community Finding with Applications on Phylogenetic Networks [Extended Abstract]
Community Finding with Applications on Phylogenetic Networks [Extended Abstract]
 
NetBioSIG2012 ugurdogrusoz-cbio
NetBioSIG2012 ugurdogrusoz-cbioNetBioSIG2012 ugurdogrusoz-cbio
NetBioSIG2012 ugurdogrusoz-cbio
 
Java tutorial: Programmatic Access to Molecular Interactions
Java tutorial: Programmatic Access to Molecular InteractionsJava tutorial: Programmatic Access to Molecular Interactions
Java tutorial: Programmatic Access to Molecular Interactions
 
A genetic algorithm approach for predicting ribonucleic acid sequencing data ...
A genetic algorithm approach for predicting ribonucleic acid sequencing data ...A genetic algorithm approach for predicting ribonucleic acid sequencing data ...
A genetic algorithm approach for predicting ribonucleic acid sequencing data ...
 
Network embedding in biomedical data science
Network embedding in biomedical data scienceNetwork embedding in biomedical data science
Network embedding in biomedical data science
 
Free webinar-introduction to bioinformatics - biologist-1
Free webinar-introduction to bioinformatics - biologist-1Free webinar-introduction to bioinformatics - biologist-1
Free webinar-introduction to bioinformatics - biologist-1
 
NetBioSIG2013-Talk David Amar
NetBioSIG2013-Talk David AmarNetBioSIG2013-Talk David Amar
NetBioSIG2013-Talk David Amar
 

Similar to NRNB Annual Report 2018

Adelaide Rhodes Resume March 2023
Adelaide Rhodes Resume March 2023Adelaide Rhodes Resume March 2023
Adelaide Rhodes Resume March 2023Stacy Taylor
 
On Using Network Science in Mining Developers Collaboration in Software Engin...
On Using Network Science in Mining Developers Collaboration in Software Engin...On Using Network Science in Mining Developers Collaboration in Software Engin...
On Using Network Science in Mining Developers Collaboration in Software Engin...IJDKP
 
2015 GU-ICBI Poster (third printing)
2015 GU-ICBI Poster (third printing)2015 GU-ICBI Poster (third printing)
2015 GU-ICBI Poster (third printing)Michael Atkins
 
Turning data into knowledge the impacts of bioinformatics
Turning data into knowledge  the impacts of bioinformaticsTurning data into knowledge  the impacts of bioinformatics
Turning data into knowledge the impacts of bioinformaticsICRISAT
 
FedCentric_Presentation
FedCentric_PresentationFedCentric_Presentation
FedCentric_PresentationYatpang Cheung
 
Towards enhancing the user experience of ChIP-Seq data analysis web tools
Towards enhancing the user experience of ChIP-Seq data  analysis web toolsTowards enhancing the user experience of ChIP-Seq data  analysis web tools
Towards enhancing the user experience of ChIP-Seq data analysis web toolsIJECEIAES
 
Kuchinsky_Cytoscape_BOSC2009
Kuchinsky_Cytoscape_BOSC2009Kuchinsky_Cytoscape_BOSC2009
Kuchinsky_Cytoscape_BOSC2009bosc
 
Bioinformatics-R program의 실례
Bioinformatics-R program의 실례Bioinformatics-R program의 실례
Bioinformatics-R program의 실례mothersafe
 
From data to knowledge – the Ondex System for integrating Life Sciences data ...
From data to knowledge – the Ondex System for integrating Life Sciences data ...From data to knowledge – the Ondex System for integrating Life Sciences data ...
From data to knowledge – the Ondex System for integrating Life Sciences data ...Catherine Canevet
 
IRJET- Predicting Social Network Communities Structure Changes and Detection ...
IRJET- Predicting Social Network Communities Structure Changes and Detection ...IRJET- Predicting Social Network Communities Structure Changes and Detection ...
IRJET- Predicting Social Network Communities Structure Changes and Detection ...IRJET Journal
 
V1_I1_2012_Paper5.doc
V1_I1_2012_Paper5.docV1_I1_2012_Paper5.doc
V1_I1_2012_Paper5.docpraveena06
 
GASCAN: A Novel Database for Gastric Cancer Genes and Primers
GASCAN: A Novel Database for Gastric Cancer Genes and PrimersGASCAN: A Novel Database for Gastric Cancer Genes and Primers
GASCAN: A Novel Database for Gastric Cancer Genes and Primersijdmtaiir
 
THE REACTION DATA ANALYSIS OFCOVID-19 VACCINATIONS
THE REACTION DATA ANALYSIS OFCOVID-19 VACCINATIONSTHE REACTION DATA ANALYSIS OFCOVID-19 VACCINATIONS
THE REACTION DATA ANALYSIS OFCOVID-19 VACCINATIONSManishReddy706923
 
Cao report 2007-2012
Cao report 2007-2012Cao report 2007-2012
Cao report 2007-2012Elif Ceylan
 
A VIVO VIEW OF CANCER RESEARCH: Dream, Vision and Reality
A VIVO VIEW OF CANCER RESEARCH: Dream, Vision and RealityA VIVO VIEW OF CANCER RESEARCH: Dream, Vision and Reality
A VIVO VIEW OF CANCER RESEARCH: Dream, Vision and Reality Paul Courtney
 

Similar to NRNB Annual Report 2018 (20)

Adelaide Rhodes Resume March 2023
Adelaide Rhodes Resume March 2023Adelaide Rhodes Resume March 2023
Adelaide Rhodes Resume March 2023
 
On Using Network Science in Mining Developers Collaboration in Software Engin...
On Using Network Science in Mining Developers Collaboration in Software Engin...On Using Network Science in Mining Developers Collaboration in Software Engin...
On Using Network Science in Mining Developers Collaboration in Software Engin...
 
On Using Network Science in Mining Developers Collaboration in Software Engin...
On Using Network Science in Mining Developers Collaboration in Software Engin...On Using Network Science in Mining Developers Collaboration in Software Engin...
On Using Network Science in Mining Developers Collaboration in Software Engin...
 
2015 GU-ICBI Poster (third printing)
2015 GU-ICBI Poster (third printing)2015 GU-ICBI Poster (third printing)
2015 GU-ICBI Poster (third printing)
 
Research-KS-Jun2015
Research-KS-Jun2015Research-KS-Jun2015
Research-KS-Jun2015
 
Turning data into knowledge the impacts of bioinformatics
Turning data into knowledge  the impacts of bioinformaticsTurning data into knowledge  the impacts of bioinformatics
Turning data into knowledge the impacts of bioinformatics
 
FedCentric_Presentation
FedCentric_PresentationFedCentric_Presentation
FedCentric_Presentation
 
Towards enhancing the user experience of ChIP-Seq data analysis web tools
Towards enhancing the user experience of ChIP-Seq data  analysis web toolsTowards enhancing the user experience of ChIP-Seq data  analysis web tools
Towards enhancing the user experience of ChIP-Seq data analysis web tools
 
Kuchinsky_Cytoscape_BOSC2009
Kuchinsky_Cytoscape_BOSC2009Kuchinsky_Cytoscape_BOSC2009
Kuchinsky_Cytoscape_BOSC2009
 
Poster (1)
Poster (1)Poster (1)
Poster (1)
 
Bioinformatics-R program의 실례
Bioinformatics-R program의 실례Bioinformatics-R program의 실례
Bioinformatics-R program의 실례
 
From data to knowledge – the Ondex System for integrating Life Sciences data ...
From data to knowledge – the Ondex System for integrating Life Sciences data ...From data to knowledge – the Ondex System for integrating Life Sciences data ...
From data to knowledge – the Ondex System for integrating Life Sciences data ...
 
IRJET- Predicting Social Network Communities Structure Changes and Detection ...
IRJET- Predicting Social Network Communities Structure Changes and Detection ...IRJET- Predicting Social Network Communities Structure Changes and Detection ...
IRJET- Predicting Social Network Communities Structure Changes and Detection ...
 
ReComp for genomics
ReComp for genomicsReComp for genomics
ReComp for genomics
 
V1_I1_2012_Paper5.doc
V1_I1_2012_Paper5.docV1_I1_2012_Paper5.doc
V1_I1_2012_Paper5.doc
 
LatentCross.pdf
LatentCross.pdfLatentCross.pdf
LatentCross.pdf
 
GASCAN: A Novel Database for Gastric Cancer Genes and Primers
GASCAN: A Novel Database for Gastric Cancer Genes and PrimersGASCAN: A Novel Database for Gastric Cancer Genes and Primers
GASCAN: A Novel Database for Gastric Cancer Genes and Primers
 
THE REACTION DATA ANALYSIS OFCOVID-19 VACCINATIONS
THE REACTION DATA ANALYSIS OFCOVID-19 VACCINATIONSTHE REACTION DATA ANALYSIS OFCOVID-19 VACCINATIONS
THE REACTION DATA ANALYSIS OFCOVID-19 VACCINATIONS
 
Cao report 2007-2012
Cao report 2007-2012Cao report 2007-2012
Cao report 2007-2012
 
A VIVO VIEW OF CANCER RESEARCH: Dream, Vision and Reality
A VIVO VIEW OF CANCER RESEARCH: Dream, Vision and RealityA VIVO VIEW OF CANCER RESEARCH: Dream, Vision and Reality
A VIVO VIEW OF CANCER RESEARCH: Dream, Vision and Reality
 

More from Alexander Pico

2016 Cytoscape 3.3 Tutorial
2016 Cytoscape 3.3 Tutorial2016 Cytoscape 3.3 Tutorial
2016 Cytoscape 3.3 TutorialAlexander Pico
 
2015 Cytoscape 3.2 Tutorial
2015 Cytoscape 3.2 Tutorial2015 Cytoscape 3.2 Tutorial
2015 Cytoscape 3.2 TutorialAlexander Pico
 
NetBioSIG2014-FlashJournalClub by Frank Kramer
NetBioSIG2014-FlashJournalClub by Frank KramerNetBioSIG2014-FlashJournalClub by Frank Kramer
NetBioSIG2014-FlashJournalClub by Frank KramerAlexander Pico
 
NetBioSIG2014-Talk by Salvatore Loguercio
NetBioSIG2014-Talk by Salvatore LoguercioNetBioSIG2014-Talk by Salvatore Loguercio
NetBioSIG2014-Talk by Salvatore LoguercioAlexander Pico
 
NetBioSIG2014-Intro by Alex Pico
NetBioSIG2014-Intro by Alex PicoNetBioSIG2014-Intro by Alex Pico
NetBioSIG2014-Intro by Alex PicoAlexander Pico
 
NetBioSIG2014-Talk by Traver Hart
NetBioSIG2014-Talk by Traver HartNetBioSIG2014-Talk by Traver Hart
NetBioSIG2014-Talk by Traver HartAlexander Pico
 
NetBioSIG2014-Talk by Yu Xia
NetBioSIG2014-Talk by Yu XiaNetBioSIG2014-Talk by Yu Xia
NetBioSIG2014-Talk by Yu XiaAlexander Pico
 
NetBioSIG2014-Keynote by Marian Walhout
NetBioSIG2014-Keynote by Marian WalhoutNetBioSIG2014-Keynote by Marian Walhout
NetBioSIG2014-Keynote by Marian WalhoutAlexander Pico
 
NetBioSIG2014-Talk by Ashwini Patil
NetBioSIG2014-Talk by Ashwini PatilNetBioSIG2014-Talk by Ashwini Patil
NetBioSIG2014-Talk by Ashwini PatilAlexander Pico
 
NetBioSIG2014-Talk by David Amar
NetBioSIG2014-Talk by David AmarNetBioSIG2014-Talk by David Amar
NetBioSIG2014-Talk by David AmarAlexander Pico
 
NetBioSIG2014-Talk by Gerald Quon
NetBioSIG2014-Talk by Gerald QuonNetBioSIG2014-Talk by Gerald Quon
NetBioSIG2014-Talk by Gerald QuonAlexander Pico
 
Visualization and Analysis of Dynamic Networks
Visualization and Analysis of Dynamic Networks Visualization and Analysis of Dynamic Networks
Visualization and Analysis of Dynamic Networks Alexander Pico
 
Introduction to WikiPathways
Introduction to WikiPathwaysIntroduction to WikiPathways
Introduction to WikiPathwaysAlexander Pico
 
Network Visualization and Analysis with Cytoscape
Network Visualization and Analysis with CytoscapeNetwork Visualization and Analysis with Cytoscape
Network Visualization and Analysis with CytoscapeAlexander Pico
 
NetBioSIG2013-KEYNOTE Michael Schroeder
NetBioSIG2013-KEYNOTE Michael SchroederNetBioSIG2013-KEYNOTE Michael Schroeder
NetBioSIG2013-KEYNOTE Michael SchroederAlexander Pico
 
NetBioSIG2013-KEYNOTE Stefan Schuster
NetBioSIG2013-KEYNOTE Stefan SchusterNetBioSIG2013-KEYNOTE Stefan Schuster
NetBioSIG2013-KEYNOTE Stefan SchusterAlexander Pico
 
NetBioSIG2013-KEYNOTE Esti Yeger-Lotem
NetBioSIG2013-KEYNOTE Esti Yeger-LotemNetBioSIG2013-KEYNOTE Esti Yeger-Lotem
NetBioSIG2013-KEYNOTE Esti Yeger-LotemAlexander Pico
 

More from Alexander Pico (17)

2016 Cytoscape 3.3 Tutorial
2016 Cytoscape 3.3 Tutorial2016 Cytoscape 3.3 Tutorial
2016 Cytoscape 3.3 Tutorial
 
2015 Cytoscape 3.2 Tutorial
2015 Cytoscape 3.2 Tutorial2015 Cytoscape 3.2 Tutorial
2015 Cytoscape 3.2 Tutorial
 
NetBioSIG2014-FlashJournalClub by Frank Kramer
NetBioSIG2014-FlashJournalClub by Frank KramerNetBioSIG2014-FlashJournalClub by Frank Kramer
NetBioSIG2014-FlashJournalClub by Frank Kramer
 
NetBioSIG2014-Talk by Salvatore Loguercio
NetBioSIG2014-Talk by Salvatore LoguercioNetBioSIG2014-Talk by Salvatore Loguercio
NetBioSIG2014-Talk by Salvatore Loguercio
 
NetBioSIG2014-Intro by Alex Pico
NetBioSIG2014-Intro by Alex PicoNetBioSIG2014-Intro by Alex Pico
NetBioSIG2014-Intro by Alex Pico
 
NetBioSIG2014-Talk by Traver Hart
NetBioSIG2014-Talk by Traver HartNetBioSIG2014-Talk by Traver Hart
NetBioSIG2014-Talk by Traver Hart
 
NetBioSIG2014-Talk by Yu Xia
NetBioSIG2014-Talk by Yu XiaNetBioSIG2014-Talk by Yu Xia
NetBioSIG2014-Talk by Yu Xia
 
NetBioSIG2014-Keynote by Marian Walhout
NetBioSIG2014-Keynote by Marian WalhoutNetBioSIG2014-Keynote by Marian Walhout
NetBioSIG2014-Keynote by Marian Walhout
 
NetBioSIG2014-Talk by Ashwini Patil
NetBioSIG2014-Talk by Ashwini PatilNetBioSIG2014-Talk by Ashwini Patil
NetBioSIG2014-Talk by Ashwini Patil
 
NetBioSIG2014-Talk by David Amar
NetBioSIG2014-Talk by David AmarNetBioSIG2014-Talk by David Amar
NetBioSIG2014-Talk by David Amar
 
NetBioSIG2014-Talk by Gerald Quon
NetBioSIG2014-Talk by Gerald QuonNetBioSIG2014-Talk by Gerald Quon
NetBioSIG2014-Talk by Gerald Quon
 
Visualization and Analysis of Dynamic Networks
Visualization and Analysis of Dynamic Networks Visualization and Analysis of Dynamic Networks
Visualization and Analysis of Dynamic Networks
 
Introduction to WikiPathways
Introduction to WikiPathwaysIntroduction to WikiPathways
Introduction to WikiPathways
 
Network Visualization and Analysis with Cytoscape
Network Visualization and Analysis with CytoscapeNetwork Visualization and Analysis with Cytoscape
Network Visualization and Analysis with Cytoscape
 
NetBioSIG2013-KEYNOTE Michael Schroeder
NetBioSIG2013-KEYNOTE Michael SchroederNetBioSIG2013-KEYNOTE Michael Schroeder
NetBioSIG2013-KEYNOTE Michael Schroeder
 
NetBioSIG2013-KEYNOTE Stefan Schuster
NetBioSIG2013-KEYNOTE Stefan SchusterNetBioSIG2013-KEYNOTE Stefan Schuster
NetBioSIG2013-KEYNOTE Stefan Schuster
 
NetBioSIG2013-KEYNOTE Esti Yeger-Lotem
NetBioSIG2013-KEYNOTE Esti Yeger-LotemNetBioSIG2013-KEYNOTE Esti Yeger-Lotem
NetBioSIG2013-KEYNOTE Esti Yeger-Lotem
 

Recently uploaded

G9 Science Q4- Week 1-2 Projectile Motion.ppt
G9 Science Q4- Week 1-2 Projectile Motion.pptG9 Science Q4- Week 1-2 Projectile Motion.ppt
G9 Science Q4- Week 1-2 Projectile Motion.pptMAESTRELLAMesa2
 
Biological Classification BioHack (3).pdf
Biological Classification BioHack (3).pdfBiological Classification BioHack (3).pdf
Biological Classification BioHack (3).pdfmuntazimhurra
 
Nanoparticles synthesis and characterization​ ​
Nanoparticles synthesis and characterization​  ​Nanoparticles synthesis and characterization​  ​
Nanoparticles synthesis and characterization​ ​kaibalyasahoo82800
 
Broad bean, Lima Bean, Jack bean, Ullucus.pptx
Broad bean, Lima Bean, Jack bean, Ullucus.pptxBroad bean, Lima Bean, Jack bean, Ullucus.pptx
Broad bean, Lima Bean, Jack bean, Ullucus.pptxjana861314
 
Biopesticide (2).pptx .This slides helps to know the different types of biop...
Biopesticide (2).pptx  .This slides helps to know the different types of biop...Biopesticide (2).pptx  .This slides helps to know the different types of biop...
Biopesticide (2).pptx .This slides helps to know the different types of biop...RohitNehra6
 
Disentangling the origin of chemical differences using GHOST
Disentangling the origin of chemical differences using GHOSTDisentangling the origin of chemical differences using GHOST
Disentangling the origin of chemical differences using GHOSTSérgio Sacani
 
Grafana in space: Monitoring Japan's SLIM moon lander in real time
Grafana in space: Monitoring Japan's SLIM moon lander  in real timeGrafana in space: Monitoring Japan's SLIM moon lander  in real time
Grafana in space: Monitoring Japan's SLIM moon lander in real timeSatoshi NAKAHIRA
 
Botany 4th semester file By Sumit Kumar yadav.pdf
Botany 4th semester file By Sumit Kumar yadav.pdfBotany 4th semester file By Sumit Kumar yadav.pdf
Botany 4th semester file By Sumit Kumar yadav.pdfSumit Kumar yadav
 
Zoology 4th semester series (krishna).pdf
Zoology 4th semester series (krishna).pdfZoology 4th semester series (krishna).pdf
Zoology 4th semester series (krishna).pdfSumit Kumar yadav
 
GFP in rDNA Technology (Biotechnology).pptx
GFP in rDNA Technology (Biotechnology).pptxGFP in rDNA Technology (Biotechnology).pptx
GFP in rDNA Technology (Biotechnology).pptxAleenaTreesaSaji
 
PossibleEoarcheanRecordsoftheGeomagneticFieldPreservedintheIsuaSupracrustalBe...
PossibleEoarcheanRecordsoftheGeomagneticFieldPreservedintheIsuaSupracrustalBe...PossibleEoarcheanRecordsoftheGeomagneticFieldPreservedintheIsuaSupracrustalBe...
PossibleEoarcheanRecordsoftheGeomagneticFieldPreservedintheIsuaSupracrustalBe...Sérgio Sacani
 
Pests of cotton_Sucking_Pests_Dr.UPR.pdf
Pests of cotton_Sucking_Pests_Dr.UPR.pdfPests of cotton_Sucking_Pests_Dr.UPR.pdf
Pests of cotton_Sucking_Pests_Dr.UPR.pdfPirithiRaju
 
TEST BANK For Radiologic Science for Technologists, 12th Edition by Stewart C...
TEST BANK For Radiologic Science for Technologists, 12th Edition by Stewart C...TEST BANK For Radiologic Science for Technologists, 12th Edition by Stewart C...
TEST BANK For Radiologic Science for Technologists, 12th Edition by Stewart C...ssifa0344
 
Botany 4th semester series (krishna).pdf
Botany 4th semester series (krishna).pdfBotany 4th semester series (krishna).pdf
Botany 4th semester series (krishna).pdfSumit Kumar yadav
 
CALL ON ➥8923113531 🔝Call Girls Kesar Bagh Lucknow best Night Fun service 🪡
CALL ON ➥8923113531 🔝Call Girls Kesar Bagh Lucknow best Night Fun service  🪡CALL ON ➥8923113531 🔝Call Girls Kesar Bagh Lucknow best Night Fun service  🪡
CALL ON ➥8923113531 🔝Call Girls Kesar Bagh Lucknow best Night Fun service 🪡anilsa9823
 
SOLUBLE PATTERN RECOGNITION RECEPTORS.pptx
SOLUBLE PATTERN RECOGNITION RECEPTORS.pptxSOLUBLE PATTERN RECOGNITION RECEPTORS.pptx
SOLUBLE PATTERN RECOGNITION RECEPTORS.pptxkessiyaTpeter
 
Presentation Vikram Lander by Vedansh Gupta.pptx
Presentation Vikram Lander by Vedansh Gupta.pptxPresentation Vikram Lander by Vedansh Gupta.pptx
Presentation Vikram Lander by Vedansh Gupta.pptxgindu3009
 
Discovery of an Accretion Streamer and a Slow Wide-angle Outflow around FUOri...
Discovery of an Accretion Streamer and a Slow Wide-angle Outflow around FUOri...Discovery of an Accretion Streamer and a Slow Wide-angle Outflow around FUOri...
Discovery of an Accretion Streamer and a Slow Wide-angle Outflow around FUOri...Sérgio Sacani
 
Hubble Asteroid Hunter III. Physical properties of newly found asteroids
Hubble Asteroid Hunter III. Physical properties of newly found asteroidsHubble Asteroid Hunter III. Physical properties of newly found asteroids
Hubble Asteroid Hunter III. Physical properties of newly found asteroidsSérgio Sacani
 

Recently uploaded (20)

G9 Science Q4- Week 1-2 Projectile Motion.ppt
G9 Science Q4- Week 1-2 Projectile Motion.pptG9 Science Q4- Week 1-2 Projectile Motion.ppt
G9 Science Q4- Week 1-2 Projectile Motion.ppt
 
Biological Classification BioHack (3).pdf
Biological Classification BioHack (3).pdfBiological Classification BioHack (3).pdf
Biological Classification BioHack (3).pdf
 
Nanoparticles synthesis and characterization​ ​
Nanoparticles synthesis and characterization​  ​Nanoparticles synthesis and characterization​  ​
Nanoparticles synthesis and characterization​ ​
 
Broad bean, Lima Bean, Jack bean, Ullucus.pptx
Broad bean, Lima Bean, Jack bean, Ullucus.pptxBroad bean, Lima Bean, Jack bean, Ullucus.pptx
Broad bean, Lima Bean, Jack bean, Ullucus.pptx
 
CELL -Structural and Functional unit of life.pdf
CELL -Structural and Functional unit of life.pdfCELL -Structural and Functional unit of life.pdf
CELL -Structural and Functional unit of life.pdf
 
Biopesticide (2).pptx .This slides helps to know the different types of biop...
Biopesticide (2).pptx  .This slides helps to know the different types of biop...Biopesticide (2).pptx  .This slides helps to know the different types of biop...
Biopesticide (2).pptx .This slides helps to know the different types of biop...
 
Disentangling the origin of chemical differences using GHOST
Disentangling the origin of chemical differences using GHOSTDisentangling the origin of chemical differences using GHOST
Disentangling the origin of chemical differences using GHOST
 
Grafana in space: Monitoring Japan's SLIM moon lander in real time
Grafana in space: Monitoring Japan's SLIM moon lander  in real timeGrafana in space: Monitoring Japan's SLIM moon lander  in real time
Grafana in space: Monitoring Japan's SLIM moon lander in real time
 
Botany 4th semester file By Sumit Kumar yadav.pdf
Botany 4th semester file By Sumit Kumar yadav.pdfBotany 4th semester file By Sumit Kumar yadav.pdf
Botany 4th semester file By Sumit Kumar yadav.pdf
 
Zoology 4th semester series (krishna).pdf
Zoology 4th semester series (krishna).pdfZoology 4th semester series (krishna).pdf
Zoology 4th semester series (krishna).pdf
 
GFP in rDNA Technology (Biotechnology).pptx
GFP in rDNA Technology (Biotechnology).pptxGFP in rDNA Technology (Biotechnology).pptx
GFP in rDNA Technology (Biotechnology).pptx
 
PossibleEoarcheanRecordsoftheGeomagneticFieldPreservedintheIsuaSupracrustalBe...
PossibleEoarcheanRecordsoftheGeomagneticFieldPreservedintheIsuaSupracrustalBe...PossibleEoarcheanRecordsoftheGeomagneticFieldPreservedintheIsuaSupracrustalBe...
PossibleEoarcheanRecordsoftheGeomagneticFieldPreservedintheIsuaSupracrustalBe...
 
Pests of cotton_Sucking_Pests_Dr.UPR.pdf
Pests of cotton_Sucking_Pests_Dr.UPR.pdfPests of cotton_Sucking_Pests_Dr.UPR.pdf
Pests of cotton_Sucking_Pests_Dr.UPR.pdf
 
TEST BANK For Radiologic Science for Technologists, 12th Edition by Stewart C...
TEST BANK For Radiologic Science for Technologists, 12th Edition by Stewart C...TEST BANK For Radiologic Science for Technologists, 12th Edition by Stewart C...
TEST BANK For Radiologic Science for Technologists, 12th Edition by Stewart C...
 
Botany 4th semester series (krishna).pdf
Botany 4th semester series (krishna).pdfBotany 4th semester series (krishna).pdf
Botany 4th semester series (krishna).pdf
 
CALL ON ➥8923113531 🔝Call Girls Kesar Bagh Lucknow best Night Fun service 🪡
CALL ON ➥8923113531 🔝Call Girls Kesar Bagh Lucknow best Night Fun service  🪡CALL ON ➥8923113531 🔝Call Girls Kesar Bagh Lucknow best Night Fun service  🪡
CALL ON ➥8923113531 🔝Call Girls Kesar Bagh Lucknow best Night Fun service 🪡
 
SOLUBLE PATTERN RECOGNITION RECEPTORS.pptx
SOLUBLE PATTERN RECOGNITION RECEPTORS.pptxSOLUBLE PATTERN RECOGNITION RECEPTORS.pptx
SOLUBLE PATTERN RECOGNITION RECEPTORS.pptx
 
Presentation Vikram Lander by Vedansh Gupta.pptx
Presentation Vikram Lander by Vedansh Gupta.pptxPresentation Vikram Lander by Vedansh Gupta.pptx
Presentation Vikram Lander by Vedansh Gupta.pptx
 
Discovery of an Accretion Streamer and a Slow Wide-angle Outflow around FUOri...
Discovery of an Accretion Streamer and a Slow Wide-angle Outflow around FUOri...Discovery of an Accretion Streamer and a Slow Wide-angle Outflow around FUOri...
Discovery of an Accretion Streamer and a Slow Wide-angle Outflow around FUOri...
 
Hubble Asteroid Hunter III. Physical properties of newly found asteroids
Hubble Asteroid Hunter III. Physical properties of newly found asteroidsHubble Asteroid Hunter III. Physical properties of newly found asteroids
Hubble Asteroid Hunter III. Physical properties of newly found asteroids
 

NRNB Annual Report 2018

  • 1. Overall B.2. What was accomplished under these goals? (to be converted to PDF; images are allowed) Measuring success ● 131 publications citing NRNB grant in the reporting period ● Over 10,000 visits per week to Cytoscape.org ● 17,000 downloads per month for Cytoscape ● 3600 Cytoscape application launches per day ● 43,930 page views in January 2018 for the Cytoscape App Store ● 1000 downloads per day among 333 Cytoscape apps ● A total of 23 tools supported by NRNB ● 75 new and ongoing collaborations with external investigators on diverse topics ● 20 students trained through Google Summer of Code ● 8 NRNB coordinated training events in 7 locations in 4 countries ● Over 100 users trained on Cytoscape by NRNB staff ● 1,000 views in a typical week at tutorials.cytoscape.org ● 536 members in our Network Biology LinkedIn group ● 3,900 members on our moderated Google groups for Cytoscape TRD 1: Differential Networks ● We have now developed a modeling framework for network inference to handle time resolved data. We have used time resolved drug response measurements in melanoma cells. The aim of this task was to improve the perturbation biology method (developed by Nelander, Molinelli, and Korkut) for a more thorough understanding of protein networks and their responses to drug perturbations. ● We continue to develop protein-protein interaction network alignment algorithms since publishing “GreedyPlus: An Algorithm for the Alignment of Interface Interaction Networks” in 2015, the first such algorithm for protein interaction networks that includes binding site information. We have designed an interactome portal for their project at http://interactome.baderlab.org/ that will include network alignment features. ● We continued development of the ​stringApp​ for Cytoscape by Dr. Morris. STRING (http://www.string-db.org/) is an important public interaction database, widely regarded by mass spec practitioners.
  • 2. ● The ​stringApp​ is incorporated into a new tutorial called “Functional Enrichment Analysis”. Mass spectrometry practitioners and analysts routinely work with network models constructed from fundamental interaction measurements. ● We revised the ​idmapper App ​to support automation and scriptibility. Automation is a key new feature of the Cytoscape architecture in version 3.7. Idmapper served as an early use case in adding command functionality to apps. The integration of identifier mapping into Cytoscape as a built-in feature, for example, in addition to the ​stringApp greatly enhances the user experience for mass spec practitioners as well as many other users. TRD 2: Descriptive to Predictive Networks ● We demonstrate the features of the netDx framework by integrating up to six heterogeneous data types, including clinical variables, DNA methylation, somatic mutations, mRNA, miRNA and protein expression profiles, for survival prediction in kidney, lung, ovarian and brain cancer. ● We have made some preliminary progress on the network-constrained regression methodology during this reporting period. Our starting point is the recently published GELnet method. Using the GELnet method, we analyzed the Sanger GDSC pharmacogenomic data for 1080 cell lines across 42 tumor classifications, including: transcript expression, mutation, and drug response profiling on 297 compounds. The overall goal of this project is the identification of biomarkers involved in the progression of cancer and the response to pharmaceutical treatment. ● Using a newly constructed Evolutionarily Selected Pathways Map, we analyzed the major cancer genome atlases to derive a hierarchical classification of tumor subtypes linked to characteristic mutated pathways. The resulting new stratification of tumors corresponded only weakly to known clinical subtypes and variables, or not at all, suggesting new disease subtypes and pathways worthy of further investigation​. ● We built DCell, an interpretable neural network (VNN) simulating a basic eukaryotic cell. The structure of this model is formulated from extensive prior knowledge of the cell’s hierarchy of subsystems documented for the budding yeast Saccharomyces cerevisiae. ● We prepared the first automation workflow example: Advanced Cancer Networks and Data. We then prepared a workshop around this example and have directly presented it to over 100 users during across 4 events during this reporting period. TRD 3: Multiscale Networks ● We report the development of a software framework, the Data-driven Ontology Toolkit (DDOT), which enables the construction and analysis of hierarchical models in a Python package and their visualization in a web application. To demonstrate the ease of computational modeling enabled by DDOT, we programmatically constructed a
  • 3. compendium of data-driven gene ontologies that describe the mechanisms underlying 650 diseases. ● We used previous CliXO work to build a data-driven hierarchy supervised by the topology of human curated resources and compared with human curated Gene Ontology (GO). The resulting “baseline” hierarchy captured most of the conserved biological processes and protein complexes. ● We developed an efficient parallel algorithm (“Ultra-fast CliXO ”) to accelerate the construction of data driven ontology. The central idea of our approach is to replace all data structures with matrices and re-formulize the original algorithmic framework as a series of matrix operations. ● We have undertaken new research and development work to infer cell-cell interaction networks with a focus on perfecting the workflow to take single cell RNA-seq data and identify cell types, that can then be analyzed to predict intercellular interaction networks.. Driving Biological Projects Current mapping of DBP and TRD projects for this reporting period. See the DBP Component for more details. New Working Group During this reporting period, we made a special effort to launch ​Working Groups​ within the NRNB organization to promote intra-collaboration. One burgeoning area of common interest, relating to NRNB goals was Single Cell RNA-seq Analysis and Visualization. Gary Bader, Scooter Morris and Alex Pico organized bi-monthly working group meetings, starting with a survey of opportunities and needs. As we were developing a research strategy, Dr. Morris identified a supplemental funding opportunity to cover a new postdoc and serve as other support on a set of aims complementary to our NRNB effort. This is an excellent example of NRNB catalyzing new, relevant projects in Network Biology. So, in this new component, we will
  • 4. report on the aspects of the working group subproject ​not​ covered by the independent funding, which will begin during the next reporting period. A key component and NRNB relevance of this project will be the set of tools we will build and contribute to the Cytoscape network analysis ecosystem, allowing researchers to leverage dozens of analysis and visualization methods in single cell analysis pipeline. This includes the development of a methods to group cells based on similarities in their transcriptional profiles and effectively identify those groups​ by comparison with previously collected profiles with "known" groups. During our initial survey of the problem space, we noted the current standards in benchmarking and evaluation of scRNA-seq protocols and statistical methods. The novel assignment of biologically meaningful labels is clearly lacking and will require additional evaluation. Current benchmarks involving known cell populations, e.g., as spike-ins, can be extended in our pipeline benchmark to evaluate the functional labels assigned to the clusters. We rely on established ontologies and cell fate maps to quantify the accuracy and sensitivity of the label assignments, including the work of Jill Mesirov in our Collaboration Network to extend MSigDB with curated cell type-specific signatures. Combining version control, immediate write access and transparency, the evaluation of the functional label assignments will be an ongoing activity by the research community, continually approaching consensus. Evaluation of the utility of the system will leverage existing collaborations ongoing in the Bader lab (e.g. scRNA-seq human liver samples from Dr. Ian McGilvray and Dr. Sonya MacParland, mouse brain development) and with Dr. Morris’s scRNA-seq methods work with the DeRisi lab at UCSF and Dr. Pico’s scRNA-seq analyses through the Gladstone Bioinformatics Core. These ongoing collaborations will allow us to test algorithms as well as the user interfaces of the overall system. Training The table below lists the events since our last annual report. Additional one- on-one training requests are tracked as services in our CSP report.
  • 5. Google Summer of Code Accepted for our 10th year as a mentoring organization, we gathered ~60 project ideas and ~40 mentors for GSoC 2017. We had our largest and most successful years yet, with 20 or 21 enrolled students completing their projects. Once again, we prepared a Mentor Resource Packet, a collection of resources designed to help mentors with recruiting students. The packet includes tips on how and where to recruit, as well as ready-to-use slides, flyers and other materials. In addition to the technical accomplishments and productivity of our students, we are also proud of the many important aspects of diversity our students represent in the GSoC program, including geographical, gender and academic. New this year, we prepared 5 Student Profiles in interview-style format to highlight some of our best students. Infrastructure ● We improved the availability, performance and robustness of our Kubernetes cluster by adding sensors to restart failed services; implementing separate clusters for production, staging and testing; and defining policies for promotion of services from one cluster to the next. ● We also added common logging, tracing and metering functionality that can be leveraged by all services, including both Diffusion and Cytoscape itself. ● We created the CXMate service framework supported by a continuous integration pipeline comprising CircleCI, Github and Docker, which together automates service deployment and release. ● We demonstrated and further developed CXMate, by first upgrading the Diffusion (Python) service to use it, and then writing new services to perform network alignment using the C++ based SANA algorithm, network format conversion (from CX to .png), and image caching (for .png images). ● we continued our development and deployment of CyComponents (formerly CyWidgets) to support the development of novel network biology web apps (e.g., HiView and DCell in TRD 2.2 and 3.1). ● We migrated all 21 NRNB virtual machines to the VM cluster. Previously, they were hosted on a 4 year old single processor Dell R420 server whose failure would have been catastrophic. ● We also established a Jupyter notebook server as a VM (provisioned with 90GB and 4 cores). ● We made significant progress in fleshing out the features needed in Cytoscape from the standpoint of usability, e.g., the user interface for setting user preferences and configuration information has been reorganized and presented and graphics capabilities were supplemented with more line stroking, arrowheads and geometric shapes to fully support the requirements of pathway analysis. ● We have begun work on a new app called Legend Creator, which adds an additional control panel to Cytoscape for determining which properties of the graph should be used
  • 6. to generate the legend and then to create annotations of the graph to represent that information. Although this is a secondary function of visualization software, it is an essential part of a finished report, so users have been frustrated by having to manually construct their legends in outside software and add it to their figures outside of Cytoscape. Additional Highlights Cytoscape tutorials In the past year, we have moved our tutorial content from our previous Open Tutorials site to GitHub Pages reachable via ​tutorials.cytoscape.org​. Cytoscape tutorials allows NRNB to reach our goal of providing tutorial support to a broad and diverse community. Currently, the site includes tutorials mainly for users. In the past year, Cytoscape tutorials have been significantly updated and are now built using the ​reveal.js​ presentation framework​, which enables easy creation of attractive interactive slide decks using HTML. The tutorials and presentations are modularized, making it easy to reuse content and extend content. See Training component for more details.
  • 7. Figure 1. Screenshot of the Cytoscape tutorials main page. Tutorials are organized into 4 main categories: Data Visualization, Importing Data, Network Analysis, Exporting and Publishing. Cytoscape automation training We launched a new repository dedicated to promoting and collecting Cytoscape automation training materials in the form of Python and R workflows: https://github.com/cytoscape/cytoscape-automation During this reporting period we added the following materials: ● Advanced: Cancer Networks and Data (R & Python) ● Basic: Fundamentals (R & Python) ● Basic: iGraph (R) ● Basic: Visual Styles (R) ● Basic: Feature Demos (Python) ● Challenge: PPI Network Pipeline (R) -- community contributed ● Challenge: Visualization of Cluster-Filtered Network (R) -- community contributed ● Challenge: Data Mining and Visualization (Python) -- community contributed ● Challenge: SBML Time Course Data (Python) -- community contributed Cytoscape App Store The maintenance of the site allows it to host over 333 apps (an 8% increase over last year) developed by 563 different developers around the world and support ​Cytoscape users downloading an average of 1,046 apps per day​ (a ​24% increase​ over the past 12 months). That has accumulated to just over 1,100,000 total app downloads since the launch of the App Store. The top 3 downloaded apps, ClueGO, BiNGO and CluePedia, have accumulated over 192,000 downloads combined.​ ​During the month of January 2018, the site received over 43,000 page views. F1000Research: Cytoscape App Channel The F1000Research Cytoscape App Channel now has a total of 36 peer-reviewed articles and 3 posters, with 3 articles revised in the last year. NRNB staff are gearing up for another round as guest editors in 2018 to attract a new bolus of app articles leveraging Cytoscape automation.
  • 8. TRD 1: Differential Networks B.2. What was accomplished under these goals? (to be converted to PDF; images are allowed) TRD 1.1: Tools for Inference of Differential Networks from Protein States and Abundances Over Time Background​: The aim of this task was to improve the perturbation biology method (developed by Nelander, Molinelli, and Korkut) for a more thorough understanding of protein networks and their responses to drug perturbations. The perturbation biology method involves inference of quantitative signaling models from high throughput drug response data. In recent years, we solved the network inference problem through implementation of a probabilistic statistical physics algorithm called belief propagation (BP). In network inference, we also benefit from pathway database extracted prior information to improve model accuracy. The network models are based on coupled nonlinear ordinary differential equations that represent the temporal changes to perturbations. Equation 1​: In Equation 1, ​x​μ​ i​ are the perturbed and/or measured variables, ​μ​, represent the perturbations, w​ij​ quantifies the edge strength, ​α​i​ constant is the tendency of the system to return to the initial state, and ​ε​i​ constant defines the dynamic range of each variable ​i​. The transfer function, ​Φ ensures that each variable has a sigmoidal temporal behavior. However, our earlier BP approach was developed for static data obtained at a single time-point, and based steady state assumptions. We have therefore further developed the network inference framework to be able to account for time resolved measurements. Progress This Year:​ We have now developed a modeling framework for network inference to handle time resolved data. We have used time resolved drug response measurements in
  • 9. melanoma cells. The data contains protein measurements as well as phenotypic measurements (cell death and cell growth) for 54 different drug combinations. To infer model parameters, we have developed a framework in TensorFlow to solve the ODEs (Equation 1) and thereby find the optimal values of the parameters (​w​ij​, ​α​i​, and ​ε​i​) by comparing model simulations with data for all measured time points. TensorFlow uses automatic differentiation to compute the gradients of the loss function efficiently, and therefore gives fast optimization with gradient descent methods, even for large optimization problems. To handle overfitting, we used an L1 norm in the loss function, and thereby found networks with 200-300 edges between 136 nodes. The network models was developed with the following steps: 1. We used leave-8-out cross-validation to confirm that the data was of high quality, and that the modeling framework produced models with a predictive power. We thus divided the data into a training set and a test set for each drug, where the test set consisted of all combinations of a particular drug and all other drugs. The left out data was predicted with good accuracy, as exemplified for one of the drugs (MEKi) in Figure 1. 2. The modeling framework was then used to create network models for all available data. We ran the optimization in TensorFlow 10 times and calculated an average network out of the networks that was produced (Figure 2). The average network was calculated from the obtain mean value of each value of wij, and wegthed to how ofter the model was in the network. The obtained average network reproduces known features for drug – protein interactions (e.g. the node AKTi inhibitis the node AKT-S473) as well as protein – protein interactions (e.g. the node MEK1/2-S217 activates the node ERK1/2-T202), and also predicts new interactions that potentially can be experimentally tested. Figures
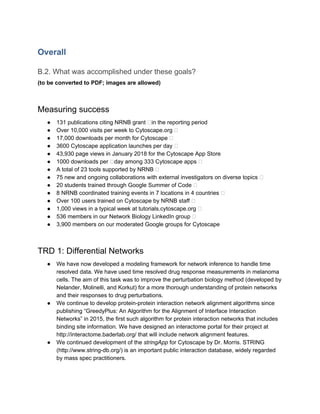
  • 10. Figure 1. Leave-8-out cross-validation. ​An example of the performance of the modeling framework. MEKi is one of the drugs in the data, and Xi represent any of the other drugs. The model was created using data for all drug combinations without MEKi, as well as data for MEKi as a single drug. The left out combinations (MEKi + Xi) was predicted and compared to the corresponding data for proteomic nodes (left) and phenotypic nodes (right). Colors represent the drug combined with MEKi, as states in the legend. The same analysis was made for all drugs (not shown). The Pearson correlation coefficient (corrcoef) shows a good agreement between model simulations and left out data. Figure 2. A resulting average network.​ A graphical representation of the average network obtained from 10 models generated with the modeling framework. The thickness of an edge is based on both the value of the parameter wij and how often the edge occur in the obtained models. Blue nodes represent drug effects, pink nodes represent protein measurements, and grey nodes represent phenotypic measurements.
  • 11. TRD 1.2: Protein network alignment algorithm and viewer; DBP 2: Vidal and Hill TRD1, Differential networks Aim 2. As previously reported, we continue to develop protein-protein interaction network alignment algorithms since publishing “GreedyPlus: An Algorithm for the Alignment of Interface Interaction Networks” in 2015, the first such algorithm for protein interaction networks that includes binding site information. This work has led us to design a new technology for ortholog function assessment that simultaneously considers protein and network evolution, ​but focused on two interacting proteins and their immediate interactors. To support DBP 2 (Vidal and Hill) “Mapping the human interactome and its rewiring by disease mutations”, we continue to engage in weekly discussions with the Vidal team to consult on the analysis of their ongoing human interactome project, in particular where their work includes differential network analysis and consideration of binding sites. ​We have designed an interactome portal for their project at http://interactome.baderlab.org/ that will include network alignment features. TRD 1.3: Facilitating the interpretation of AP-MS data as interaction networks STRING app This project to enable mass spec practitioners to perform network analysis is successfully transitioning from Stage 3 to Stage 4, from deployment of public tools to promoting wide adoption. As such, we report on major updates to the ​stringApp​, a major component of AP-MS and other proteomics workflows as well as a concerted effort to build interactive tutorials and example usage. The major activity was the continued development of the ​stringApp​ for Cytoscape by Dr. Morris. STRING (http://www.string-db.org/) is an important public interaction database, widely regarded by mass spec practitioners. With input from both mass spec practitioners and the developers/maintainers of the STRING database, Dr. Morris implemented the app to take full advantage of all the unique aspects of STRING, as described in the NAR special database issue for 2017 [3]. The ​stringApp​ has been downloaded over 7400 times since its original release in December of 2015 and is freely available at the Cytoscape App Store: http://apps.cytoscape.org/apps/stringapp​.
  • 12. Figure 1. Screenshot of STITCH compound-protein network. ​This is the result of a query for Coumadin (Warfarin®), a common blood thinner used to prevent thrombosis. Queries of proteins or compounds are supported. The nodes in Cytoscape preserve the signature STRING style with structures and glass bobble effects. During this reporting period, Dr. Morris implemented critical support for STITCH as a fourth query option in the ​stringApp​ (Figure 1). The STITCH database includes both physical interactions and functional associations between chemical compounds and proteins (http://stitch.embl.de). Now, in addition to ​protein​, ​PubMed​ and ​disease​ queries, Cytoscape users can select ​STITCH: protein/compound query​ and interrogate the STITCH database for protein-compound interactions. This new dimension of interactions allows researchers to extend protein networks into compound space or build protein networks from a set of one or more compounds. This nicely complements any network or protein interaction resource tools already available in Cytoscape. It is particularly relevant to the growing demand and data deluge for drug compound screens and metabolomics, which includes mass spectrometry practitioners. Another feature added to the ​stringApp​ during this period is enrichment analysis. This was a major step in the AP-MS protocol that once again required the installation and operation of a separate app. Now, upon import of any network via the ​stringApp​ the user can choose to perform enrichment analysis and obtain Gene Ontology terms and KEGG pathway results. Enrichment results may be visualized as both a table and as charts on the nodes (Figure 2). The ​stringApp​ provides a number of different chart types, as well as the ability to filter terms to specific categories and to remove redundant terms (using Jaccard overlap). This is a valuable addition to workflows that involve STRING, DISEASE, or STITCH networks.
  • 13. Figure 2: Screenshot of ​stringApp​ enrichment results.​ This shows the results of performing a DISEASE query for the top 10 proteins associated with Alzheimer’s disease. The enrichment results have been filtered to show only the GO Process category and to remove redundant terms. The “Split donut” chart (the default) has been used to show the enrichment of each protein. Identifier Mapper Core App The Id-Mapper app performs a critical role in integrating disparate databases. Proteins and compounds identified in AP-MS experiments are not generally labeled sufficiently for querying external analysis, Our analysis of the protocol showed that a lot of complexity experienced in mass spec analysis stems from identifier and terminology mismatch. Our experience has been that each iteration of developing this workflow involves improvements to the id-mapper core app. During this past year, the app was revised to support automation and scriptibility. Automation is a key new feature of the Cytoscape architecture in version 3.7. Id-mapper served as an early use case in adding command functionality to apps. Because this app is an extension of the table browser subsystem, it serves as a forerunner for a series of features in table processing, which is a key function in the near future following the roadmap of the project.
  • 14. WikiPathways as Demonstration of Automation and New Network Search Bar Another important improvement Cytoscape recently added to expedite workflows is the network search bar. Most searches can now be queried directly in the network control panel, instead of asking the user to find a menu to open a dialog to type a keyword. These seemingly minor hurdles accumulate into a lot of extra work for users, and slow the performance of tasks. So it is important that the software evolve to reduce repetitive tasks and expedite workflows. The network search bar facilitates apps to perform enrichment of networks faster than the previous solution of provide different control panels depending on the database being searched. The current release of WikiPathways is among the first app to support commands and automated execution. The app provides specific functionality for searching and importing from the WikiPathways web resource. Now that the app can be controlled via CyREST, imports of pathway networks can be scripted from a variety of languages, including R, Java and Python. Promoting Wide Adoption The ​stringApp​ is incorporated into a new tutorial called “Functional Enrichment Analysis” (​https://cytoscape.github.io/cytoscape-tutorials/protocols/modules/functional-enrichment/#/​). Mass spectrometry practitioners and analysts routinely work with network models constructed from fundamental interaction measurements. The data inform the biomedical understanding of host-pathogen interactions, signaling networks and network ​rewiring​ in cancer, to name a few examples. This is a critical field of research with which to provide powerful and accessible network visualization and analysis technology. This project component is aimed at making specific improvements and implementing new features to Cytoscape to enhance its applicability and adoption by mass spec community. The main objectives are to augment Cytoscape to streamline the typical mass spec analysis pipeline and provide better access to public mass spec data and annotation repositories relevant to researchers. This is relevant to mass spec practitioners who want to view their interaction data in the context of other public interaction data and other annotations. The integration of identifier mapping into Cytoscape as a built-in feature, for example, in addition to the ​stringApp​ greatly enhances the user experience for mass spec practitioners as well as many other users. See the before/after comparison of the steps required in the published mass spec Nature Protocol. The simplification goes beyond app integration and user interface work. For example, rather than requiring the user to explicitly connect to a database source, the new tool automatically connects to existing web service provided by BridgeDb. And rather than requiring the user to explicitly choose a source identifier type, the new tool infers the identifier from the values extracted from the column indicated by the user in the right click action that initiated the dialog. We also included better options, based on prior experience using and training. References
  • 15. 1. Morris, J.H.K., G.M.; Verschueren, E.; Johnson, J.R.; Cimermancic, P.; Greninger, A.L.; Pico, A.R. Affinity Purification-Mass Spectrometry and Network Analysis to Understand Protein- Protein Interactions. ​Nature Protocol ​(2014) 9, 2539-54. 2. Gao J, Zhang C, van Iersel M, et al. BridgeDb app: unifying identifier mapping services for Cytoscape. F1000Research. 2014;3:148.. 3. Szklarczyk D, Morris JH, Cook H, et al. The STRING database in 2017: quality-controlled protein–protein association networks, made broadly accessible. Nucleic Acids Research. 2017;45(Database issue):D362-D368.
  • 16. TRD 2: Descriptive to Predictive Networks B.2. What was accomplished under these goals? (to be converted to PDF; images are allowed) TRD 2.1: Predicting clinical outcome using patient similarity networks Patient classification has widespread biomedical and clinical applications, including diagnosis, prognosis, disease subtyping and treatment response prediction. A general purpose and clinically relevant prediction algorithm should be accurate, generalizable, be able to integrate diverse data types (e.g. clinical, genomic, metabolomic, imaging), handle sparse data, be compatible with patient privacy protection systems and be intuitive to interpret. Last time, we reported on the development of netDx (http://netdx.org/), a supervised patient classification framework based on patient similarity networks that meets the above criteria. netDx models input data as patient networks and uses the GeneMANIA machine learning algorithm that we previously developed for network integration and feature selection. ​We demonstrate the features of this framework by integrating up to six heterogeneous data types, including clinical variables, DNA methylation, somatic mutations, mRNA, miRNA and protein expression profiles, for survival prediction in kidney, lung, ovarian and brain cancer.​ We benchmarked netDx performance as a machine-learning method by predicting binary survival in four tumour types. netDx ranks at the top for two tumours and within the top 20th percentile for all four, demonstrating consistently good performance and we continue to work on improving performance. In comparison to traditional machine learning-based patient classifiers, netDx results are more interpretable, visualizing the decision boundary in the context of patient similarity space and identifying biological pathways and other features important for prediction. By defining patient similarity using pathway-level gene expression, netDx identifies known molecular correlates of poor survival in kidney cancer, and identifies potentially novel pathways and biomarkers. Thus, netDx can serve both as a useful classifier and as a tool for discovery of biological features characteristic of disease. An open-source R/Java implementation of netDx is available along with sample files and automation workflows packaged as vignettes. To support ​DBP 5​: Sage Bionetworks: Molecular stratification of colorectal cancer and DREAM challenges, we have revisited all major DREAM challenges where data are available and where the challenge experimental design is compatible with netDX’s classification engine (two class classification). ​We have broadly searched for additional similar data to analyze as well.​ We will report the results in a publication, such as the netDX paper.
  • 17. TRD 2.2a: Predicting cellular response to perturbation w/ network-guided regression Background:​ ​The overall goal of this project is the identification of biomarkers involved in the progression of cancer and the response to pharmaceutical treatment. This goal is to accomplished through the used for regression-based methods that subject to biological network constraints so that biomarkers can be understood in the context of regulatory processes. Current progress:​ ​ In conjunction with ​DBP 8​, ​we have made some preliminary progress on the network-constrained regression methodology during this reporting period. Our starting point is the recently published GELnet method. Using the GELnet method, we analyzed the Sanger GDSC pharmacogenomic data for 1080 cell lines across 42 tumor classifications, including: transcript expression, mutation, and drug response profiling on 297 compounds. Transcript expression included information on 19,562 genes and gene-level summarized mutations for 16,532 genes. The network used was either 1) the entire PC database (pcAll), covering 22 interaction databases, or 2) only the CORUM protein complex database (pcCorum). We compared LASSO and GELNet regression methodologies to understand the benefits of GELNet over the commonly used LASSO method. Figure 1 summarizes our findings comparing the two methods. The LASSO models tends to produce models that more accurately correlate with the observed drug response, but there combinations of feature sets where the GELNet models outperform. For example, using mutation information, the entirety of the Pathway Commons network, and starting set of genes that includes 1) genes correlated with the response and 2) genes in genesets of interest. In the example described above, what we find is that even though we find these models to be more accurate, but they come with a limitation which is that tend to be larger than then accompanying LASSO models. Understanding the properties of these models is ongoing.
  • 18. Figure 1: ​Faceted visualization of input feature combinations for LASSO and GelNet models (see Data section for term descriptions). A) Drug Response Correlations: In all cases of network and feature set combinations, models developed with expression data resulted in sets of models where the median correlation to drug response for the resulting LASSO models was higher than GelNet models. This was similar to the case when mutation data was used except when the entire Pathway Commons network was used regardless of feature set. Example drugs where this was the case, included S-trityl-L-cysteine (mitotic progression inhibitor) and romedepsin (histone deacetylase inhibitor). B) Feature Counts: In cases where mutation data produced more numerically accurate models, these models tended to have larger feature counts. TRD 2.2b: Predicting cellular response to perturbation w/ network-guided regression Part I The goal of this part is to identify important biomarkers involved in the progression of cancer and the response to pharmaceutical treatment in the context of biological network constraints. A very popular approach is heat diffusion, also called network propagation, by which individual gene mutations in a tumor are diffused across the network. Such diffusion creates “hot” network
  • 19. neighborhoods of genes proximal to mutated genes. This type approach could help to define driver genes and potential drug targets for cancer therapy. They also allow patients to be clustered into subtypes, because the neighborhoods, unlike individual genes, are commonly mutated and thus provide a basis for grouping tumors. In this project we find that the informative genes and pathways driving cancer pathogenesis and subtypes can be remarkably difficult to identify in the presence of gene interactions irrelevant to cancer. We show that this problem can be addressed by assembly of a focused Evolutionarily Selected Pathways Map (ESPmap), in which all interactions are supported by both protein-protein binding and genetic epistasis during somatic tumor evolution. Our approach creates stringent tumor-specific networks of biophysical protein interactions, identified by signatures of epistatic selection during tumor evolution. Using such newly constructed network, we analyzed the major cancer genome atlases to derive a hierarchical classification of tumor subtypes linked to characteristic mutated pathways. The resulting new stratification of tumors corresponded only weakly to known clinical subtypes and variables, or not at all, ​suggesting new disease subtypes and pathways worthy of further investigation​. These pathways are clinically prognostic and predictive, including the TP53-AXIN-ARHGEF17 combination in liver and CYLC2-STK11-STK11IP in lung cancer, which we validate in independent cohorts. Further investigation was carried out in a panel of liver and lung cancer cell lines characterized in the Genomics of Drug Sensitivity in Cancer (GDSC) dataset. We found the pathways we detected were associated with different types drug response. Part II In this project, we built DCell, an interpretable neural network (VNN) simulating a basic eukaryotic cell. The structure of this model is formulated from extensive prior knowledge of the cell’s hierarchy of subsystems documented for the budding yeast Saccharomyces cerevisiae. It is drawn from either of two sources: the Gene Ontology (GO), a literature-curated reference database from which we extracted 2526 intracellular components, processes, and functions and CliXO, an alternative ontology of similar size inferred from large-scale molecular datasets rather than literature curation. Such hierarchies form a natural bridge from variations in genotype (at the scale of nucleotides and genes) to variations in phenotype (at the scale of cells and organisms). The function of our new interpretable neural network is learned during a training phase, in which perturbations to genes propagate through the hierarchy to impact parent subsystems that contain them. This gives rise to functional changes in protein complexes, biological processes, organelles and, ultimately, a predicted response at the level of cell growth phenotype. Unlike standard neural network model, our interpretable neural network was tied to an extensive hierarchy of internal biological subsystems with states that could be queried. This ‘visible’ aspect raises the possibility that our approaches could be used for in-silico studies of biological mechanism, of which we focused on four major types: 1) Explaining a genotype-phenotype association, 2) Prioritizing all important mechanisms in determination of phenotype overall, 3)
  • 20. Characterization of the genetic logic implemented by a process, 4) Discovery of new biological processes and states. TRD 2.3: Cytoscape Apps for accessible network analysis of genetic variant data The initial work on this subproject was focused on surveying the current capabilities of Cytoscape for visualizing genetic variant data and performing diffusion analysis and subnetwork generation based on variant data. To this end, we prepared the first automation workflow example: Advanced Cancer Networks and Data. https://github.com/cytoscape/cytoscape-automation/blob/master/for-scripters/R/advanced-cance r-networks-and-data-rcy3.Rmd We then prepared a workshop around this example and have directly presented it to over 100 users during across 4 events during this reporting period (see Training). We will expand on these materials as we implement new tools per the original timeline for this subproject.
  • 21. TRD 3: Multiscale Networks B.2. What was accomplished under these goals? (to be converted to PDF; images are allowed) TRD 3.1: Data-driven assembly & refinement of gene ontologies from networks We report the development of a software framework, the Data-driven Ontology Toolkit (DDOT), which enables the construction and analysis of hierarchical models in a Python package and their visualization in a web application. In contrast to existing tools for studying hierarchical models and literature-curated ontologies, DDOT supports general hierarchies known as directed acyclic graphs (instead of trees) and focuses on the analysis of data-driven structure (instead of semantic relations by traditional ontology software). To demonstrate the ease of computational modeling enabled by DDOT, we programmatically constructed a compendium of data-driven gene ontologies that describe the mechanisms underlying 650 diseases. These ontologies were based on two types of input data: a set of known gene associations for each disease and a gene-gene similarity network based on several ‘omics datasets. By calling DDOT functions, the software pipeline was very concise, consisting of 16 lines of code for loading input data and setting parameters and 8 lines for modeling in a single Python script. For each disease, its ontology suggests an association with new genes as well as new cellular subsystems, many of which are not found in the literature-curated Gene Ontology. For example, we studied Fanconi Anemia (FA), a rare genetic disorder that is associated with bone marrow failure, myeloid dysplasia, and increased cancer risk. The resulting ontology consisted of 194 genes arranged in a hierarchy of 74 cellular subsystems, which includes the known association with DNA repair pathways but also proposes a previously unknown role of orthogonal subsystems such as splicing and telomere maintenance. A major component of DDOT is the HiView web application, which provides an interactive visualization of two major features of a data-driven ontology: (1) the hierarchical structure relating genes and subsystems and (2) the data supporting the inference of each subsystem. To provide the first feature, HiView allows the user to interactively zoom between more expansive views of the entire hierarchy and more focused views of particular subsystems. It also provides techniques for visualizing multi-parent and multi-children relations in ontologies. To provide the second feature, HiView also visualizes the network of gene-gene interactions that were used to support the inference of each subsystem in the ontology (​Figure 1​).
  • 22. Figure 1. Screenshot of the HiView application to visualize ontologies (http://hiview.ucsd.edu) TRD 3.2: Functionalized gene ontologies as a hierarchy of functional prediction Part I. We used previous CliXO work to build a data-driven hierarchy supervised by the topology of human curated resources and compared with human curated Gene Ontology (GO). The resulting “baseline” hierarchy captured most of the conserved biological processes and protein complexes. As a starting point to study context dependent interactions, we integrated cell-line specific PPIs measured by AP-MS (Krogan lab) into our model, and aimed to interpret these interactions by comparing the iterated model to the baseline model. We are also working on improving CliXO by optimizing it to produce significantly fewer false positive subsystems. The resulting human data-driven ontology is much more robust and contains fewer false positive subsystems in comparison to our previous version. Part II. In this project, we developed an efficient parallel algorithm (“Ultra-fast CliXO ”) to accelerate the construction of data driven ontology. The central idea of our approach is to replace all data structures with matrices and re-formulize the original algorithmic framework as a series of matrix operations. There are two major advantages of our re-formulization relating to both hardware architecture and software developing cost: 1) Faster transfer of memory from RAM to CPU/GPU; 2) “Embarrassingly parallel” computation. Experimental results validate that the new implementation significantly outperforms original data driven ontology construction algorithm under various settings. We achieved a practical 200-fold decrease in runtime when applied to representative yeast and human molecular datasets. Importantly, each individual component of the pipeline, including clique detection, clique growing, clique merging, as well as
  • 23. the novel data structure for dynamic sparse matrices, can be extended for use in other applications in the biological, physical and social sciences. TRD 3.3: Bridging ligand-receptor networks to cell-cell communication networks As previously described, we have undertaken new research and development work to infer cell-cell interaction networks. In particular, we have extensively used single cell RNA-seq data to infer higher resolution cell-cell networks and have developed applications to cancer stem cell biology and regenerative medicine (e.g. DBP 9), both areas where cell communication is important for tumour or normal tissue development. ​Our main work in 2017 to continue this work has been to focus on perfecting the workflow to take single cell RNA-seq data and identify cell types, that can then be analyzed to predict intercellular interaction networks. To support DBP 9: Engineering blood for regenerative medicine, we are continuing work to automate our cell-cell interaction network inference pipeline.