Global Scenario On Sustainable and Resilient Coconut Industry by Dr. Jelfina...
Savings and its determinants in west africa countries
1. Journal of Economics and Sustainable Development
ISSN 2222-1700 (Paper) ISSN 2222-2855 (Online)
Vol.4, No.18, 2013
www.iiste.org
Savings And Its Determinants In West Africa Countries
Bosede Victoria Kudaisi
Department of Economics, Adekunle Ajasin University, Akungba-Akoko, Ondo State, Nigeria
kudaisibosede@gmail.com
Abstract
This study and investigated the determinants of domestic savings in West Africa during 1980-2006. The
theoretical foundation for this study is anchored on Hall hypothesis of consumption. The Hall hypothesis states
that consumption is a function of lifetime ("permanent") income, rather than income in each period
independently. The model assumes that capital markets are perfect and the interest rate varies over time across
countries and consumers have rational expectations regarding the income- generating process. Thus, the
empirical results are as follows: The size of effect of the dependency ratio, and interest rate on domestic savings
is found out negative and insignificant, growth of GDP though positive but statistically insignificant, only the
government budget surplus and inflation rate are found to be statistically significant. The development of West
Africa financial market has a positive effect on savings, and finally, the real interest rate, and terms of trade have
insignificant impact on the level of saving in West Africa.
Keywords: Gross Domestic savings, Hall Hypothesis, West Africa, Panel data
1.
Introduction
The important role of savings has been stressed in both developed and developing countries due to possible
distortion of aggregate savings, the role of savings as a measure of economic performance and the central issue
of mobilizing domestic savings in less-developed countries have always engaged the attention of development
economists due to the continued unsatisfactory growth performance and the high incidence of poverty in several
of the countries. Domestic savings is seen as a means of increasing investment, which in turn enhances
economic growth through capital formation.
Understanding the nature of national savings behavior is critical in designing policies to promote savings and
investment. It is therefore not surprising that the analysis of saving behaviour has become one of the central
issues in empirical macroeconomics (Jappelli and Pagano, 1998). Along with the recent revival and the
consequent expansion of the literature on macroeconomic growth, interest in the saving’s determinants
underwent an upsurge attention (Ozcan et al, 1998). Deaton, 1989; Jappelli and Pagano, 1998; Ozcan, 2000;
Schmidt-Hebbel et al, 2000 and Elbadawi and Mwega, 2000 further stressed the important of saving behaviour
in developing countries. Among other things, the long-debated relationship between saving and the level of
growth rate of income has provided a strong stimulus for analyzing the determinants of saving more thoroughly
in most countries of the world.
Saving rates display considerable variation across countries of Africa and over time. A comparison of West
Africa rate of savings, with that of other regions of Africa, shows that the region has performed poorly
throughout, the period of study. In the period 1980-1985, the North Africa had the highest savings rate of 22.1%,
Middle Africa follows at a distant rate, with 9.9 per cent. West Africa savings rate stayed at a very disturbing
low rate of 6.1 per cent. Although, the savings rate in West African increased from 6.6 percent in 1980-85 to 7.8
per cent in the period 1985-1990, the region continued to trail behind all other regions except South Africa. The
period of 1990-1995 and 1995-2000, still left West Africa trailing behind North and Middle Africa sub-regions.
Even, in the recent period of 2000-2006 when most countries witnessed some growth the rate of savings in West
Africa was still below 10 per cent.
Table 1: Annual Average Gross Domestic Saving by Region percent share of GDP (1980-2010)
198019851990199520001985
1990
1995
2000
2005
5.8
9.0
5.6
4.8
2.8
East Africa
South Africa
-3.0
6.7
10.9
4.1
17.9
Middle
Africa
North Africa
9.9
9.1
11.9
15.2
28.3
22.1
22.6
13.8
14.3
19.2
West Africa
6.1
7.8
8.0
7.7
9.7
Source: Author’s computation from The World Bank,
African Development Indicators.(Various issues)
107
2. Journal of Economics and Sustainable Development
ISSN 2222-1700 (Paper) ISSN 2222-2855 (Online)
Vol.4, No.18, 2013
www.iiste.org
However, not only have questions been raised regarding the significance of the savings effort as an independent
determinant of economic progress, but the formulation of policies designed to increase savings has suffered from
a dearth of knowledge regarding the variables that determine savings in developing countries especially in
African countries. Notwithstanding, some efforts have been made at examining the policy and non-policy
variables that determine savings behaviour in both developed and developing countries needed to support growth
and to finance domestic investment and reduce the reliance and associated risks from having to borrow aboard.
The rest of this paper is formatted thus: section 2 look at the savings trend in Africa countries and the saving
performance in West Africa countries. Section 3 states the problem statement. Section 4 is the literature review.
Section 5 discusses the methodology. Following is the section 6 which state the estimation procedure while
section 7 states the data source and section 8 discusses the empirical result. Finally, section 9 gives the summary,
conclusion and policy recommendation.
2.
Savings Trends in Africa: A Stylised Fact
There are no hard and fast rules on the determination of how well national and domestic savings should perform
in any given year. Thus, in discussions of how well savings are doing in any economy, the standard is usually to
compare that economy to other economies of similar size and structure, or to compare the same countries’
savings performance over time, or even to compare actual performance to planned performance. In this section
we shall focus our discussion by looking at the saving in West Africa in relation to other regions in Africa4.
West Africa’s savings performance is far below that of North and Middle Africa. The general picture is depicted
in Figure 4.1 below. As a region, some of the best saving rates in West Africa may be found in Nigeria, and
Cote d’Ivoire where the gross domestic saving rate has averaged in Nigeria17.5 percent in 1980-89, 24.0 percent
in 1990-1999 and 35.6 percent in 2000-2005 respectively and Cote d’Ivoire with an average gross domestic
saving rate of 19.6 percent, 17.8 percent and 20.8 percent in 1980-1989, 1990-1999 and 2000-2005 respectively.
These are by all accounts outliers in the region where some of the countries have domestic saving rates of fewer
than 5 percent of GDP and sometimes negative savings. Their high saving rates can be attributed to their being
relatively small economies except in the case of Nigeria with large oil exports.
Despite the economic reforms that many African countries attempted in the last decade, there is little evidence of
these having a major impact on savings and investments in countries (World Bank 1994). It is important to
emphasise that West Africa is not an undifferentiated whole. For example the annual average saving rate during
2000-2006, was far greater than that of the East Africa. South Africa saving rate was negative between 19801984. This was due to economy crisis in the country. There was a sharp increase during 1985-1989 and 19901994 while between 1995-1999 there was a sharp decrease as a result of political crisis in the economy in 1997.
The challenges posed by those demands on the domestic economy were enormous, and it is not surprising that
not much progress has been made in that direction. Indeed very few countries have ever achieved their savings
targets. In contrast, we note that the fast growing North African economies recorded average saving rates of
about 22.1 and 22.6percent during 1980-1984 and 1985-1989 and decline during 1990-1994.
Table 2
Annual average Gross Domestic Saving of African region percent share of GDP (1980-2006)
1980-1984
1985-1989
1990-1994
1995-1999
2000-2006
5.8
9.0
5.6
4.8
2.8
East Africa
-3.0
6.7
10.9
4.1
17.9
South Africa
9.9
9.1
11.9
15.2
28.3
Middle Africa
22.1
22.6
13.8
14.3
19.2
North Africa
6.1
7.8
8.0
7.7
9.7
West Africa
8.2
10.0
10.0
9.2
15.6
TOTAL
Source: Author’s computation from The World Bank, African Development Indicators. (Various issues)
4
AFRICA REGION: Eastern Africa: Burundi Comoros Djibouti Eritrea Ethiopia Kenya Madagascar Malawi
Mauritius Mayotte Mozambique Reunion Rwanda Seychelles Somalia Uganda United Republic of Tanzania
Zambia Zimbabwe.
Middle Africa: Angola Cameroon Central African Republic Chad Congo Democratic
Republic of the Congo Equatorial Guinea Gabon Sao Tome and Principe
Northern Africa: Algeria Egypt Libyan Arab Jamahiriya Morocco Sudan Tunisia Western Sahara
Southern Africa: Botswana Lesotho Namibia South Africa Swaziland
Western Africa: Benin Burkina Faso Cape Verde Côte d'Ivoire Ghana Guinea Guinea-Bissau Mali Niger
Nigeria Senegal Sierra Leone Liberia and Mauritania The Gambia Togo
Note: data on West Africa, excludes Liberia and Mauritania due to unavailability of data
108
3. Journal of Economics and Sustainable Development
ISSN 2222-1700 (Paper) ISSN 2222-2855 (Online)
Vol.4, No.18, 2013
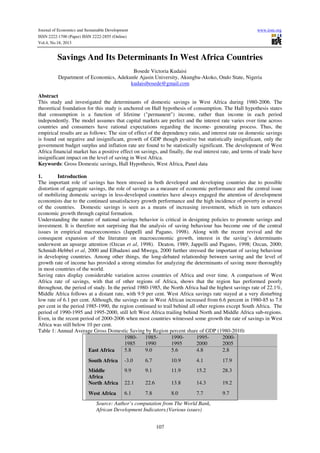
Figure 1.
www.iiste.org
The trend of saving in West Africa Regions
Savings Trend in West Africa Regions
% Share of GDP
100
West Africa
50
North Africa
0
Middle Africa
2.1.
Savings Performance Within West Africa Countries
Table 2 below provides trends of gross domestic saving in West Africa over the period 1980-2006. Ghana has
had a very low average domestic saving rate of about 4.8 percent of GDP between 1980-1989. Indeed, Ghana’s
saving rate only rose from 4.8 percent to 7.5 percent after a decade of reforms. Nigeria as the giant of Africa has
the highest saving performance throughout the period. The first noticeable reason could be the steady growing
rate of savings in Nigeria, Africa’s largest oil producer. One of the characteristics of all the data on domestic
saving rates is that they declined for most countries in the period 1980-89 and have not seen a revival yet.
(Elbadawi and Mwega 1998).The region indeed boasts of some contrasts in country performance with savings.
In Cape Verde, aggregate savings ratios remained strikingly low throughout the period of adjustment. This may
be attributed to the huge losses made by public enterprises as the majority of the populations are found in
industries. Nigerian trends with aggregate savings have been interesting and different from the situation in many
other countries. It first experienced a general decline during 1990-1999, but this was reversed after that. While
this was happening, however, increasing debt service payments widened the gap between national and domestic
savings after 1986. The domestic savings ratio rose to more than 30% in 2000-2005, an increase that was largely
accounted for by private savings as government savings fell.
In Ghana, for example, under a program for accelerated growth in the midst of Bank supported reforms that
would transform the economy into a middle-income economy by the year 2020, it was programmed to achieve
an annual growth rate of 8% for the rest of the century which would require an investment/GDP ratio of 25
percent, assuming the ICOR remained at 3 percent. This would push the required domestic savings/GDP ratio to
20 percent, assuming foreign savings remained at 5 percent (World Bank 1993).
Cote d’Ivoire has seen an impressive growth of its savings rate which also went beyond 15 percent, indeed
reaching 20 percent in 2000-2005. Nigeria performance in West Africa was far higher than the African average
at 22.4 percent in 2000-2005. In Guinea, for instance, witnessed an increase in saving rate over 1980-1999. This
can be attributed to the increase in the agricultural sector of the economy. While in 2000-2006, there is a
reduction in the volume of saving in the country.
Guinea Bissau witnessed a negative saving in 1980-1989 and 2000-2006 but there was a slight increase in during
1990-1999. This can be due the revival in their agricultural product as most of the population in agriculture.
Saving performance in Sierra Leone and Togo witnessed an increase of 9.1 and 12.3 respectively and this was
expected to grow but declined continuously and Sierra Leone recorded negative of -7.6 percent between 20002006. In Sierra Leone for instance, brutal civil war convulsed the country in the 1990s. The civil war decimated
the infrastructure and precipitated an economic depression that resulted in a sharp decrease in their GDS.
Between 1990 and 1999, the GDS declined at an annual average rate of 2.9 percent. Since the ending of the
conflict in 2001, the economy was expected to recover and bring about an increase in their GDS but the GDS
was negative between 2000-2006
Also, from table 4.2 below Senegal saving rate was below 5 percent between 1980-1989 but witnessed an
increase of 5.4 and 9.0 percent between 1990-1999 and 2000-2006 respectively. This was due to their increase in
FDI and tourism also serves as a major source of earning between this periods. Mali for instance witnessed a
negative -0.4 percent between 1980-1989. This also can be due to a decrease of 0.5 percent in their GDP during
the period as we see in table 1.2. Hence an increase in GDP between 1980-1989 and 2000-2005 also led to a
sharp increase of 7.6 and 11.5 percent between 1990-1999 and 2000-2006 in their saving respectively.
Niger saving rate was 7.3 percent between 1980-1989 but surprisingly declined to 2.7 percent between 19901999 and later increase to 5.6 percent between 2000-2006. One of the noticeable characteristics of the saving
rates of West Africa countries is pro-cyclical. Some witnessed an increase in the first period and decrease and
rise again in the last period. This can be traced to the income level of the countries and the economic situation
during the period.
109
4. Journal of Economics and Sustainable Development
ISSN 2222-1700 (Paper) ISSN 2222-2855 (Online)
Vol.4, No.18, 2013
www.iiste.org
3.
Research Problem
Over the last three decades, the world has witnessed a marked divergence in saving rates and this has been
particularly dramatic within the African countries. Saving rates have risen steadily in East Asia, stagnated in
Latin America and have been volatile in Sub-Sahara Africa, North Africa and deteriorating in South Africa and
steadily increased in West Africa. These regional saving disparities have been closely matched by divergence in
growth experience. (Schmidt-Hebbel et al, 1989). In recent years, there have been several studies on the
determinants of saving both in developed and developing countries. Some of these studies often focus on the
determinants of private and household saving rates. Such studies include Schmidt-Hebbel et al (1992, 2000),
Elbadawi and Mwega (2000), Masson et al (1995) and Ogaki et al (1996).
Some of the countries in West Africa witnessed increase in saving rates due to an increase in the rate of growth.
For instance, Burkina Faso witnessed an increase of 2.7 per cent from 1980-1989 to 7.6 per cent and falls to 5.0
per cent from 2000-2005 as a result of decline in GDP during the period. Nigeria recorded 17.5 per cent from
1980-1989 and doubled from 2000-2005 to 35.6 per cent. Togo saving rates was 12.3 per cent from 1980-1989
and declined to 6.7 per cent to 2.4 per cent between 1990-1999 and 2000-2005 respectively. Cape Verde saving
was negative throughout the period. This large variation in saving performance across West Africa countries and
over time raises a number of questions. Why do saving rates differ so much across the region? How much do
policies (such as interest rate, government budget surplus, inflation, financial depth, income level,) and nonpolicy (such as demographic variables, terms of trade,) variables determine the saving rates in West Africa?
Perhaps, from the policy perspective, there are serious questions about the size, sometimes about the sign and the
effects of policy variables on saving rates across the countries. What would be the most effective policy in
raising domestic saving across West Africa regions? Hence, this study sought to investigate the determinants of
saving in West Africa countries over the period 1980-2006.
4.
Literature Review
There are considerable numbers of studies on the determinants of saving in both developed and developing
countries. The review provided in this section focus only on studies relating to African countries.
In the work of Aryeetey (1995), using the data set over the period 1960-1992, he divided the saving in Ghana
into two: financial saving and non-financial saving. It was found that real deposit rates have no perceptible
influence on rural household saving in Ghana. Aryeetey argued that uncertainty and depression of the investment
climate, and high rates of inflation have a significant effect in determining savings in the country, while lack of
confidence in banks solvency, high transaction costs and inadequate banks in rural areas all responsible for a
decline in financial saving.
Borrowing from these various strands of analyses, Ogaki, Ostry and Reinhart (1996) conducted a study on the
determinants of household saving behaviour for Low-and Middle-income developing Countries in Africa. The
main finding of the analysis was that the level of saving and the responsiveness of saving to the real interest rate
could be explained by the country’s income level. The result then suggested that higher saving rates may not be
forthcoming, even with relatively large increase in real interest rates, if the country is at the lower end of the
income spectrum. Also, the growth effect of higher interest rates would also tend to be relatively small for
relatively poor countries.
Chete (1999) found that private saving in Nigeria is only affect by the ratio of broad money (M2) to GDP,
thereby refuting the potential payoffs from efforts at financial deepening. This particular finding accentuates the
need to rethink current preoccupation with financial deepening as the route to growth in an enhanced savings
mobilization. According to Olusoji (2003) he maintained that savings in Nigeria is being influenced by income,
government deficit and inflation rate while exchange rate appeared to be the most significant determinant at 1%.
While interest rate has no effect on private saving in Nigeria and that GDP growth rate has a positive impact.
With respect to determinants of financial saving in Nigeria. Uremadu (2007) using ordinary least square (OLS)
noted that GDP per capita income, interest rate spread (SLS), broad money supply (M2) and debt service ratio
(DSR) are the main determinants of financial saving in Nigeria.
The study conducted by Elbadawi and Mwega (2000) for Sub-Saharan Africa and other region such as Latin
America, East Asia and Caribbean found that gross private domestic income, the growth of gross private
domestic income per capita and the growth in the term of trade have positive impact in determining the rate of
saving in the countries understudied. Public saving is negative and highly significant with an offset of about -0.6
percent. This shows that a rise in public saving by 10 percent will reduce private saving by 6 percent. The results
also showed that government consumption has a positive and significant coefficient, implying that private sector
places positive value on government consumption. In comparison with other regions, the authors concluded that
the main factor driving savings in Asian economies are income per capita, young dependency ratio and increase
in public saving.
110
5. Journal of Economics and Sustainable Development
ISSN 2222-1700 (Paper) ISSN 2222-2855 (Online)
Vol.4, No.18, 2013
www.iiste.org
The work of Ozcan (2000) for a sample of 15 Middle East and North African countries (MENA) over the period
of 1981-1994, showed that real capita income level has positive impact on private saving rate, which implies that
the more advanced countries tend to save a higher percentage of their GDP, the higher the real capita growth rate
relative to saving which support the vicious cycle hypothesis that increase in growth rate of real capita income
increases saving to even higher growth. From a policy point of view, the study suggest that private credit, real
interest rates and financial depth, M2/GNP has positive influence but statistically insignificant with 0.05.
In South Africa, Odhiambo (2007) examined the key determinants of domestic savings using the cointegration
based error-correction model. The study was motivated by the current low and declining saving rate in South
Africa. The empirical results of this study, which cover the period 1968-2004, indicate that savings in South
Africa are largely determined by the growth rate of real GDP, foreign savings, real deposit rate, government
expenditure and terms of trade.
5.
Methodology
5.1.
Theoretical Framework
Most of the studies that have been done on savings determinants either on individual country basis or group
adopted the theory of Life Cycle Hypothesis. These studies include: Collins (1991); Chete (1999); Elbadawi and
Mwega (2000); Massion Boyoumi and Sameii (1998); Ozcan (2006). A review of the literatures on savings
determinants revealed that Life Cycle hypothesis alone is inadequate to provide a theoretical basis for this study.
This is due to the fact that it cannot capture or explain all the variables that determine savings.
Therefore, the theoretical framework adopt in this study is rooted in the life-cycle/permanent-income hypothesis
developed by Hall (1978). The justification for the choice of the theory is that it combines the lifecycle/permanent income variables used in this work. This is known as the random-walk hypothesis. Starting with
the life cycle hypothesis, the theory assumed that an individual seeks to maximize the present value of lifetime
utility subject to the budget constraint. The budget constraint equal to the current net worth plus the present value
of expected income over an entire working life of the individual. The theory also predicts that consumption in
each period depends on expectations about life time income. The theory predicts that consumption in each period
depends on expectations about life time income. Given that income fluctuates over the course of life of an
individual, each stage in the life cycle is an important determinant of saving behaviour. Thus, an individual will
smooth consumption over his lifetime, being a net saver in his youth and a net borrower in old age (Modigliani,
1986). The absence of a link between current savings and current income in the LCM theory of consumption is
an implication that individuals are forward-looking, and therefore, based their saving decisions on lifetime
income rather than current income. For the above consideration, both growth rate and income level are
explanatory variables in the saving function. The life cycle model hence predicts that an increase in the rate of
growth of income will lead to an increase in saving rate.
Sequel proposition of the LCM is that it is rational for the individual to borrow in the early years of his working
life to finance his consumption needs; repay the borrowed funds in the middle of his life time when his income
would have risen; and save for the future within this phase of his working life and use the savings to fiancé
consumption on retirement. Borrowing will always attract interest rate. The life-cycle model predicts that a
higher interest rate increases the current price of consumption vis-à-vis the future price, thus leading to an
increase in saving.
Demographic variables are very important in the life cycle model. The set of variables that make up
“demographic variables” are usually the urbanization ratio, the age distribution of the population, dependency
ratio and life expectancy. These variables are sometimes termed life cycle variables, as they operate under the
predictions of the life cycle theory. Ando and Modigliani (1963) show that demographic variables affect savings
rate. The age structure of the population is an important factor for savings because people, who seek to smooth
out consumption over their lifetime, save when they expect future income to be low and dissave when they
anticipate it to be high.
Assuming that the bequest motive for savings is of little importance, the young and the old thus tend to have a
low savings rate, where the highest savings rates are recorded by people who are at or around the peak of their
earnings. This idea has been captured in the empirical work using the variables, dependency ratios; where a
decline in savings would be expected in response to an increase in the variable. It is also this idea that has led to
the projection of a downward trend in savings in the near future, due to the ageing of the population, declining
birth rates and increasing life expectancy. Hence, life expectancy is an important determinant of savings. As
stated earlier, Browning and Crossley (2001) and Attanasio (1999) supported the idea that the life cycle model
described above provides a general framework that cannot include every variable affecting both consumption
decisions and savings decisions. In addition to the variables captured by life cycle hypothesis above, other
factors to be included in the model can be explained through the Keynesian macroeconomic framework where
the relationship that exists between savings and consumption and income are developed.
111
6. Journal of Economics and Sustainable Development
ISSN 2222-1700 (Paper) ISSN 2222-2855 (Online)
Vol.4, No.18, 2013
www.iiste.org
This is known as the random-walk hypothesis. In order to capture the saving behviour under uncertainty, Hall
(1978) start the simple equation with the Keynesian consumption function that an individual’s saving in period t
is the difference between income and consumption (saving) in period t
(5.1)
Yt = C t + S t
Thus,
(5.2)
S t = A0 + Yt − Ct
From equation 7.1, if
S t = A0 + Yd t − C t
Any change in Yt must resolve itself some part of a change in C and some part a change in S.
T
1
Hence, S = ( Y − 1
Y )−
A
t
t
T
∑
t
(5.4)
0
T
T =1
(5.3)
Thus, this means that saving is high when income is high relative to its average – that is when transitory income
is high. Similarly, when current income is less than permanent income, saving is negative. Thus, individual uses
saving to smooth the path of consumption. This is the key idea of the life-cycle/permanent hypothesis of
Modigliani-Brumberg (1954) and Friedman (1957). Friedman's (1957) celebrated permanent-income hypothesis
as well as the life-cycle hypotheses of Modigliani and Brumberg (1954) and Ando and Modigliani (1963) were
partly a response to this empirical puzzle. Hall (1978) addressed this issue using the life-cycle/permanent-income
hypothesis, which assumes that capital markets are perfect, the interest rate is vary over time, and consumers
have rational expectations regarding the income- generating process. Given this framework, he showed that
consumption follows a random walk, that is, it will have a time trend around which it will fluctuate. This can be
explained intuitively as follows. While a consumer's earnings fluctuate over his lifetime, if capital markets are
perfect and there is uncertainty about the rate of interest, then by borrowing and lending, a consumer will smooth
out his consumption stream evenly over his lifetime. Therefore, to describe the saving behaviour, we assume an
individual consumption optimality given the information available, and assume that he/she will chose
consumption in each future period.
for t=2, 3, . . . ,T .
(5.5)
S t = E 1 [ C t ],
T
T
∑
E 1[C t ] = A0 +
t =1
St =
∑
(5.6)
E 1 [Y t ]
t =1
1
( A0 +
T
T
∑
E 1 [Y t ] )
(5.7)
t =1
This equation implies that individual consumes 1/T of his or her expected lifetime income. Equation (5.7) then
means that the expectation of an individual in equals St. More generally, expected next period consumption
(saving) equals current consumption (saving). This implies that changes in consumption (saving) are
unpredictable. Hence, we can write
(5.8)
C t = E t −1 [ C t ] + et
Where,
et is a variable whose expiation as of period t-1 is 0. Thus since, E t −1 [ C t ] = C t −1 , we have
(5.9)
C t = C t −1 + et
This equation is the Hall’s equation that life-cycle/permanent-income hypothesis implies that consumption
(saving) follows a random walk (Hall, 1978). The intuition for this result is that if consumption (saving) is
expected to change, the individual can do a better job to smooth consumption, thereby increasing their saving. In
addition this analysis is used to find what determines changes in saving, et . Consider the equation below
The first necessary condition gives the Euler equation as
St =
T
1
( A1 + ∑ E 2 [Yt ])
T −1
t=2
(5.10)
T
1
(5.11)
( A 0 + Y1 − C 1 + ∑ E 2 [ Y t ])
T −1
t=2
Where the second line uses the fact that S t = A 0 + Y t − C t thus, we can write equation (5.11) as
=
St =
1
A0 + Yt − C t +
T −1
T
∑
t=t
From equation (5.6), A 0 + Y t +
E t [Y t ] +
∑
T
t=t
T
∑
t=t
T
E t [Y t ] −
∑
t=t
E t [Y t ]
E t [Y t ] equal TCt . Thus, (5.12) becomes
112
(5.12)
7. Journal of Economics and Sustainable Development
ISSN 2222-1700 (Paper) ISSN 2222-2855 (Online)
Vol.4, No.18, 2013
St =
1
T
T C t − C t + ∑ E 2 t [Y t ] −
T −1
t=t
Where,
T
∑
t=t
E 1t [Yt ] + Z t
(5.13)
Yt − Yt − r = ∆Yt
= Yt − C 1 f
Where
www.iiste.org
(Z t ) +
1
T −1
T
∑
T
∑
E 2 [Y t ] −
t=2
t=2
E 1 [Y t ]
(5.14)
Z t represent the control variables.
Equation (5.14) states that changes in saving between each period equal the change in income, consumption and
other variables. At a more general level, the basic idea of the life-cycle/permanent-income hypothesis is a simple
insight about saving and that saving is a future consumption. Hence, anything that influence consumption will
equally affect saving. Like the consumption function, the savings function is an expression of the functional
relationship between savings and its determinants. Specifically, the saving function reflects the mirror image
relationship between income and consumption. Wealth is postulated to have a negative effect on saving.
Accumulated wealth lessens dependence on current income sources, because people can draw on accumulated
assts to maintain their consumption level.
This theoretical model is modified in several ways to obtain the empirical determinants of saving in West Africa.
First we defined the real interest rate to be vary across countries since economic policy differ from country to
country in equation (5.14). second, we assume that any variable that influence consumption and both current and
future income will have effect on saving function which will invariably determine the volume of saving at a
particular period of time.
5.2
Methodology
a.
Model Specification
In line with the specific objectives, our model specification examines the determinant of savings in West Africa
countries. Thus, the model encompasses the standard life-cycle/permanent-income hypothesis. Implicitly we
have,
Z it = α + β Χ + µ i + ε
(5.13)
From equation above, Zit is the gross domestic savings it representing each of the variables across the countries,
it
it
α is the country specific effect. It represents non-measurable net effect of omitted time invariant variables such
as political instability and persistence and it specific to each country. Χ iι is the vector of saving determinants
which are the explanatory variables across the countries over a period of time with
µi and εit being the error
term in the equation.
The multivariate specification is as follows
Model 1
Pooled Estimation (2 and 3)
gdsit = b0 + b1 growthit + b2 inf it + b3ririt + b4 totit + b5 m 2it + b6 gdppcit + b7 gbssit + b8 dependit + b9lifeit + b10 rpcy + εit
……………………………………………………………………………………………………………….(5.14)
b1 <
0 , b
2
>
0 , b
3
>
0 ,
b
4
≥ , b
5
<
0 , b
6
>
0 , b
7
>
0 , b
8
<
0
Model 2 (Policy Variables)
gdsit =α 0 + α1infit + α 2 ririt + α3 m2/gdpit + α 4 growthit + α5 rpcyit + α 6 gbsit + α 7 gdppcit + u it .(5.15)
Model 3 (Non-Policy Variables)
gbs = σ0 + δ1tot it + δ 2 deprit + δ3lif expit + u it
……………………………………………
…………
….(5.16)
Where it, is Time period t in country k, gds, is Gross Domestic saving Rate, growth is Growth Rate of Gross
Domestic Product, tot is Terms of Trade, gbss is Government Budget Surplus, m2 is Degree of Financial Depth,
gdppc is Gross Domestic Product Per Capita, inf is Inflation Rate, rir is real Interest Rate, depend is Dependency
Ratio, life is Life Expectancy, rpcy is real per capita income
6.
Estimation Procedure
The paper employs panel data estimation procedure. It has been shown that results obtained from single period
cross-country regressions suffer from a host of deficiencies such as omitted variable bias, and loss of degrees of
freedom (Islam, 1995; Caselli et al., 1997; Baltagi, 2001; Hsiao, 2003). Panel data have been proposed as a
113
8. Journal of Economics and Sustainable Development
ISSN 2222-1700 (Paper) ISSN 2222-2855 (Online)
Vol.4, No.18, 2013
www.iiste.org
better econometric technique for use in cross-country regressions because it allows for the inclusion of countryspecific and because it exploits the time series dimension of the data thereby giving greater degrees of freedom.
Other advantages of panel data over pure cross section estimation include its ability to provide richer data
quality; and by allowing for greater flexibility, panel data reduces misspecification problems which might be
present in pure cross-section regressions. Panel data also makes it possible to observe the dynamics of
adjustment5. Panel data has been the technique of choice in recent years in estimating cross-country regressions
(Islam, 1995; Caselli et al.).
Another reason for the justification of panel data method is that panel data contains large number of individuals
and is capable of reducing noise (residuals) that usually arise in a large time-series data. Lastly, panel data
generate more accurate predictions for individual outcome than time-series alone.
Model of panel data is given by:
i = 1,2………..14, t = 1980, 1981……..2006
(6.1)
Y it = X ' it β + ε i t
Where Y is the regressand and X ' is a vector of K regressors and β is the vector of coefficients to be
estimated. i is the number of cross sectional series in the model and t is a particular time period. ε is the
stochastic disturbance.
When dealing with panel data model as in 6.1 above, the existence of heteroscedasticity and autocorrelation are
inevitable. Heteroscedasticity exists when disturbances have difference variances. This can occur when studying
cross-section data where the scale of the dependent variables and the explanatory power of the model tend to
vary across observations. Autocorrelation on the other hand is usually found in time-series data. Economic timeseries often display a ‘memory’ in that variation and the regression function is not independent from one period
to the next. As a result of the of heteroscedasticity and autocorrelation in panel data model, Ordinary Least
Square (OLS) estimator that assumes the exclusion of these two disturbances is not appropriate in estimating the
true value of β and to make inference from the estimated model. In other words, based on the seemingly
presence of autocorrelation and heteroscedasticity in panel data model, the least square, nonlinear least square
and instrumental variables remain unbiased, consistent and asymptotically normally distributed but no longer
efficient estimator and hence the usual inference procedures are no longer appropriate.
However, in order to retain the efficiency property of least square in a panel data, we transformed the model.
When a model is transformed, ordinary least square is no longer the estimator, but generalized least square. The
transformation of equation (6.1) means that autocorrelation and heteroscedasticity have been dealt with. The
transformation is achieved when 6.1 is pre-multiplied by the projection matrix P where
P = X ( X ' X )
− 1
X '
Hence, 6.1 becomes P Y i t = P X ' i t β + P ε i t
(6.2)
So 6.1 has been transformed in 6.2 and can be written as
Y
*
= ( X 'β) * + ε
it
it
(6.3)
2
ε*
it becomes E (ε * ε * ') = P σ Ω P ' = σ 1 where σ Ω is the variance covariance matrix of
The variance of
the error term. In equation 6.2 Y and X* are the observed data which has been transformed. To restore the
2
2
coefficient property of β then:
b = ( X
* ' X * )
− 1
X
* 'Y
= ( X ' P ' P X ) −1 X ' P ' P Y
= ( X 'Ω
−1
) X 'Ω
-1
Y
(6.4)
Clearly 6.4 being the efficient least square of β is in contrast to the estimator of β in ordinary least square
which is just
(6.5)
b = ( X 'X ) - 1 X ' Y
The GLS estimator of β in 6.5 is the minimum (or efficient) variance linear unbiased estimator in the
generalized regression model. With this estimator, prediction about the value of b is reliable and inference can be
made from the model. One important reason of choosing GLS as the appropriate estimation techniques is that if a
good or bad fit is obtained in the model, it is of no interest, because the dependent variable Y* in 6.5 is different
from the one in 6.3. The usual R-squared often suggest that the fit of the model is improved by a correction from
heteroscedasticity, but also degraded by a correction of autocorrelation, (Greene, 2000)
Therefore, panel data estimator comprise of random and fixed effect model. Random effect model allows for
5
Baltagi (2001) and Hsiao (2003) provide comprehensive surveys of panel data econometrics.
114
9. Journal of Economics and Sustainable Development
www.iiste.org
ISSN 2222-1700 (Paper) ISSN 2222-2855 (Online)
Vol.4, No.18, 2013
random deviation of individual intercept from the mean value. It also considers the individual cross-country
effect as latent of the random variables and to formally incorporate them into the residual term of a linear model.
This method or approach allows for non-observable heterogeneity of error term.
The random estimator is written as
(6.6)
y it = α + β it χ it + µ it
yit is the dependent variable,
is the parameter of interest to be estimated χ it is the explanatory
variables which include the policy and non-policy determinants of saving. The Random effect assumes that the
term α ι τ is the sum of a common constant α and time-invariant variable µ τ that is correlated with the residual
In this case,
ειτ . Therefore, instead of treating
β
it
β it as fixed we assume that it is a random variable (consisting the cross-
country effect with a mean value of β1 (no subscript i) and the intercept value for an individual country can be
expressed as
ι = 1, 2….N
(6.7)
β1ι = β1 + ε i
Where,
ε i is a random error term with a mean value of zero and variance of σ 2 ε .
In essence, the whole West Africa countries drawing as our sample have a common mean value for the intercept
(i.e. β1 ) and the individual country differences in the intercept values of each country are reflected in the error
term
εi .
However, we consider one way error component model as indicated below
(6.8)
µ ιτ = η ι + ν it
In the one way error component model, error term
µιτ is decomposed into ηι and νit where ηι is the
individual specific effect (that captures the individual heterogeneity) and
νit is the disturbance (combined cross-
section)
Substituting equation (6.6) into (6.7), we obtain
y it = α + β τ χ ιτ + ε τ +
Where,
eit
(6.9)
= α + β τ χ ιτ + ω ιτ
ωιτ = εi + e
(6.10)
However, a panel data suitable to analyse data observed for a relatively small number of cross sectional unit is
adopted. The estimator is the generalized least square method. It allows for group-wise heteroscedasticity, crossgroup correlation and within group autocorrelation.
The Fixed Effects Model
One of the (two) most important potential sources of bias in cross-sectional econometrics is the so called
heterogeneity bias arising from unobserved heterogeneity related to both y and x. If we assume that the
unobservable element correlated with x does not change over time, we can get rid of this source of bias by
running the fixed effect model (FEM). The fixed effects model is useful in a wide variety of situations, and it can
be applied to panel data with any number of individual, cross sectional observation. Unbalanced panels, where T
differs over individuals, are no problem for the FE-estimator. Also, time-constant unobserved heterogeneity is no
problem for the FE-estimator. FE as well allow for serial autocorrelation (AR (1)), individual specific constant,
which will capture all time-constant (unobserved) characteristics. The base specification of fixed effect is of the
form:
N
Y it = ß 0 +
∑
K
γ iW it +
i=2
∑ß
k
(6.11)
X k it + ∈ it
k =1
Where the subscript i refers to countries, t refers to time, and k refers to independent variables. Yit is the vector
of saving rates,
Wit is the vector of country dummy variables,
X
k it
is the matrix of independent variables, and
∈it is the vector or errors, which are assumed to satisfy the assumption of the normal linear model. This basic
model incorporates fixed country-specific effects in the intercept term. However, the assumption that will be
made for this study will be that, the intercept and slope co-efficient are constant across time and space and the
cross term captures differences over time and individual. This approach is to disregard the space and tine
dimension of the pooled data and just estimate the usual OLS regression. Therefore, given the small number of
countries included here and the differences in their economic features, the fixed effect estimator seems to be
115
10. Journal of Economics and Sustainable Development
www.iiste.org
ISSN 2222-1700 (Paper) ISSN 2222-2855 (Online)
Vol.4, No.18, 2013
suitable for the analysis of this study as it allows for serial autoregressive of order 1, AR (1)).
7
Sources of Data
The data are to be extracted from different sources and these include African Development Indicators (ADI),
African Development Bank (ADB), International Financial Statistics (IFS) and World Development Indicator
(WDI) of various issues and the CD-ROM (2007). Specifically, data on gross domestic saving, inflation, real
interest rate, GDP per capita growth, dependency ratio, and GDP growth rate will be sourced from the World
Development Indicators CD-ROM 2007. Data on terms of trade and government budget surplus will be sourced
from the African Development Bank of various years. Data on financial depth used as proxy for money supply
will be sourced from various issues of the IFS year book.
8.
Discussion of Empirical Results
Pooled estimation result, result for the policy and non-policy result, the R-squared for the fixed effect estimator
reveals that the explanatory variables used accounted for 74%, 74% and 70% respectively while the OLS for the
pooled estimation accounted for 68% of the variation in the volume of savings behaviour in West Africa within
the period under review in the pooled estimation result. Specifically, the result of both cross-country fixed effect
estimator and OLS reveal the non-significance of real per capita GDP, growth rate of GDP, terms of trade,
government budget surplus/deficit and financial depth (M2) inflation rate was significant in the OLS and nonsignificant in the fixed effect estimator, to the determination of saving in West Africa. Their coefficient is
however correctly signed, although except in the case of real per capita GDP and terms of trade.
From the result depicted in the table above, in line with a prior expectation, the result shows a negative (-0.07)
but statistically insignificant dependency ratio for pooled and non-policy variables estimated. This result shows
that dependency ratio is not an important determinant of savings in West Africa. In the study conducted by
Schmidt-Hebbel, Webb and Corsetti (1992) they found positive (0.48) relationship between dependency ratio
and saving rate but not significant and Masson et al (1998) also found but non-significant.
Surprisingly, the results for TOT is negative (-0.02) and statistically insignificant in the pooled estimation result
while it is positive (0.03) and non-significant in the non-variables estimated result. The relationship between the
terms of trade change and saving rate suggesting that private agents increase saving when faced with higher
future real incomes as a result of terms of trade deterioration. Private agents in West Africa seems to consider
terms of trade deterioration as a permanent (negative) shock and their attempts to smooth consumption in face of
such perceived shocks lead to an increase in domestic saving. The result supported the Laursen-MetzlerHarberger which states that deterioration in the terms of trade in the economy. Although Masson et al (1998)
reported a positive and non-significant relationship. However, a negative sign in the terms of trade can be
attributed to the unfavourable trade in the West Africa countries as most of their goods are being imported from
the advanced countries.
Inflation rate which is used as a proxy for macroeconomic instability has a positive (0.02) and (0.07) for both
pooled and policy estimation result respectively, though with small effect, and statistically significant. This
result is consistent with the precautionary motive, suggesting that increased macroeconomic uncertainty induces
people to save a larger proportion of their incomes. This is particularly true for people in developing countries
such as West Africa whose income prospects are more uncertain than their counterparts in developed countries.
While one might be tempted to conclude that inflation stabilization could have an adverse effect on saving, it is
important to keep in mind that stabilization also affects saving through other channels that are likely to more
than compensate for any negative direct effect of inflation. In this regard, our result shows that lower inflation
raises growth which in turn increases saving in West Africa. This implies that the character of the
macroeconomic environment does not have impact on saving rate in West Africa. Loayza, Schmidt-Hebbel and
Serven (2000) found a positive and statistically significant relationship between saving and inflation in their
study while Schmidt-Hebbel, Webb and Corsetti (1992) found a negative (-0.14) and non-statistically significant
relationship.
The result of the estimate above also shows that the real per capita GDP growth rate has a negative (-0.01)
coefficient but statistically insignificant. This implies that an increase in income growth of the people (according
to permanent income hypothesis) in West Africa does not have any effect in their saving ability. This suggests
that an increase in income has a negative effect on saving in West Africa. This attitude can be traced to the
attitude of the people, openness in the economy and the financial institution efficiency. In this case, people may
decide to hold the increase in income in liquid form. The results also support the hypothesis of a quadratic
relationship between the saving rate and per capita income.
The ratio of M2/GDP is used as a proxy for financial depth in the economy as well as a degree of financial
development reveal that M2/GDP has a positive (0.03) coefficient but statistically insignificant as suggested by
Loayza, Schmidt-Hebbel and Serven (1999). This shows that financial system development in West Africa is not
116
11. Journal of Economics and Sustainable Development
www.iiste.org
ISSN 2222-1700 (Paper) ISSN 2222-2855 (Online)
Vol.4, No.18, 2013
enough to increase saving in the region. This may be due to uncertainty in the financial system as a result of
bankruptcy, low form of financial system and ignorance of people about saving.
Turning to the fiscal variable, government budget surplus has a positive (0.14) and (0.13) respectively for both
pooled and policy result estimated and insignificant effect on saving in West Africa. This point to the fact that
the Ricardian Equivalence Principle does hold in the case of developing countries such as West Africa. Thus
accepting the Ricardian theory in the case of West Africa country. The findings are also in line with those
obtained by Chete (1999) in the case of Nigeria.
The simple permanent-income theory predicts that higher growth (that is, higher future income) reduces current
saving. But in the life cycle model growth has an ambiguous effect on saving, depending on which agent benefit
most from income growth. Contrary to the postulation of the Life-Cycle Model, the income growth result below
is positive (0.05) and statistically insignificant. This result is interesting given that it does not conform to those
obtained from earlier studies by Loayza, Schmidt-Hebbel and Serven (2000) for developing countries. West
Africa experience seems to provide support for the simple permanent income theory which predicts that higher
growth (i.e. higher future income) could reduce current saving. In other words, at sufficiently high rates of
economic growth, the aggregate saving rate may decrease if the lifetime wealth of the young is high enough
relative to that of their elders.
Also, from the table below real interest rate though has small and negative (-0.06) coefficient but statistically
insignificant.
Summary of Empirical Results
Variables Used
Pooled estimation result
Policy variables result
(fixed effect result(fixed effect result)
corrected for serial
autocorrelation)
GDPPC
0.01
-0.01
(0.03)
-(0.02)
GROWTH
0.05
0.07
(0.17)
(0.27)
INT
-0.06
-0.06
-(1.44)
-(1.42)**
INFL
0.02
0.07
(0.69)
(3.18)
M2
0.03
0.03
(1.0)
0.87)
GBSS
0.14
0.13
(0.14)
(1.33)**
TOT
-0.02
(0.49)
DEPR
-0.07
-(1.57)
LIFEXP
-0.00
-(0.25)
R-squared
0.74
0.74
Adjusted R-squared
0.71
0.71
F-statistics
22.91
27.13
Note: The dependent variable is the gross domestic saving. t-Statistics are
paratheses(**) signifies the significant variables at 10%.
Source: Author’s computation from the panel estimation result.
Non-policy variables
result (fixed effect
result-corrected for
serial autocorrelation)
0.03
(1.39)
-0.07
-(1.57)
-0.00
-(0.25)
0.70
0.68
45.46
in bracket and those in
9.
Summary, Conclusions and Policy Implications
Since the early 1990s the saving rate has been in steep downtrend. This decline can be explained by the variables
estimated in the present study, which determine long-term saving behaviour. As the model shows, the growth
rate of GDP, though increases savings in West Africa, but was too low to increase savings substantially. The
most powerful determinant of saving over the long run is economic growth as purported by the life-cycle
hypothesis . According to this view, West Africa’s chronically low rate of saving is primarily the consequence,
more than the cause, of the region's history of low and volatile economic growth. The terms of trade in recent
years has reduced savings in West Africa. The GDP per capita was equally too low to increase savings in West
Africa. The interest rate, inflation and degree of financial depth all decline savings in West Africa.
117
12. Journal of Economics and Sustainable Development
www.iiste.org
ISSN 2222-1700 (Paper) ISSN 2222-2855 (Online)
Vol.4, No.18, 2013
In West Africa, real per capita income level has negative impact on saving rate and not significant which
indicates that people tend to save a lower percentage of their GDP, While negative dependency ratio tends to
support the life-cycle hypothesis. Demographic trends are also likely to have an impact on saving rates. The baby
boom generation, currently enjoying a high income and net savings, will retire from working life in the next few
decades. Since saving rates dip in old age and the ratio of the working population to pensioners is shrinking, a
decline in the private saving rate should be expected in the long run. Although global capital markets are closely
integrated with each other and a smaller domestic supply of capital can be offset by foreign capital flows, it
should be borne in mind that other developed countries are also faced with similar demographic aging processes
(Bloom and Canning, 2004).
The main conclusion that emerged from this analysis was that cross country variation in both the saving rate and
the responsiveness of saving to those variables could be systematically explained by the country’s level of
income. The growth rate of gross domestic savings has been so low in West Africa countries since 1980.
Though the savings rate rose from 4.4 percent in the period 1980-1984 to 11.9 percent in the period 2005-2006,
it’s too low to finance investment in order to drive the economic growth. The decline or low level of saving in
West Africa can be explained by the variables estimated in the present study, which determine saving behaviour.
Policy Implications
This study has explored the determinants of savings rate in West Africa. The results in terms of the direction of
impact of the hypothesized determinants turned out a mixed-bag across the three samples. The main important
cautionary note that must be sounded is the need for the authorities to be wary of adapting and implementing
policies without subjecting the data of the targeted economy to empirical test. Consequently, country
peculiarities should be the supreme consideration guiding the decision to embrace a particular policy initiative
direction. Hence, the important policy implication is that the schemes designed to motivate savings should
incorporate the level of development of the economy. The conventional policy measures used to increase savings
such as higher levels and faster growth of income, and lower real interest rate and inflation rates are only
effective in industrial countries. Therefore, in formulating policies geared towards increasing savings, policy
makers in West Africa countries should not simply adopt policies designed for industrial countries.
The establishment of new and more sophisticated financial markets and adaptation of new instruments are
crucial in increasing savings rates in developing countries especially in West Africa. Two factors were found to
be the significant determinants of savings rates in these countries: dependency ratio and real interest rate. The
lack of well-functioning financial markets and instruments that satisfy various needs cause the citizen to be
perceived as future support and financial wealth to be held in terms of money. Adopting a financial liberalization
program to promote development will assist people in these countries to channel savings to financial instruments
and enhance savings rates for investment and growth.
The negative relationship between real per capita GDP and savings rates in developing countries like West
Africa countries should not suggest that higher savings rates result from lower income levels. To our
understanding, there is a threshold trend income level beyond which increases in income are channeled to
savings leading to higher savings rates. In countries with per capita income below this threshold, increases in
trend income are used for consumption by these relatively impoverished households resulting in lower savings
rates.
References
African Development Indicators. (2007). Spreading and Sustaining Growth in Africa. The World Bank:
Washington, D. C.
Alvarez-Cuadrado, F and Long, V. N. (2008). Relative Income Hypothesis. Center for Inter-University’s
Research Analysis, Scientific Series, July.
Aron, J and Muellbauer, J. (2000). Personal and Corporate Saving in South Africa. The World Bank Economic
Review. Vol. 14. N0.3 September. 509-544.
Aryeetey, E. (1995). Saving Among the Rural Poor in Ghana. African Journal of Economic Policy. Vol. 2.No. 2
December. pp.55-69
Baliamoune, M. N and Chowdhury, A .R. (2003). The Long run Behaviour and Short run Dynamics of Private
Saving in Morocco. Saving and Development Quarterly Review. Vol. XXVII. No. 2. pp.135-160.
Browning, M. and Lusardi, A. (1996). Household Saving: Micro Theories and Micro Facts. Journal of Economic
Literature. Vol. 34 pp.1797-1855.
Chete, L.N. (1999). Macroeconomic Determinants of Private Savings in Nigeria. NISER Monograph Series 7.
Dayal-Ghulati, A. and Thimann, C. (1997). Saving in Southeast Asia and Latin America Compared: Searching
for Policy Lessons. IMF Working Paper 97/110.
Deaton, A. (2005). Franco Modigliani and the Life Cycle Theory of Consumption. Research Program in
118
13. Journal of Economics and Sustainable Development
www.iiste.org
ISSN 2222-1700 (Paper) ISSN 2222-2855 (Online)
Vol.4, No.18, 2013
Development Studies and Center for Health and Wellbeing. Princeton University. 17-18 March.
Deaton, A. (1992). Saving and Income Smoothing in Cote d’Ivoire. Journal of African Economies, Vol. 1. No. 1
pp.1-24.
Elbadawi, I. A and Mwega, F. M. (2000). Can Africa’s Saving Collapse Be Reversed? The World Bank
Economic Review. Vol. 14. N0.3 September. pp.415-444.
Feldstein, M and C. Horioka. (1980). Domestic Saving and International Capital Flows. Economic Journal. Vol.
90. June. pp.314-329.
Fry M .J. (1980). Saving, Investment, Growth and Cost of Financial Repression. World Development. Vol. 8 No
1 pp. 317-327.
Jappelli, T. (2005).The Life-Cycle Hypothesis, Fiscal Policy, and Social Security. Center for Studies in
Economics and Finance Working Paper No. 140. May.
Jappelli, T and Pagano, M. (1998).The Determinants of Saving: Lesson from Italy. Centre for Studies in
Economics and Finance Working Paper No. 1 March)
(1994). Savings, Growth and Liquidity Constraints. Quarterly Journal of Economics, Vol. 109, pp.83109.
Lahiri, A. (1989). Dynamics of Asian Savings: The Role of Growth and Age Structure”, IMF Staff Paper, Vol.
36. Pp. 228-261.
Loayza, N. K and Shanker, R. (2000). Private Saving in India” The World Bank Economic Review. Vol. 14.
N0.3 September. pp.571-596.
Loayza, N. K., Schmidt-Hebbel, K. L. and L. Servén. (2000). Saving in Developing Countries: An Overview.
The World Bank Economic Review. Vol. 14. N0. 3. September. pp. 393-414.
(1999). What Drives Saving Across the World?. In: Schmidt-Hebbel, L., Serven, L. (Eds.), The
Economics of Saving and Growth. Cambridge University Press, Cambridge.
(2000). What Drives Private Saving Across The World. The Review of Economics and Statistics. Vol.
82, N0. 2. May. pp. 165-181.
Lusardi, A. (1999). Permanent Income, Current Income and Consumption: Evidence from Two Panel Data Sets.
Journal of Business and Economic Statistics, Vol. 14 pp.81-90.
Masson, P. R., Bayoumi, T. and Samiei, H. (1998). International Evidence on the Determinants of Private
Saving. The World Bank Economic Review. Vol. 12. No.3 September. pp.483-501.
Matsheka, T. C. (1998). Interest Rate and the Saving-Investment Process in Botswana.African Review of Money,
Finance and Banking, No. 1-2. pp.5-23.
Mikesell, R. F and Zinser, J. E. (1973). The Nature of the Savings Function in Developing Countries: A Survey
of the Theoretical and Empirical Literature. Journal of Economic Literature, Vol. 11, No.1. pp.1-22.
Mwega, F. (1997). Saving in Sub-Saharan Africa: A Comparative Analysis. Journal of African Economies .Vol.
6. No3. Supplement. pp.199-228.
Ndanshau, M. O. (1998_. Life Cycle Hypothesis of Savings: Empirical Evidence from Rural Household in
Tanzania. African Journal of Economic Policy. Vol. 5. No. 2 December. pp.55-71.
Odhiambo, N. M. (2007). The Determinants of Savings in South Africa : An Empirical Investigation. Vol. 9.
Issue 2. pp.37-52.
Ogaki, M., Ostry, J. D and Reinhart, C. M (1996). Saving Behaviour in Low-and Middle –Income Developing
Countries: A comparison. Staff Papers, International Monetary Fund, Vol. 43. No.1, March, pp.38-71.
Olusoji, M.O. (2003). Determinants of Private Savings in Nigeria: An Error Correction Approach. NDIC
Quarterly. Vol.13. September. pp.85-96
Ozcan, K.. M., A. Gunay and S. Ertac. (1998). Determinants of Private Savings Behaviour in Turkey. University
of California Publication.
Ozcan, K.. M. (2000). Determinants of Private Savings in the Arab Countries, Iran and Turkey. University of
Bilkent. February.
Sarantis, N. and C. Stewart. (2000). Saving Behaviour in OECD Countries: Evidence from Panel Cointegration
Tests. A Paper Presented at the Money, Macro and Finance Research Group Annual Conference, South Bank
University, London, September .
Schimdt-Hebbel, K., Webb, B. S. and Corsetti, G. (1992). Household Saving in Developing Countries: First
Cross-Country Evidence. The World Bank Economic Review. Vol. 6, No. 3. pp.529-547
Uremadu, S. O. (2007). Core Determinants of Financial Savings in Nigeria: An Empirical Analysis for National
Monetary Policy Formulation. International Review of Business Research Papers. Vol. 3. No. 3 August. pp.356367.
World Bank Development Indicators 2007
119
14. This academic article was published by The International Institute for Science,
Technology and Education (IISTE). The IISTE is a pioneer in the Open Access
Publishing service based in the U.S. and Europe. The aim of the institute is
Accelerating Global Knowledge Sharing.
More information about the publisher can be found in the IISTE’s homepage:
http://www.iiste.org
CALL FOR JOURNAL PAPERS
The IISTE is currently hosting more than 30 peer-reviewed academic journals and
collaborating with academic institutions around the world. There’s no deadline for
submission. Prospective authors of IISTE journals can find the submission
instruction on the following page: http://www.iiste.org/journals/
The IISTE
editorial team promises to the review and publish all the qualified submissions in a
fast manner. All the journals articles are available online to the readers all over the
world without financial, legal, or technical barriers other than those inseparable from
gaining access to the internet itself. Printed version of the journals is also available
upon request of readers and authors.
MORE RESOURCES
Book publication information: http://www.iiste.org/book/
Recent conferences: http://www.iiste.org/conference/
IISTE Knowledge Sharing Partners
EBSCO, Index Copernicus, Ulrich's Periodicals Directory, JournalTOCS, PKP Open
Archives Harvester, Bielefeld Academic Search Engine, Elektronische
Zeitschriftenbibliothek EZB, Open J-Gate, OCLC WorldCat, Universe Digtial
Library , NewJour, Google Scholar