A comparative study of woody plant species diversity at adey amba enclosed forest and nearby open site in west belessa district, northwestern ethiopia
•
1 like•637 views

The International Institute for Science, Technology and Education (IISTE). Science, Technology and Medicine Journals Call for Academic Manuscripts

Recommended
Recommended
More Related Content
What's hot
What's hot (17)
Viewers also liked
Similar to A comparative study of woody plant species diversity at adey amba enclosed forest and nearby open site in west belessa district, northwestern ethiopia
Similar to A comparative study of woody plant species diversity at adey amba enclosed forest and nearby open site in west belessa district, northwestern ethiopia (20)
More from Alexander Decker
More from Alexander Decker (20)
Recently uploaded
Recently uploaded (20)
A comparative study of woody plant species diversity at adey amba enclosed forest and nearby open site in west belessa district, northwestern ethiopia
- 1. Journal of Biology, Agriculture and Healthcare www.iiste.org ISSN 2224-3208 (Paper) ISSN 2225-093X (Online) Vol.4, No.15, 2014 74 A Comparative Study of Woody Plant Species Diversity at Adey Amba Enclosed Forest and Nearby Open Site in West Belessa District, Northwestern Ethiopia Wondie Mebrat1 *, Eyayu Molla2 and Temesgen Gashaw3 1.Department of Biology, Adigrat University, Ethiopia 2.College of Natural and Computational Science, Vice president of Bahir Dar University, Ethiopia 3.Department of Natural Resource Management, Adigrat University, Ethiopia *Corresponding Author: wondieayele66@gmail.com Abstract The study was carried out to evaluate woody species diversity comparatively on enclosed forest and open site in North Western highlands of Ethiopia. Systematic sampling method was used to collect vegetation data from 36 quadrants. Each quadrant has 20 m x 20 m size with an interval of 100 m which was laid along four transect lines. Within each quadrant, vegetation data such as seedlings, saplings and tree species were directly counted from both open and enclosed sites. The counted and recorded trees, saplings and seedlings of each species were marked with dyes to avoid confusion. Shannon-Wiener and Simpson’s diversity index were applied to quantify species diversity, richness and evenness. The result showed that sapling and seedling diversity was very high from enclosure site. These imply the enclosure was at high rate of regeneration. Keywords:, Woody species, diversity, enclosure, open site 1. Introduction In many countries such as Greenland, Egypt and Pakistan, the natural forest coverage accounts less than 5% of the land. On the other hand, in a few places like Suriname and French Guinea natural forests cover more than 90% of their area, which accounts about 30% of the world total natural vegetation cover (FAO, 2006; Gorta and Sheikh, 2010). These diversified forests are found in different parts of the world and they are used to meet the basic needs of the forest dependent communities (Murthy et al., 2002). They play an indispensible role in the protection of environment, regulating climate, controlling water runoff, maintaining ecological balance and producing valuable materials such as timber for construction and furniture, extraction of chemicals, paper and pulp. Furthermore, they have paramount role in purifying the air, serving as a habitat for wild animals and have aesthetic value (Mesfin, 2004). Apart from ecological values, forests are also significantly important for the economy of many tropical and sub-tropical countries (Taye, 2006) Despite their economic, social and environmental welfare of the world, the diversity of woody plant species is being threatened because of ever increasing population pressure and its associated effects such as deforestation and expansion of agricultural lands that caused overall environmental degradation. According to FAO (2006), forest resources are declined world wide by 0.22% per year in the period 1990-2000 and by 0.18% per year between 2000 and 2005 due to different natural and anthropogenic factors. These results in a rapid decline of forest ecosystems and increased the extinction of plant and animal species. Especially Ethiopia is a mountainous country characterized by great geographic diversity with rugged mountains, flat topped plateaus and deep gorges (Tewoldeberhan, 1988). These diversified topographic features made the country richest in flora of tropical Africa (Tolera et al., 2008). As a result, Ethiopia is considered as the center of origin and the richest in plant species diversity (Mesfin, 2004). However, these rich forest resources are highly declined due to rapid and continuous deforestation activities. Changes in land use mainly through the conversion of natural vegetation to agricultural lands and settlement are the main causes for this rapid deterioration of forest areas in the country (Eyayu et al., 2009). For instance, some reports in the country indicated that at the beginning of the 20th century, 40 percent of the country was covered with a natural forest. This larger sized forest declined to 16 percent in 1950s and to less than 3 percent at the end of the century (Mesfin, 2004). Hundreds of years exploitative traditional land use aggravated by high human and livestock population pressure lead to cultivate sloppy lands and over exploit slowly renewable resources in the region (Eyayu et al., 2009). These expansions of agricultural lands to marginal areas at the expense of forest lands have been documented by some studies such as that of Gete and Hurni (2001), Woldeamlak (2002) and Eyayu et al. (2009). The problem is also common in the North Gondar zone, where forests are fragmented into patches and strips of hills (Alemayehu, 2003). Thus, assessment of plant diversity is important to evaluate the success of conservation activities and design management plans for the future. Therefore, the study aims to assess woody species composition and dynamics of plant communities in enclosed and open site of West Belessa District.
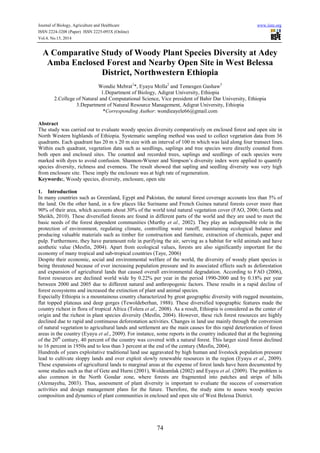
- 2. Journal of Biology, Agriculture and Healthcare www.iiste.org ISSN 2224-3208 (Paper) ISSN 2225-093X (Online) Vol.4, No.15, 2014 75 2. Materials and methods 2.1 Study area The study site, Adey Amba enclosed forest (12o 31’ - 12o 33’ N and 37o 39’ - 37o 41’ E) is situated in Northwestern Ethiopia. The forest cover 680.75 hectare. Its altitude ranges from 2090 - 2603 m.a.s.l (Figure 1). Topographically, the area is mountainous at the upper limit to plain in the lower limit. The mean annual rainfall and temperature ranges from about 700 - 900 mm and 12o C - 37o C respectively. Figure 1: Location of the study area Agriculture is the major economic activity in the district and the country at large which is characterized by rain- fed and predominantly subsistence nature. As a result, most woody plants have been destroyed due o the expansion of agricultural lands by the growing population. Some of the existing remnant forests were mainly found around the mountain ridges, steep slopes, churches and in enclosure areas. Among these Adey Amba is part of an enclosure have high plant species varieties. After the establishment of enclosure and protected from human and livestock interference, it is now becoming rich in plant species diversity. The dominant tree species currently seen in the enclosure were Olea europaeana subsp. cuspidata, Combretum molle, Allophyllus abyssinicus, Acokanthera schimperi, Acacia seyal and Croton macrostachyus and the shrub species were Dodonaea angustifolia, Calpurnaea aurea, Euclea schimperi, Phyllanthus ovalifolius and Carisa edulis, but diversity was highly variable in open and enclosed sites. Figure 2: Part of open sites (Source: Field photo by Wondie Mebrat, 2011)
- 3. Journal of Biology, Agriculture and Healthcare www.iiste.org ISSN 2224-3208 (Paper) ISSN 2225-093X (Online) Vol.4, No.15, 2014 76 Figure 3: Part of protected area (Source: Field photo by Wondie Mebrat, 2011) 2.2 Vegetation data collection To collect vegetation data, systematic sampling method was employed because of the need to ensure sufficient representative data from all altitudinal gradients in the enclosure and open site. 36 sample quadrants were employed for each site. Each sample quadrant was 20 m x 20 m placed next to each other at an interval of 100 m between each quadrant in four vertical transect lines. Then, the number of individual sapling, seedling and tree species was directly counted following the methods employed by Kibret (2008). The counted and recorded trees, saplings and seedlings of each species were marked with dyes to avoid confusion. By using such information, the study analyses the woody species diversity, abundance, evenness and relative frequency. All woody plants within the sample quadrants were pressed, identified and recorded by their vernacular names. The identification was done mainly based on the works of Edwards and Hedberg (1989), Edward et al. (1995), Edward et al. (1997), Hedberg et al. (2003) and Azene (2007). 2.3 Vegetation data analysis Species Diversity For measuring the diversity and evenness of woody plants, Shannon-Wiener’s Diversity Index and Simpson similarity index (Hayat and Kudus, 2010) were used. Shannon-Wiener’s Diversity Index Shannon-Wiener diversity index was a commonly used index to measure woody species diversity (Spellerbergs and Fedor, 2003). It accounts for both the diversity and evenness of woody species in the enclosure and open site. Diversity: Shannon-Wiener diversity index was calculated as (Nolan and Callahan, 2006): S H’ = -∑pilnpi i=1 Evenness (equitability): Shannon-Wiener evenness index was calculated as (Holm, 1997-2005): J = H’ lnS Where, lnS is the natural logarithm of the total number of species evenness (a measure of species abundance). A value of evenness approaching zero reflects larger difference in abundance of species, where as the higher evenness value means all species are equally abundant or even their distribution within the sample quadrant. On the other hand, the higher the value of Shannon-Wiener diversity index, the more woody species diversity would be in the quadrant or the enclosure (Nangendo et al., 2002). Simpson similarity index: Simpson’s index is given (Hayat and Kudus, 2010) by: S D = ∑ (Pi) 2 i = 1 Simpson index is often used to quantify the woody species diversity of a forest. It measures the evenness of species from 0 to 1. The greater value of “1-D” is the greater evenness. Its value increases with increase in the number of species and the distribution of the individuals among the species becomes even (Kibret, 2008). 3. Results and Discussions 3.1 Woody Species Composition In this study, a total of 56 woody plant species, representing 27 families were recorded in the study area both inside and outside the study quadrant (Table 1). Among these, 6 plant species were identified outside the sample quadrants and the rest 50 plant species were recorded in 36 quadrants of the study area. Among identified plants Fabaceae family represented by 12 woody species (21.428%) was found dominant, followed by Euphorbiaceae represented by 5 species. The total recorded woody species in the study quadrats were natural plants.
- 4. Journal of Biology, Agriculture and Healthcare www.iiste.org ISSN 2224-3208 (Paper) ISSN 2225-093X (Online) Vol.4, No.15, 2014 77 Table 1: List of woody species with their corresponding number of families in the enclosure No Family Number of species Percentage (%) 1 Fabaceae 12 21.428 2 Euphorbiaceae 5 8.928 3 Oleaceae 3 5.357 4 Rubiaceae 3 5.357 5 Tiliaceae 3 5.357 6 Anacardiaceae 3 5.357 7 Celastraceae 2 3.571 8 Moraceae 2 3.571 9 Sapindaceae 2 3.571 10 Sterculiaceae 2 3.571 11 Apocynaceae 2 3.571 12 Burseraceae 2 3.571 13 Meliantaceae 1 1.786 14 Gutiferie 1 1.786 15 Araliaceae 1 1.786 16 Orchidaceae 1 1.786 17 Asteraceae 1 1.786 18 Buddlejaceae 1 1.786 19 Cupressaceae 1 1.786 20 Thymelaceae 1 1.786 21 Lamiaceae 1 1.786 22 Rosaceae 1 1.786 23 Santalaceae 1 1.786 24 Capparidaceae 1 1.786 25 Cactaceae 1 1.786 26 Verbanaceae 1 1.786 27 Eubenaceae 1 1.786 Total 56 100.00 On the other hand, in the open site adjacent to the enclosure 24 woody plant species were recorded. They belong to 15 families, of which Fabaceae was the dominant family represented by 4 species followed by Anacardiaceae with 3 species (Table 2). The difference observed in woody species composition between the two sites showed the positive effect of area enclosure on woody plant species restoration. According to Kibret (2008), the reduction of species diversity in the open site could be an indication of increased vulnerability of the plant species by animals and/or humans’ intervention at maturity or early stage of regeneration. This might indicate that individuals in the open sites either harvested at their early age by the local inhabitants and/or their domestic animals or unable to resist the harsh environmental conditions such as water shortage due to extensive soil degradation in the open sites of the study area. Table 2: List of woody species with their corresponding number of families in the open site No Family Number of species Percentage (%) 1 Fabaceae 4 16.6 2 Anacardiaceae 3 12.4 3 Sapindaceae 2 8.3 4 Oleaceae 2 8.3 5 Burseraceae 2 8.3 6 Moraceae 2 8.3 7 Celastraceae 1 4.2 8 Eubenaceae 1 4.2 9 Lamiaceae 1 4.2 10 Verbanaceae 1 4.2 11 Capparidaceae 1 4.2 12 Apocynaceae 1 4.2 13 Euphorbiaceae 1 4.2 14 Boraginaceae 1 4.2 15 Apocynaceae 1 4.2 Total 24 100.0
- 5. Journal of Biology, Agriculture and Healthcare www.iiste.org ISSN 2224-3208 (Paper) ISSN 2225-093X (Online) Vol.4, No.15, 2014 78 3.2 Species Diversity, Richness and Evenness Based on the Shannon-Wiener and Simpson diversity index the calculated value of species diversity and evenness in the enclosure were 2.974 and 0.923 respectively (Table 3). According to Kent and Coker (1992), Shannon-Wiener index value varies between 1.5 and 3.5 and rarely exceeds 4. Thus, in accordance with Kent and Coker (1992) ratings the result of the present study showed that the Adey Amba enclosure forest has an even species distribution. This result was also in agreement with the studies of Kibret (2008) in the Kallu Woreda forest of southern Wello. However, in the open sites adjacent to the enclosure the Shannon-Wiener diversity and evenness indices were 1.82 and 0.48 respectively, indicating lower species diversity in the open sites than the enclosure forest. This could result from repeated habitat disturbances in the open sites due to frequent and intensive interference of both humans and livestock for grazing. On the other hand, the Shannon and Simpson diversity indices (1-D) for woody plant species were relatively higher in the enclosure than in the open sites (Table 3). These higher diversity indices of Shannon and Simpson indicated that there is better species diversity in the enclosure than the open sites due to protection from environmental interference. Thus, the enclosure forest has more diverse, evenly distributed and with relatively related abundance of all individuals of plant species compared to the open site. The species evenness in the enclosure was slightly higher than in the open site (Table 3). This shows that protection of the enclosed forest from human and animal disturbance helps individual plant species to have better regeneration and abundance than the open site where there is repeated human and livestock interference. Similarly, Kibret (2008) stated that as evenness compares the similarity of the population size of each of the species present that it is a measure of the relative abundance of the different species making up the richness of an area. A low value of evenness indicates that the one or a few species were highly dominant, while others were present with few individuals. The species identified in the enclosure were high in abundance and distribution than the open sites. In addition to this, in the open sites out of the 24 woody plant species almost the entire site is dominated by only six species namely Dodonaea viscosa, Senna singuiana, Maytenus arbutifolia, Euclea schimperi, Jasminum abyssinica and Otostegia integrifolia that accounted 69% of the species identified. On the other hand, the same species in the enclosure site made up of about 35.3%. This shows extreme difference in species abundance among each other due to high level of disturbance on the open site and most part of the land area was dominated by rare plant species. For instance, the species like Senna singuiana commonly grown in the open site and grazing area with a greater abundance due to its unpalatable nature by animals. So, the protection and restoration of degraded lands can significantly improve the functioning of the ecosystem though increasing the diversity of species (Kibret, 2008). Table 3: Comparison of various diversity indices of woody plant species in the enclosure forest and unprotected sites Diversity indices Enclosure Open site Shannon (H’) 2.72 1.82 Simpson diversity index (1-D) 0.0923 0.0832 Evenness (J) 0.76 0.48 Species richness (S) 50 24 The diversity index of the woody plant species life forms (i.e. trees, saplings and seedlings) is presented in Table 4. Accordingly, the mean diversity index of the three life forms was 2.72 with a maximum of 3.04 recorded as seedling and with the minimum of 2.47 recorded at the tree stage. The diversity of the sapling stage was intermediate with a value of 2.66. The result shows that there was an intermediate diversity of saplings followed by lower diversity of trees in the enclosure. On the other hand, of the three life forms, seedlings have the highest species richness, diversity and evenness than the trees. A greater difference was also seen in species richness among these plant forms where it was higher in the seedling and lower in the tree forms. Table 4: Shannon-Wiener diversity index comparison of woody plant species of the enclosed area based on their growth stages. Plant forms Richness Diversity (H’) Evenness Tree 30 2.47 0.68 Sapling 39 2.66 0.71 Seedling 44 3.04 0.80 Among the two sites seedlings in the enclosure have higher diversity (3.04) and higher evenness of woody species followed by sapling in the enclosure. In contrary, the diversity of seedling in the open site was very low relative to the enclosure. The observed difference in seedling between the two sites showed the positive effect of area enclosure on woody plant species regeneration and diversity. On the other hand, in the open sites the seedling form attained a species evenness index (J) of 0.80 showing similar seedling evenness distribution to the enclosure. The reason for this similarity was due to lower number of diversity index value of seedling forms in the open site divided by lower number of lnS, but not means both sites have equal seedling distribution. Because
- 6. Journal of Biology, Agriculture and Healthcare www.iiste.org ISSN 2224-3208 (Paper) ISSN 2225-093X (Online) Vol.4, No.15, 2014 79 the two sites seedling forms have a greater difference in diversity and species richness. However, saplings have the lowest diversity and evenness than in the tree forms. The reduction of sapling diversity and evenness in the open site is an indication of increased vulnerability of saplings by animal and/or human at their early stage, those individuals in the open site are either cut at their early age for various purposes by the local inhabitants and high vulnerability of seedlings that would be reaching into the sapling stage. Tree forms have the lowest species richness and diversity compared to seedlings and saplings in the enclosure. The least species richness and diversity can be attributed due to excessive environmental disturbance before the establishment of the enclosure and encroachment of tree species. This low tree diversity and high diversity of seedlings and saplings showed that the enclosure was at a stage of regeneration, succession and development (Table 5). Table 5: Comparison of enclosure and open site diversity, evenness and richness through Shannon-Wiener diversity index Community Enclosure Open site tree sapling seedling tree sapling seedling Diversity 2.47 2.66 3.04 1.78 1.74 2.312 Evenness 0.68 0.71 0.80 0.72 0.61 0.80 Richness 30 39 44 12 17 19 4. Conclusion The diversity and composition of woody plant species is studied in Adey Amba enclosed forest and the nearby open site. The result of the study indicated that the enclosure had high species diversity that was 56 woody species 6 outside the quadrat that belong to 27 families. Among these Fabaceae is the most dominant family with 12 species, followed by Euphorbiaceae, the second dominant family with 5 woody species. In the open site also 24 woody plant species belonging to 15 families were identified. Fabaceae was also found to be dominant. Species diversity, evenness and richness were varied highly between two sites. The enclosure was more diversified and evenly distributed the variation in species diversity, richness and evenness between two sites could be due to human and livestock interference in the open site. Sapling and Seedlings were highly diversified and evenly distributed in the enclosure due to this the enclosure was at high rate of regeneration status. References Alemayehu W (2003). Opportunities, constraints and prospects of Ethiopian Orthodox Tewahido Churches in conserving forest resources: the case of churches in South Gondar. Northern Ethiopia. Edwards S and Hedberg I (1989). Flora of Ethiopia and Eritrea, Vol. 3. The National Herbarium Addis Ababa University, Addis Ababa and Department Systematic Botany, Uppsala University, Uppsala. Edwards S, Mesfin T and Hedberg I (1995). Flora of Ethiopia and Eritrea, Vol. 2(2). The National Herbarium, Addis Ababa University, Addis Ababa and Department of Systematic Botany, Uppsala University, Uppsala. Edwards S, Sebsebe D and Hedberg I (1997). Flora of Ethiopia and Eritrea, Vol. 6. The National Herbarium, Addis Ababa University, Addis Ababa and Department of Systematic Botany, Uppsala University, Uppsala. Eyayu M, Heluf G, Tekalign M and Mohammed A (2009). Effects of land use changes on selected soil properties in the Tara Gedam Catchment and Adjacent Agro-Ecosystems, Northwest Ethiopia. Ethiopian Journal of Natural Resources, 11(1): 35-62. FAO (2006). Scientific facts on forests. Green fact publisher. Gete Z and Hurni H (2001). Implications of land use and land cover dynamics for mountain resources degradation in the Northwestern Ethiopian Highlands. Mountain Research and Development, 21: 184- 191. Gorta R and Sheikh P (2010). Deforestation and climate change. Congressional research service report for congress publisher. http://www.itto.int/enlitta. Hedberg I, Edwards S and Sileshi N (1995). Flora of Ethiopia and Eritrea, Vol. 4 (1). The National Herbarium Addis Ababa University, Addis Ababa and Department Systematic Botany, Uppsala University, Uppsala. Holm P (1997-2005). Vegetation structure and diversity. ecological monitoring program report, organ pipe cactus national monument. Kent M and Coker P (1992). Vegetation description and analysis a practical approach. John Wiley and Sons, New York. Kibret M (2008). Enclosure as a viable option for rehabilitation of degraded lands and biodiversity conservation: the case of Kallu Woreda South Wello, Addis Ababa University. MSc Thesis, Addis Ababa University, Addis Ababa, Ethiopia. Mesfin G (2004). A study of land degradation and related policy measures in Ethiopia: the case of Amhara
- 7. Journal of Biology, Agriculture and Healthcare www.iiste.org ISSN 2224-3208 (Paper) ISSN 2225-093X (Online) Vol.4, No.15, 2014 80 region. MSc Thesis, Wageningen University. Murthy I, Murali K, Hegde G, Bhat P and Ravindranath N (2002). Comparative analysis of regeneration in natural forests and joint forest management plantation. Current Science, 83: 1358-1364. Nangendo G, Stein A, Gelens M, De-Gier A and Albrich R (2002). Quantifying differences in biodiversity between a tropical forest area and a grass land area subjected to traditional burning. Forest Ecology and Management, 164: 109-120. Nolan K and Callahan J (2006). Beachcomber biology: The Shannon-Weiner Species Diversity Index. Pages 334-338, in Tested Studies for Laboratory Teaching, Volume 27 (M.A. O'Donnell, Editor). Proceedings of the 27th Workshop/Conference of the association for Biology Laboratory Education (ABLE), 383 pp. Spellerberg I and Fedor P (2003). Attributed to Claude Shannon (1916-2001) and a plea for more rigorous use of species richness, species diversity and the Shannon-Wiener index. Global Ecology and Geography, 12: 177-179. Taye J (2006). Canopy gap regeneration and dynamics in the afro mountain forests of Bale Mountains. MSc Thesis, Addis Ababa University, Ethiopia. Teweldebrhan G (1988). Vegetation and environment of the mountains of Ethiopia: implications for utilization and conservation. Mountain Research and Development, 8: 211-216. Tolera M, Asfaw Z, Lemenh M and Erik K (2008). Woody species diversity in a changing landscape in the south-central Ethiopia highlands. Agriculture, Ecosystem and Environment, 128: 52-58. Woldeamlak B (2002). Land covers dynamics since the 1950s in Chemoga Watershed, Blue Nile Basin, Ethiopia. Mountain Research and Development, 22(3): 263-269.
- 8. The IISTE is a pioneer in the Open-Access hosting service and academic event management. The aim of the firm is Accelerating Global Knowledge Sharing. More information about the firm can be found on the homepage: http://www.iiste.org CALL FOR JOURNAL PAPERS There are more than 30 peer-reviewed academic journals hosted under the hosting platform. Prospective authors of journals can find the submission instruction on the following page: http://www.iiste.org/journals/ All the journals articles are available online to the readers all over the world without financial, legal, or technical barriers other than those inseparable from gaining access to the internet itself. Paper version of the journals is also available upon request of readers and authors. MORE RESOURCES Book publication information: http://www.iiste.org/book/ IISTE Knowledge Sharing Partners EBSCO, Index Copernicus, Ulrich's Periodicals Directory, JournalTOCS, PKP Open Archives Harvester, Bielefeld Academic Search Engine, Elektronische Zeitschriftenbibliothek EZB, Open J-Gate, OCLC WorldCat, Universe Digtial Library , NewJour, Google Scholar
- 9. Business, Economics, Finance and Management Journals PAPER SUBMISSION EMAIL European Journal of Business and Management EJBM@iiste.org Research Journal of Finance and Accounting RJFA@iiste.org Journal of Economics and Sustainable Development JESD@iiste.org Information and Knowledge Management IKM@iiste.org Journal of Developing Country Studies DCS@iiste.org Industrial Engineering Letters IEL@iiste.org Physical Sciences, Mathematics and Chemistry Journals PAPER SUBMISSION EMAIL Journal of Natural Sciences Research JNSR@iiste.org Journal of Chemistry and Materials Research CMR@iiste.org Journal of Mathematical Theory and Modeling MTM@iiste.org Advances in Physics Theories and Applications APTA@iiste.org Chemical and Process Engineering Research CPER@iiste.org Engineering, Technology and Systems Journals PAPER SUBMISSION EMAIL Computer Engineering and Intelligent Systems CEIS@iiste.org Innovative Systems Design and Engineering ISDE@iiste.org Journal of Energy Technologies and Policy JETP@iiste.org Information and Knowledge Management IKM@iiste.org Journal of Control Theory and Informatics CTI@iiste.org Journal of Information Engineering and Applications JIEA@iiste.org Industrial Engineering Letters IEL@iiste.org Journal of Network and Complex Systems NCS@iiste.org Environment, Civil, Materials Sciences Journals PAPER SUBMISSION EMAIL Journal of Environment and Earth Science JEES@iiste.org Journal of Civil and Environmental Research CER@iiste.org Journal of Natural Sciences Research JNSR@iiste.org Life Science, Food and Medical Sciences PAPER SUBMISSION EMAIL Advances in Life Science and Technology ALST@iiste.org Journal of Natural Sciences Research JNSR@iiste.org Journal of Biology, Agriculture and Healthcare JBAH@iiste.org Journal of Food Science and Quality Management FSQM@iiste.org Journal of Chemistry and Materials Research CMR@iiste.org Education, and other Social Sciences PAPER SUBMISSION EMAIL Journal of Education and Practice JEP@iiste.org Journal of Law, Policy and Globalization JLPG@iiste.org Journal of New Media and Mass Communication NMMC@iiste.org Journal of Energy Technologies and Policy JETP@iiste.org Historical Research Letter HRL@iiste.org Public Policy and Administration Research PPAR@iiste.org International Affairs and Global Strategy IAGS@iiste.org Research on Humanities and Social Sciences RHSS@iiste.org Journal of Developing Country Studies DCS@iiste.org Journal of Arts and Design Studies ADS@iiste.org