
Recommended
Recommended
More Related Content
Similar to Figures src1
Similar to Figures src1 (16)
Figures src1
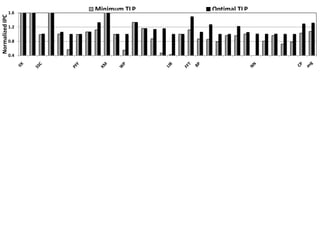
- 1. 1.6 Minimum TLP Optimal TLP Normalized IPC 1.2 0.8 0.4
- 2. C C C C C C L1 L1 L1 L1 L1 L1 On Chip Network L2 L2 L2 L2 DRAM DRAM DRAM DRAM
- 3. Application Kernel ... Kernel ... Kernel CTA … CTA … CTA Warp Warp Thread …
- 4. Active Time Ratio (RACT) 0% 100% 20% 40% 80% 60%
- 5. IPC lat_rt util 1.4 1.2 AES 1 0.8 0.6 0.4 0.2 0 1 2 3 4
- 6. IPC lat_rt util 1.4 1.2 CP 1 0.8 0.6 0.4 0.2 0 1 2 3 4 5 6 7 8
- 7. IPC lat_rt util 1.4 1.2 JPEG 1 0.8 0.6 0.4 0.2 0 1 2 3 4 5 6 7 8
- 8. 1.05 IPC lat_rt util MM 1 0.95 0.9 0.85 0.8 0.75 0.7 1 2 3 4 5 6 7 8
- 9. 1.4 Normalized IPC 1.2 1 0.8 0.6 0.4 0.2 AES MM 0 JPEG CP 1 2 3 4 5 6 7 8 Number of CTAs
- 10. 1.4 Normalized latency 1.2 1 0.8 0.6 0.4 0.2 AES MM 0 JPEG CP 1 2 3 4 5 6 7 8 Number of CTAs
- 11. 1.4 Normalized core 1.2 utilization 1 0.8 0.6 0.4 0.2 AES MM 0 JPEG CP 1 2 3 4 5 6 7 8 Number of CTAs
- 12. CTA 1 CTA 2 Core 1 CTA 3 Idle CTA 4 CTA 5 CTA 6 Core 2 CTA 7 CTA 8
- 13. Core 1 CTA 1 CTA 6 CTA 2 CTA 7 I Core 2 CTA 3 CTA 8 d CTA 4 CTA 5 l e
- 14. C_idle C_mem H L L M H L - - C_stall M - - H - : Increment n : Decrement n
- 15. 1 Relative performance 0.9 0.8 0.7 Type1 0.6 Type2 0.5 0 4 8 12 16 Number of cores turned off
- 16. 1 Relative performance 0.9 0.8 0.7 Type1 0.6 Type2 0.5 0 4 8 12 16 Number of cores turned off
- 17. 1.6 DYNCTA Optimal TLP Normalized IPC 1.4 1.2 1 0.8
- 18. 1.6 TL DYNCTA Optimal TLP Normalized IPC 1.4 1.2 1 0.8
- 19. 1.6 Round Trip Fetch Latency Core Utilization Normalized Value 1.2 0.8 0.4 0
- 20. Average n N opt RACT 4.5 1 Active time ratio (RACT) 4 0.9 Number of CTAs 3.5 0.8 3 0.7 0.6 2.5 0.5 2 0.4 1.5 0.3 1 0.2 0.5 0.1 0 0
- 21. Average n N opt RACT 9 1 Active time ratio (RACT) 8 0.9 Number of CTAs 7 0.8 6 0.7 0.6 5 0.5 4 0.4 3 0.3 2 0.2 1 0.1 0 0
- 22. Average n N opt RACT 7 1 Active time ratio (RACT) 0.9 6 Number of CTAs 0.8 5 0.7 4 0.6 0.5 3 0.4 2 0.3 0.2 1 0.1 0 0
- 23. Average n N opt RACT 9 1 Active time ratio (RACT) 8 0.9 Number of CTAs 7 0.8 6 0.7 0.6 5 0.5 4 0.4 3 0.3 2 0.2 1 0.1 0 0
- 24. Average number of CTAs 0 2 4 6 8 N DYNCTA Optimal
- 25. 1.4 DYNCTA DYNCORE with power gating DYNCORE without power gating Normalized Power 1.2 1 0.8 0.6 0.4
- 26. 3 DYNCTA DYNCORE with power gating DYNCORE without power gating 2.9 Normalized Energy 2.6 2.6 2.2 Efficiency 1.8 1.4 1 0.6
- 27. IPC power energy 2 Normalized Value 1.5 1 0.5 0 4 8 12 16 Number of Cores Turned Off
- 28. IPC power energy 2 Normalized Value 1.5 1 0.5 0 64 121 Number of Nodes in the System
Editor's Notes
- Slides 2-3-4-5 show some motivational figures. We are showing what happens to round trip latency and core utilization and IPC when we vary the number of CTAs on cores.
- This will be used in motivation section, as an illustrative example to the core utilization problem caused by executing more concurrent CTAs.
- This is used as a motivation to our power algorithm. It shows how the applications respond to turing off cores.Type 1 applications are memory intensive, Type 2 are compute intensive.We see that Type 1 applications can tolerate execution with smaller number of cores better compared to Type 2 applications.
- This is the main performance result. We are comparing the baseline, our algorithm and static best results.
- Slides 8-9 show the CTA modulation of six benchmarks over time. They are compared with the default CTA number, static best and the overall average of our algorithm over time.Secondary axis shows the ratio of active cycles to the total cycles, indicating how compute intensive that application is at that point of time.
- This figure shows the power consumption of benchmarks after we apply our power algorithm (smaller is better).First bar shows the power consumption of baseline, second bar shows the power consumption of the CTA algorithm,Third bar shows the power consumption when we can apply power gating And fourth bar shows the power consumption when there is no power gating.
- This is similar to the figure in 11. Instead of power, it is showing performance/power ratio (larger is better).So we can say that this is the energy efficiency graph.