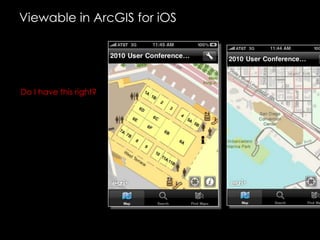
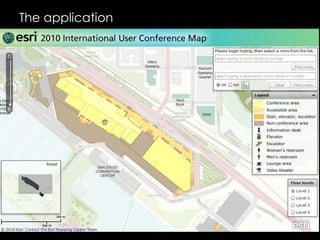
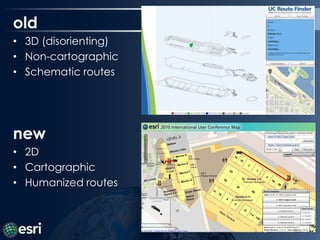
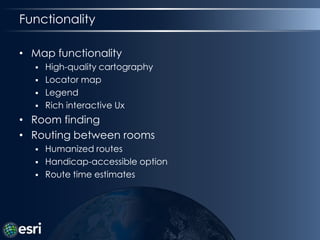
Download to read offline
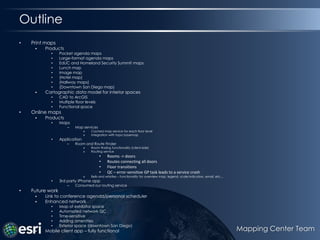
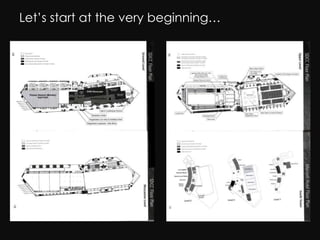
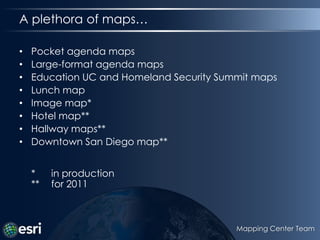
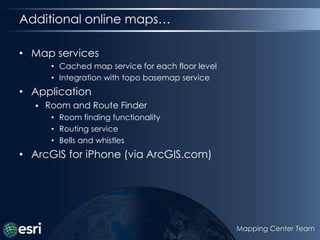
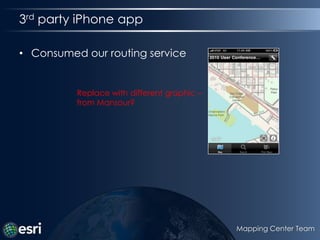
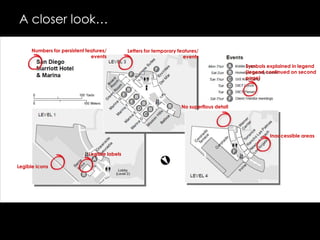
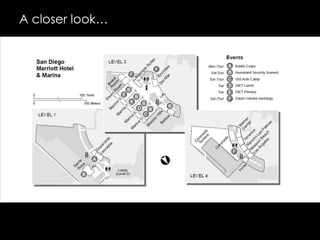
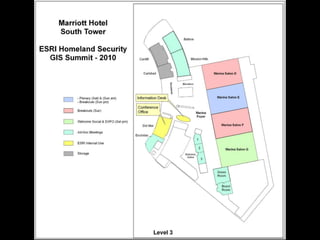
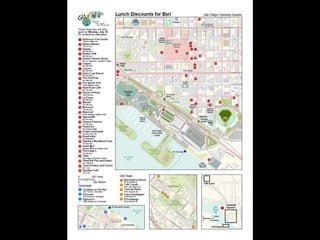
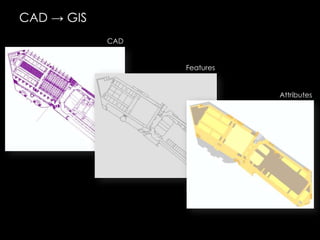
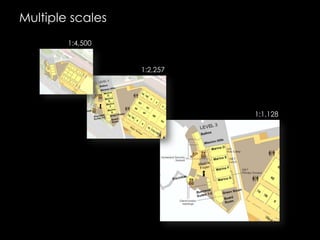
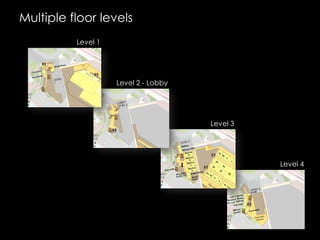
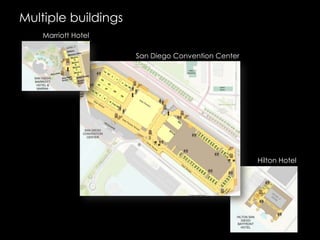
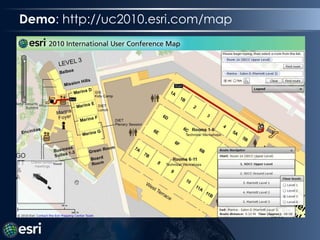
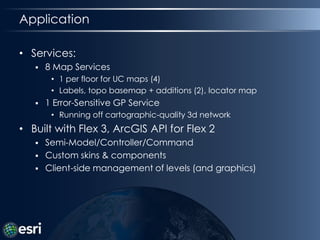
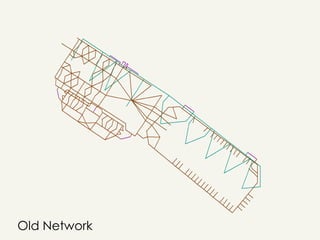
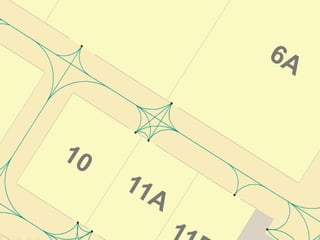


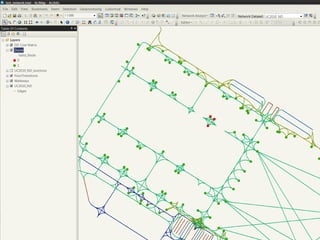

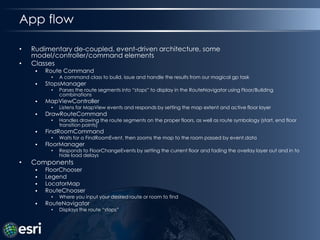

The document discusses maps created for an Esri user conference including printed maps, online maps, and a mobile application. A variety of maps were produced including agenda maps, floor plans, and a routing application. The routing application used services including cached map services and a routing service to allow users to find rooms and get directions between rooms on floor plans. The team aimed to improve the routing experience with more cartographic floor plans and humanized routing. Future work included enhancing the network and adding additional functionality.


