Multi-Retailer BI Dashboard for Sales and Inventory
•Download as PPTX, PDF•
1 like•540 views

RetailSense provides an easy to use and easily customizable front end to view your weekly sales results and drill to the details at a store/sku level. Run by retail experts, we can help you use analytics to drive your sales.

Recommended
Recommended
More Related Content
What's hot
What's hot (14)
Similar to Multi-Retailer BI Dashboard for Sales and Inventory
Similar to Multi-Retailer BI Dashboard for Sales and Inventory (20)
Recently uploaded
Recently uploaded (11)
Multi-Retailer BI Dashboard for Sales and Inventory
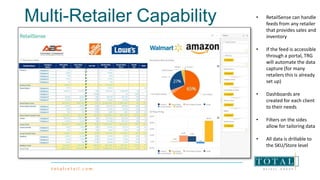
- 1. Multi-Retailer Capability • RetailSense can handle feeds from any retailer that provides sales and inventory • If the feed is accessible through a portal, TRG will automate the data capture (for many retailers this is already set up) • Dashboards are created for each client to their needs • Filters on the sides allow for tailoring data • All data is drillable to the SKU/Store level
- 2. RetailSense. FAST AND EASY-TO-USE BUSINESS INTELLIGENCE REPORTS – ACCESSIBLE ANYWHERE. • Multi-retailer view to allow you to have the complete retail picture in one place • Automated data processing reduces reporting time to see the week’s sales on Monday • Drill capabilities easily allow for deep dive into data at the SKU / Store level • Easily customized to meet your needs • Eliminate large Excel files that clutter your inbox and create security risks • View historical data all in one report to see the larger picture • Integrate with our eCompShop tool to see a picture of the entire market in addition to your sales
- 3. BI sales dashboard. Com pare unit s ales , dollar s ales and inventory at any tim e period to identify c hanges Filters allow drill down c apability by c ategory, produc t or geography Color c oded indic ators to h i g h l i g h t p o s i t i ve o r n e g a t i ve trends View reports on any web -e n a b l e d d e vi c e
- 4. From overall trends to the s m alles t detail in a few c lic k s Drill any m etric to produc t m odel and s tore to get to the root c aus e and tak e ac tion Download any graph or c hart to Exc el or PowerPoint to c reate your own reports
- 5. RetailSense drill down. Built in Diagnos tic Tools to trac k Out of Stoc k SKUs . Us er c an drill into data to s ee the s pec ific Out of Stoc k s tores and detail on how long they’ve been without inventory.
- 6. Lift and ROI Example 45.9% • Net lift of 45.9% actions in Test stores over Control • Net lift is calculated as (Test store avg sales growth) – (Control store avg sales growth) • In this example, Test store sales grew 96.6% from pre to post period and control store sales grew 50.7%. (96.6% - 50.7% = 45.9%)
- 7. Splash Map Example We use splash maps of online sales to help pinpoint where we might expand to next when our client does not have a nationwide footprint This shows sales of Pool Fencing. We were able to use this analysis to expand into the Pacific North West and Texas in a major big box retailer.
- 8. How we get there. • Set up. Process to start reporting can be set up in about a week • Customization. Standard dashboards and views can be updated based on the individual needs of the products • Strategy. Working closely with clients to integrate data and insights through all aspects of development • Experience. What sets us apart from the rest. We know retail The Premium approach.