
Recommended
Recommended
More Related Content
What's hot
What's hot (19)
Viewers also liked
Viewers also liked (11)
Similar to Home Is More than a House: Creating Livable Communities
Similar to Home Is More than a House: Creating Livable Communities (20)
Recently uploaded
Recently uploaded (20)
Home Is More than a House: Creating Livable Communities
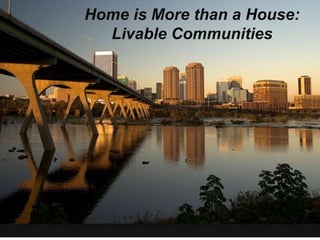
- 1. Home is More than a House: Livable Communities
- 12. Federal Housing Administration • Insured Loans made by banks • Encourage Homeownership • Economic Growth •Home Owners Loan Corporation National Housing Act of 1934
- 13. Home Owners Loan Corporation A = areas were “hot spots…where good mortgage lenders...are willing to make their maximum loans.” B = areas were not as desirable but “still good.” C = areas had reached “the transition period” where they were in decline due to factors such as age, obsolescence, and change of style and infiltration of a lower grade population. Any threat of infiltration of foreign-born, negro or lower grade population? If so, indicate these by nationality and rate of infiltration like this: "Negro-rapid“ D = areas had fully declined and were "characterized by detrimental influence in a pronounced degree.“
- 15. Wagner-Steagall Act, 1937 • Established a permanent public housing program in the United States • Built largely at the most undesirable locations, and frequently at very high densities • Income requirements ensured that only low-income residents would guarantee the concentration of poverty
- 16. Windsor Farms: Population Density: 936 Gilpin Court: Population Density: 10,287 Concentrated Poverty
- 17. 94 sq. miles 5,710 sq. miles Of the 138,136 people living in poverty, 60,559 (43%) live in just 1.6% of the region’s land. Concentrated Poverty 77,577 60,559
- 18. RRHA Housing Demographics www.rrha.com • 98% African American • $7,976 is the average yearly income • 59% of all RRHA households are single females with children
- 20. 5.5 MILES AWAY, 20 YEARS APART Life expectancy differs by 20 years in the 5.5 miles it takes to drive between Westover Hills and Gilpin and by 14 years in the 2.8 miles that separate Westover Hills and Swansboro. The VCU study suggests that this life expectancy gap is rarely due to a single cause, but rather several factors, including: -opportunities for education and jobs -safe and affordable housing -availability of nutritious food and places for physical activity -clean air -and access to health care -child care and social services. “The health differences shown in these maps aren’t unique to one area. We see them in big cities, small towns and rural areas across America,” said Derek Chapman, Ph.D., associate director for research, VCU Center on Society and Health.
- 21. Home Is More than a House: Livable Communities How do we get there?
- 22. Creighton Court Public Housing Community COMMUNITY SIZE BUILT AVG.INCOME AVG.OCCUPANCY Creighton Court (map) 504 units 1952 $9,460 8.8 years
- 25. Atlanta, Georgia
- 26. Church Hill North/Creighton Court Revitalization
- 27. Opening May 10th, 2010 Units: 447 Population: 1,287 Home Is More than A House: Livable Communities Asset Based Community Transformation/Revitalization
- 28. People First ! • Authentic Resident & Community Engagement • Resident Capacity Building/Empowerment • Services/Self-Sufficiency – Social Services – Health & Healthcare – Child care – Education & Training – Employment etc.
- 29. Neighborhood/Community & Economic Development – Education-Schools, early childhood/Libraries – Parks, Bike Paths etc. – Businesses – Public Safety, Safe Streets – Accessible public transportation – Food Access – Built Environment – Environmental Conditions – Mixed Use
- 30. HOUSING • Quality Affordable Housing • Mixed Income • 1 for 1 Replacement
- 31. Home Is More than a House: Livable Communities How do we get there? Together! Collectively! Residents/Community/Public/ Private/CBOs/Businesses/Philanthropy Elected Officials/Government etc!
Editor's Notes
- Comparison of A+D neighborhoods. Persons per sq mile