Update on Supply Conditions and Drought Response Activities - September 24, 2015
•
0 likes•721 views

Water Planning Committee Presentation by Dana Friehauf, Water Resources Manager and Alexi Schnell, Water Resources Specialist

Recommended
Recommended
More Related Content
What's hot
What's hot (20)
Viewers also liked
Viewers also liked (7)
Similar to Update on Supply Conditions and Drought Response Activities - September 24, 2015
Similar to Update on Supply Conditions and Drought Response Activities - September 24, 2015 (20)
More from San Diego County Water Authority
More from San Diego County Water Authority (10)
Recently uploaded
Recently uploaded (20)
Update on Supply Conditions and Drought Response Activities - September 24, 2015
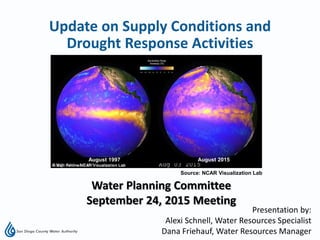
- 1. Presentation by: Alexi Schnell, Water Resources Specialist Dana Friehauf, Water Resources Manager Water Planning Committee September 24, 2015 Meeting Update on Supply Conditions and Drought Response Activities Lake Oroville Source: NCAR Visualization Lab August 1997 August 2015
- 2. 2 NOAA Climate Prediction Center El Niño Update September 2015 – El Niño Advisory Issued when El Niño conditions are observed and expected to continue +95% chance El Niño will continue through winter and gradually weaken through spring 2016 September 2014 – El Niño Watch Issued when conditions are favorable for development of El Niño Chance of El Niño had decreased to 60-65% for fall and winter
- 3. 3 The “Blob” What is the Blob? Large mass of warm water off the coast of the Pacific Northwest Emerged in late 2013 No historical experience with the Blob The Blob vs. El Niño Both are phenomenon associated with warm water in the Pacific that can separately impact weather Other than speculation, climatologists have no way to know how weather systems will be influenced by the potential interaction of the Blob and El Niño conditions The “Blob” El Niño Condition
- 4. 4 Tropical Weather Indicators of El Niño Continue to Develop Source: Mike Dettinger, USGS/SIO
- 5. 5 National Weather Service Precipitation Outlook A = Above Average B = Below Average EC = Equal Chances Made February 19, 2015 A = Above Average B = Below Average EC = Equal Chances Made September 17, 2015 October - December November - January December - February
- 6. 6 National Weather Service Temperature Outlook A = Above Average B = Below Average EC = Equal Chances Made September 17, 2015 October - December November - January December - February
- 7. 7 0% 10% 20% 30% 40% 50% SWRCB Emergency Regulation Member Agency Conservation (June - July 2015) *Based on R-GPCD data current as of 6/11/15 -1% -8% +6%+1% -6% +7% +16% +8% +14% +9% +4% +8% +14% +8% +11% +6% -8% +14% +10% +10% 7 Source: SWRCB Conservation Reporting Data Conservation standard Conservation achieved toward designated standard Percent achieved above conservation standard Percent below conservation standard
- 8. 8 Total Potable M&I Water Use State Emergency Regulation Reporting Months - 10,000 20,000 30,000 40,000 50,000 60,000 Jun Jul Aug Sep Oct Nov Dec Jan Feb PotableM&IUse(AF) Months in 2013 2015 - 2016 -26% -32% -24% Cumulative June - August 2015 is 27% lower than 2013 Source: Member Agency monthly water use reporting to the Water Authority
- 9. 9 Update on SWRCB Emergency Regulations Stakeholder workgroup met August 26th Meeting focused on expediting adoption of long-term regulations September 18th stakeholder letter Question authority of SWRCB to extend emergency regulations on permanent basis Long-term water management objectives must encompass both conservation and supply development Focus on unresolved issues associated with emergency regulations Next workgroup meeting October 26, 2015 As part of adoption of regulations, State Water Board agreed to form workgroup to address unresolved issues e.g. investments in drought-resilient supplies
- 10. 10
- 11. 11 Total Potable M&I Water Use State Emergency Regulation Reporting Months - 10,000 20,000 30,000 40,000 50,000 60,000 Jun Jul Aug Sep Oct Nov Dec Jan Feb PotableM&IUse(AF) Months in 2013 2015 - 2016 -26% -32% -24% Cumulative June - August 2015 is 27% lower than 2013 Source: Member Agency monthly water use reporting to the Water Authority Adjusted for growth and weather