Abortion pills in Doha Qatar (+966572737505 ! Get Cytotec
Trading india
1. T
he indian market’s 2008swoonleft
stocksatlevelsthatareattractingforeign
buyerssuchasMarkMobiusofTemple-
tonAssetManagementLtd.inSinga-
pore.Yetgovernmentrestrictionsoninvestingby
foreigninstitutionscanaffectthevalueoftheirhold-
ings.Identifyingmarketdiscrepanciesmayhelp
theseinvestorsgainanedgeasIndianmarketsstrug-
gletorecoverfromtheglobalmarketmeltdownand
falloutfromtheNovemberattacksinMumbai.
The Reserve Bank of India limits overall hold-
ings by foreign institutions including mutual
funds, insurers and banks to 24 percent of the stock
issued by an Indian company. The ceiling is 20 per-
cent for public-sector banks such as State Bank of
India, the nation’s biggest lender by assets. To raise
the cap beyond the limit, a company’s board must
pass a special resolution allowing for increased
investment by foreign institutions.
The central bank monitors holdings by foreign
institutional investors (FIIs) daily. To view foreign
holdings and investment limits for Indian stocks,
type FIIL <Go> 1 <Go>.
Once purchases of an Indian company’s stock
by FIIs reach an amount within 2 percentage points
of the limit, the institutions can’t buy the shares in
the open market. Instead, they must trade them
in the so-called foreign segment, available on both
the Bombay Stock Exchange and the National
Stock Exchange. Because foreign segment trading
is restricted to FIIs and domestic institutions,
TradingIndia
prices can vary from the domestic market.
Type MOST I3 <Go> to view the most-active
foreign-segment stocks. For foreign-segment trade
data,useacompany’sequitytickerappendedwith/F.
For example, to graph foreign-segment prices for
Tata Steel Ltd., India’s largest steel producer, type
TATA/F IN <Equity> GP <Go>.
you can use the India Foreign Segment Premium
Analysis (FSEG) function to analyze the difference,
or spread, between prices in the foreign segment
and the domestic market. To do so for State Bank of
India, type SBIN IN <Equity> FSEG <Go> and click
on the Data tab at the bottom of the screen. The
top part of the screen summarizes foreign-segment
trades and premiums or discounts paid relative to
the domestic market during selected time and date
ranges. The lower part compares each foreign-
segment trade with the domestic market.
ClickontheCharttabtoviewthedistributionof
tradesexecutedduringtheselectedrange.The
y-axisrepresentsforeign-segmenttrades,whilethe
x-axisrepresentsthedomesticmarket.Thetrade
pointdenotedbyaredstaristhelasttradeexecuted.
If you’re enabled for real-time data from an
exchange such as the National Stock Exchange, you
can type TATA/F IS <Equity> BBOF <Go> to view
market depth, or the best bids and offers, for both
foreign-segment and domestic trading in Tata Steel
shares. The top half of the screen provides infor-
mation about market depth for the foreign seg-
ment, while the lower half shows the domestic
market. On the right side of the screen is the Pre-
mium Analysis box, which lets you calculate the
spread for a specific foreign-segment trade. ≤
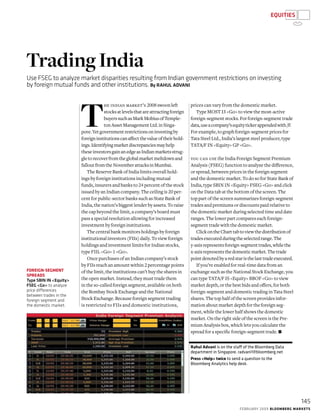
Foreign-Segment
Spreads
Type SBIN IN <Equity>
FSEG <Go> to analyze
price differences
between trades in the
foreign segment and
the domestic market.
Rahul Advani is on the staff of the Bloomberg Data
department in Singapore. radvani1@bloomberg.net
Press <Help> twice to send a question to the
Bloomberg Analytics help desk.
Use FSEG to analyze market disparities resulting from Indian government restrictions on investing
by foreign mutual funds and other institutions. By RAHUL ADVANI
equities
145
February 2009 Bloomberg Markets