Sift detector boosted by adaptive contrast threshold to improve matching robustness of remote sensing panchromatic images
•Download as DOCX, PDF•
0 likes•19 views

The document proposes an adaptive contrast threshold-SIFT (ACT-SIFT) method to improve the matching quality of the scale invariant feature transform (SIFT) detector for remote sensing panchromatic image matching. The ACT-SIFT method calculates separate contrast thresholds for target and reference images by minimizing the relative difference between the entropy of keypoints for each image. Keypoints are initially extracted using SIFT with an initial threshold, then thresholds are iteratively modified to minimize the entropy difference, and keypoints are re-extracted according to the optimized thresholds. The results from applying this adaptive thresholding approach promise improved matching pairs over standard SIFT.

Recommended
More Related Content
What's hot
What's hot (20)
Similar to Sift detector boosted by adaptive contrast threshold to improve matching robustness of remote sensing panchromatic images
Similar to Sift detector boosted by adaptive contrast threshold to improve matching robustness of remote sensing panchromatic images (20)
More from Venkat Projects
More from Venkat Projects (20)
Recently uploaded
Recently uploaded (20)
Sift detector boosted by adaptive contrast threshold to improve matching robustness of remote sensing panchromatic images
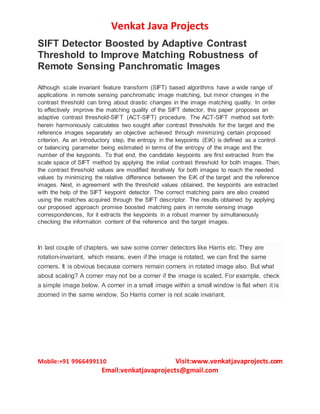
- 1. Venkat Java Projects Mobile:+91 9966499110 Visit:www.venkatjavaprojects.com Email:venkatjavaprojects@gmail.com SIFT Detector Boosted by Adaptive Contrast Threshold to Improve Matching Robustness of Remote Sensing Panchromatic Images Although scale invariant feature transform (SIFT) based algorithms have a wide range of applications in remote sensing panchromatic image matching, but minor changes in the contrast threshold can bring about drastic changes in the image matching quality. In order to effectively improve the matching quality of the SIFT detector, this paper proposes an adaptive contrast threshold-SIFT (ACT-SIFT) procedure. The ACT-SIFT method set forth herein harmoniously calculates two sought after contrast thresholds for the target and the reference images separately an objective achieved through minimizing certain proposed criterion. As an introductory step, the entropy in the keypoints (EiK) is defined as a control or balancing parameter being estimated in terms of the entropy of the image and the number of the keypoints. To that end, the candidate keypoints are first extracted from the scale space of SIFT method by applying the initial contrast threshold for both images. Then, the contrast threshold values are modified iteratively for both images to reach the needed values by minimizing the relative difference between the EiK of the target and the reference images. Next, in agreement with the threshold values obtained, the keypoints are extracted with the help of the SIFT keypoint detector. The correct matching pairs are also created using the matches acquired through the SIFT descriptor. The results obtained by applying our proposed approach promise boosted matching pairs in remote sensing image correspondences, for it extracts the keypoints in a robust manner by simultaneously checking the information content of the reference and the target images. In last couple of chapters, we saw some corner detectors like Harris etc. They are rotation-invariant, which means, even if the image is rotated, we can find the same corners. It is obvious because corners remain corners in rotated image also. But what about scaling? A corner may not be a corner if the image is scaled. For example, check a simple image below. A corner in a small image within a small window is flat when it is zoomed in the same window. So Harris corner is not scale invariant.
- 2. Venkat Java Projects Mobile:+91 9966499110 Visit:www.venkatjavaprojects.com Email:venkatjavaprojects@gmail.com So, in 2004, D.Lowe, University of British Columbia, came up with a new algorithm, Scale Invariant Feature Transform (SIFT) in his paper, Distinctive Image Features from Scale-Invariant Keypoints, which extract keypoints and compute its descriptors. (This paper is easy to understand and considered to be best material available on SIFT. So this explanation is just a short summary of this paper). There are mainly four steps involved in SIFT algorithm. We will see them one-by-one. 1. Scale-space Extrema Detection From the image above, it is obvious that we can’t use the same window to detect keypoints with different scale. It is OK with small corner. But to detect larger corners we need larger windows. For this, scale-space filtering is used. In it, Laplacian of Gaussian is found for the image with various values. LoG acts as a blob detector which detects blobs in various sizes due to change in . In short, acts as a scaling parameter. For eg, in the above image, gaussian kernel with low gives high value for small corner while guassian kernel with high fits well for larger corner. So, we can find the local maxima across the scale and space which gives us a list of values which means there is a potential keypoint at (x,y) at scale. But this LoG is a little costly, so SIFT algorithm uses Difference of Gaussians which is an approximation of LoG. Difference of Gaussian is obtained as the difference of Gaussian blurring of an image with two different , let it be and . This process is done for different octaves of the image in Gaussian Pyramid. It is represented in below image:
- 3. Venkat Java Projects Mobile:+91 9966499110 Visit:www.venkatjavaprojects.com Email:venkatjavaprojects@gmail.com Once this DoG are found, images are searched for local extrema over scale and space. For eg, one pixel in an image is compared with its 8 neighbours as well as 9 pixels in next scale and 9 pixels in previous scales. If it is a local extrema, it is a potential keypoint. It basically means that keypoint is best represented in that scale. It is shown in below image: Regarding different parameters, the paper gives some empirical data which can be summarized as, number of octaves = 4, number of scale levels = 5, initial , etc as optimal values.
- 4. Venkat Java Projects Mobile:+91 9966499110 Visit:www.venkatjavaprojects.com Email:venkatjavaprojects@gmail.com 2. Keypoint Localization Once potential keypoints locations are found, they have to be refined to get more accurate results. They used Taylor series expansion of scale space to get more accurate location of extrema, and if the intensity at this extrema is less than a threshold value (0.03 as per the paper), it is rejected. This threshold is called contrastThreshold in OpenCV DoG has higher response for edges, so edges also need to be removed. For this, a concept similar to Harris corner detector is used. They used a 2x2 Hessian matrix (H) to compute the pricipal curvature. We know from Harris corner detector that for edges, one eigen value is larger than the other. So here they used a simple function, If this ratio is greater than a threshold, called edgeThreshold in OpenCV, that keypoint is discarded. It is given as 10 in paper. So it eliminates any low-contrast keypoints and edge keypoints and what remains is strong interest points. 3. Orientation Assignment Now an orientation is assigned to each keypoint to achieve invariance to image rotation. A neigbourhood is taken around the keypoint location depending on the scale, and the gradient magnitude and direction is calculated in that region. An orientation histogram with 36 bins covering 360 degrees is created. (It is weighted by gradient magnitude and gaussian-weighted circular window with equal to 1.5 times the scale of keypoint. The highest peak in the histogram is taken and any peak above 80% of it is also considered to calculate the orientation. It creates keypoints with same location and scale, but different directions. It contribute to stability of matching. 4. Keypoint Descriptor Now keypoint descriptor is created. A 16x16 neighbourhood around the keypoint is taken. It is devided into 16 sub-blocks of 4x4 size. For each sub-block, 8 bin orientation histogram is created. So a total of 128 bin values are available. It is represented as a
- 5. Venkat Java Projects Mobile:+91 9966499110 Visit:www.venkatjavaprojects.com Email:venkatjavaprojects@gmail.com vector to form keypoint descriptor. In addition to this, several measures are taken to achieve robustness against illumination changes, rotation etc. 5. Keypoint Matching Keypoints between two images are matched by identifying their nearest neighbours. But in some cases, the second closest-match may be very near to the first. It may happen due to noise or some other reasons. In that case, ratio of closest-distance to second- closest distance is taken. If it is greater than 0.8, they are rejected. It eliminaters around 90% of false matches while discards only 5% correct matches, as per the paper. Execution: Double click on ‘run.bat’ file to get below screen To upload the aerial view image click on “Upload Aerial Image”
- 6. Venkat Java Projects Mobile:+91 9966499110 Visit:www.venkatjavaprojects.com Email:venkatjavaprojects@gmail.com Upload the aerial Imageand Location will be displaced below the aerial upload button as below Now Click on “upload Satellite View Image” to upload.
- 7. Venkat Java Projects Mobile:+91 9966499110 Visit:www.venkatjavaprojects.com Email:venkatjavaprojects@gmail.com Upload the satellite View Imageand image location will be displaced as below. Now Click on Initiate Sift Detector.
- 8. Venkat Java Projects Mobile:+91 9966499110 Visit:www.venkatjavaprojects.com Email:venkatjavaprojects@gmail.com Uploaded file will be read using opencv and will initiate the sift detector. Now Click on Sift detector.Itwill find the keypoints and descriptor for the different levels(0.01-0.04) of the threshold values and Find the matches for keypoints and descriptors and will the draw the lines for the matching points.
- 9. Venkat Java Projects Mobile:+91 9966499110 Visit:www.venkatjavaprojects.com Email:venkatjavaprojects@gmail.com In local drive all the images are stored with different threshold levels.
- 10. Venkat Java Projects Mobile:+91 9966499110 Visit:www.venkatjavaprojects.com Email:venkatjavaprojects@gmail.com