Infographics

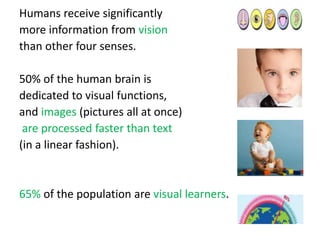
Humans receive significantly more information from vision than other four senses. 50% of the human brain is dedicated to visual functions, and images (pictures all at once) are processed faster than text (in a linear fashion). 65% of the population are visual learners. So Info graphics are graphic visual representations of information, data or knowledge. Present complex information quickly and clearly. Example: Washington Metro Utilizing graphics to enhance the human visual system’s ability to see patterns and trends. The two main parts of all info graphics are The Content is king Let data lead Gather facts, derive Statistics and serve as the content Organize the info The visual Consists of colors and graphics It is about telling a story Capture the state of trend Keep it simple Position, Orientation, size, shape, and color are important There are software tools to create Info Graphics Adobe Flash Adobe Illustrator HTML 5 & CSS3 Inkscape Tableau Public On-line Info graphics creators such as Infogr.am Piktochart Easel.ly Info graphics are often shared between users of social networks such as Facebook and Twitter

Recommended
Recommended
More Related Content
Viewers also liked
Viewers also liked (20)
Similar to Infographics
Similar to Infographics (20)
More from venkateswararao chalamalasetti
More from venkateswararao chalamalasetti (6)
Recently uploaded
Recently uploaded (20)
Infographics
- 1. Humans receive significantly more information from vision than other four senses. 50% of the human brain is dedicated to visual functions, and images (pictures all at once) are processed faster than text (in a linear fashion). 65% of the population are visual learners.
- 2. So Info graphics are graphic visual representations of information, data or knowledge. Present complex information quickly and clearly. Example: Washington Metro Utilizing graphics to enhance the human visual system’s ability to see patterns and trends. Example: Weather report • Example: World diabetes statistics and facts. • and facts
- 3. The two main parts of all info graphics are The Content is king Let data lead Gather facts, derive Statistics and serve as the content Organize the info Color Size Position Orientation Shape The visual Consists of colors and graphics It is about telling a story Capture the state of trend Keep it simple Position, Orientation, size, shape, and color are important
- 4. There are software tools to create Info Graphics • Adobe Flash • Adobe Illustrator • HTML 5 & CSS3 • Inkscape • Tableau Public On-line Info graphics creators such as • Infogr.am • Piktochart • Easel.ly • Info graphics are often shared between users of social networks such as Facebook and Twitter