Neurobiology Lab: Immunohistochemistry Lab
Results
The presence of the Tyrosine-hydroxylase protein was observed through the breaking down of the substrate of the DAB stain by the complex formed between the biotin in the secondary antibody and the avidin in the ABC Reagent. The recorded observations included a middle section and a top section of stage 11 embryonic mouse brains. The other sections on the slide were either torn, possibly from a shifting of the coverslip, or revealed no prominent staining.
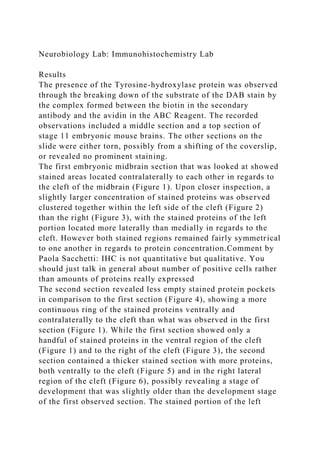
The first embryonic midbrain section that was looked at showed stained areas located contralaterally to each other in regards to the cleft of the midbrain (Figure 1). Upon closer inspection, a slightly larger concentration of stained proteins was observed clustered together within the left side of the cleft (Figure 2) than the right (Figure 3), with the stained proteins of the left portion located more laterally than medially in regards to the cleft. However both stained regions remained fairly symmetrical to one another in regards to protein concentration.Comment by Paola Sacchetti: IHC is not quantitative but qualitative. You should just talk in general about number of positive cells rather than amounts of proteins really expressed
The second section revealed less empty stained protein pockets in comparison to the first section (Figure 4), showing a more continuous ring of the stained proteins ventrally and contralaterally to the cleft than what was observed in the first section (Figure 1). While the first section showed only a handful of stained proteins in the ventral region of the cleft (Figure 1) and to the right of the cleft (Figure 3), the second section contained a thicker stained section with more proteins, both ventrally to the cleft (Figure 5) and in the right lateral region of the cleft (Figure 6), possibly revealing a stage of development that was slightly older than the development stage of the first observed section. The stained portion of the left lateral region appeared to have spread more ventrally below the midbrain region of the section (Figure 4 and Figure 7) in comparison to the left lateral region of the first section (Figure 2), a possible result of the section containing tissue from another part of the brain besides just the midbrain region.Comment by Paola Sacchetti: You are looking at E11 embryo so the tissue is all the same age. But you are looking a different sections anterior to posterior so one section might be more at the beginning of the ventral midbrain, the 2nd section is in the middle of the structure where there are already more cells presents.
Figure 1: Image of first section at 10x magnification, revealing a slightly larger clustered protein composition within the left region, stretching down laterally from the cleft.Comment by Paola Sacchetti: Figures need a title and a figure description. You could make a composite picture and have a single title for all 7 figures or each section and its magnifica ...
1. Neurobiology Lab: Immunohistochemistry Lab
Results
The presence of the Tyrosine-hydroxylase protein was observed
through the breaking down of the substrate of the DAB stain by
the complex formed between the biotin in the secondary
antibody and the avidin in the ABC Reagent. The recorded
observations included a middle section and a top section of
stage 11 embryonic mouse brains. The other sections on the
slide were either torn, possibly from a shifting of the coverslip,
or revealed no prominent staining.
The first embryonic midbrain section that was looked at showed
stained areas located contralaterally to each other in regards to
the cleft of the midbrain (Figure 1). Upon closer inspection, a
slightly larger concentration of stained proteins was observed
clustered together within the left side of the cleft (Figure 2)
than the right (Figure 3), with the stained proteins of the left
portion located more laterally than medially in regards to the
cleft. However both stained regions remained fairly symmetrical
to one another in regards to protein concentration.Comment by
Paola Sacchetti: IHC is not quantitative but qualitative. You
should just talk in general about number of positive cells rather
than amounts of proteins really expressed
The second section revealed less empty stained protein pockets
in comparison to the first section (Figure 4), showing a more
continuous ring of the stained proteins ventrally and
contralaterally to the cleft than what was observed in the first
section (Figure 1). While the first section showed only a
handful of stained proteins in the ventral region of the cleft
(Figure 1) and to the right of the cleft (Figure 3), the second
section contained a thicker stained section with more proteins,
both ventrally to the cleft (Figure 5) and in the right lateral
region of the cleft (Figure 6), possibly revealing a stage of
development that was slightly older than the development stage
of the first observed section. The stained portion of the left
2. lateral region appeared to have spread more ventrally below the
midbrain region of the section (Figure 4 and Figure 7) in
comparison to the left lateral region of the first section (Figure
2), a possible result of the section containing tissue from
another part of the brain besides just the midbrain
region.Comment by Paola Sacchetti: You are looking at E11
embryo so the tissue is all the same age. But you are looking a
different sections anterior to posterior so one section might be
more at the beginning of the ventral midbrain, the 2nd section is
in the middle of the structure where there are already more cells
presents.
Figure 1: Image of first section at 10x magnification, revealing
a slightly larger clustered protein composition within the left
region, stretching down laterally from the cleft.Comment by
Paola Sacchetti: Figures need a title and a figure description.
You could make a composite picture and have a single title for
all 7 figures or each section and its magnifications. Titles like
“Localization of TH immunoreactivity in ventral midbrain at
E11” or positive staining for the rate limiting enzyme in DA
synthesis in E11 midbrain tissue or….
Figure 2: Close up of protein cluster within the left lateral
region of the midbrain of the first section at 20x magnification,
where some individual cell structures containing the Tyrosine-
hydroxylase protein can be observed.
3. Figure 3: Close up of the right lateral region of the midbrain of
the first section at 20x magnification, revealing a slightly more
spread out distribution of the stained proteins than what was
observed in the left lateral portion of the midbrain.
Figure 4: Protein distribution within the second section at 10x
magnification, showing a slightly higher concentration of the
Tyrosine-hydroxylase protein within the midbrain.
Figure 5: Close up of the ventral region of the cleft and its high
protein content at 40x magnification.
Figure 6: Close up of the dense distribution of protein at 40x
magnification, located on the right-hand side of the cleft and
spreading out dorsally from the cleft.
Figure 7: Close up of the lateral region located to the left of the
cleft at 40x magnification, showing the distribution of the
protein spreading to a ventral region farther down in
comparison to the right region.
BIO310 F
IHC principle lab
Primary antibody against protein raised in RABBIT
Secondary antibody against RABBIT IgG raised in donkey
Blocking contained donkey proteins (to neutralize proteins from
Secondary antibody)
4. Secondary antibodies against RABBIT IgG coupled to BIOTIN
ABC complex – Avin/Biotin/Horseradish peroxidase enzyme
DAB – peroxidase substrate
BIOL145-05 F11
Bio310
How to write a manuscript
“Verbal communication is temporal and easily forgotten, but
written reports exist for long periods and yield long-term
benefits for the author and others.
Scientific research is a group activity. Individual scientists
perform experiments to test hypotheses about biological
phenomena. After experiments are completed and duplicated,
researchers attempt to persuade others to accept or reject their
hypotheses by presenting the data and their interpretations. The
lab report or the scientific manuscript is the vehicle of
persuasion; when it is published, it is available to other
scientists for review. If the results stand up to criticism, they
become part of the accepted body of scientific knowledge unless
later disproved.
In some cases, a report may not be persuasive in nature but
instead is an archival record for future generations. For
example, data on the distribution and frequency of rabid skunks
in a certain year may be of use to future epidemiologists in
deciding whether the incidence of rabies is increasing.
Regardless of whether a report is persuasive or archival, the
following guidelines apply.” Warren D. Dolphin, ISU
If you ever searched for scientific papers before, you probably
noticed that many papers, particularly the primary sources, are
5. written in a similar format. The papers are usually organized in
five sections:
Introduction
Material & Methods
Results
Discussion
Literature Cited
When you write up your IHC lab report, you will follow this
general format, so be sure to refer to a primary literature
manuscript in the scientific literature as a guide.
General instructions
Proper format: Type report; double-space, font size 12, one inch
margins on left, right, top, and bottom; number the pages.
The different sections, i.e. Material & Methods, Results, and
Literature cited or References (if you cite something), must be
titled as such (i.e. Material & Methods etc.).
No quotes from papers you have read are allowed. All of the
text must be written in your own words.
Citing the scientific literature in the text of your report
I am not requiring you to use background literature for this
assignments. But if you choose to use citations, be sure to cite
them properly. Do not use web sites as sources of information.
If you refer to information from a paper or book in the text of
your report, cite the work by including the name(s) of the
author and the date of publication. The citations should be
included between a set of parentheses at the end of the first
sentence in which the work is mentioned. For example, if the
paper has a single author, use Stern (1992) or (Stern 1992);
for two authors, use Stern and Canning (1990) or (Stern and
Canning 1990);
for more than 2 authors: Stern et al. (1990) or (Stern et al.
1990).
List the whole reference (Authors, Title, Journal, Year of
Publication) at the end of the report.
6. TITLE:
Please DO include a title. Do not title it something like
“Bio390: IHC Project.” Your title must reflect what your study
was about.
The title should be less than ten words and should reflect the
factual content of the paper. Scientific titles are not designed to
catch the reader's fancy. A good title is straightforward and uses
keywords that researchers in a particular field will recognize.
Introduction:
(Not included in this assignment but useful as guidelines for the
oral presentation)
The Introduction contains background information and a
description of the study’s purpose. You should explain the
research problem and what other people have done previously
on this subject. You should describe why your work is
important and how it seeks to expand knowledge. Your
introduction should not start with a statement of your
hypothesis. It should not begin with “The goal was” or “The
hypothesis was.” Instead, you should lead the reader to your
hypothesis by providing a general background or reasoning for
the problem you have studied. You will return to these ideas in
the discussion. An explicit statement of the objective, goal, or
hypothesis should appear toward the end of the section. The
introduction will probably be one to several paragraphs long.
A good introduction will answer several questions, including
the following:
Why was this study performed?
What knowledge already exists about this subject?
What is the specific purpose of the study?
MATERIAL & METHODS:
This section describes how the study was performed. You
should describe your experimental details and experimental
design. Describe your laboratory methods clearly so that
7. another person would be able to replicate your work from your
description. You want to include enough details for someone to
repeat your experiment but do not include trivial details.
This section should be written in paragraph form. Use the past
tense; passive voice is acceptable for the Methods section.
Avoid repetition. Omit words like then, now, next etc., because
they’ll make it sound like a list of steps to be followed in order.
Do not use lists to describe materials used or the steps you took
to complete the experiment.
Generally, this section attempts to answer the following
questions:
What materials were used?
How were they used?
Where and when was the work done? (This question is most
important in field studies.)
RESULTS:
In this section, you will describe the results of your experiment
by describing the data you collected. You will save your
interpretation of your experiments for the Discussion section.
You can think of the results section as a translation of
unprocessed data from the notebook to a succinct and easily
understood form. Your data should be analyzed, sorted and
synthesized before they are presented. You should describe the
results of your experiments in paragraph form and illustrate the
results with graphs, tables, and/or figures. Make sure to label
every drawing, graph, or table as Figure 1, 2, 3 etc. and refer to
every labeled graph, table, and/or figure in your text.
This section of your manuscript should concentrate on general
trends and differences and not on trivial details. Many authors
organize and write the results section before the rest of the
report.
Discussion:
8. (Not included in this assignment but useful as guidelines for the
oral presentation)
Here is a chance to evaluate your hypothesis and to explain
what your results mean. Did your results support the hypothesis
or not, or are the results inconclusive? Be careful here; you are
not “proving” or “disproving” anything, nor is your hypothesis
“right” or “wrong” based on this one experiment. How does
your experiment fit into the general background of information
on this problem as described in the introduction? Speculation is
appropriate, if it is so identified. Suggestions for the
improvement of techniques or experimental design may also be
included here. What further experiments would you like to do
and why? Were there problems with the protocol? What would
you change? The best Discussion sections are thoughtful and
include original ideas.
In writing this section, you should explain the logic that allows
you to accept or reject your original hypotheses. You should
also be able to suggest future experiments that might clarify
areas of doubt in your results. Be sure to cite any references to
other manuscripts in the proper format.
Your grade does not depend upon whether or not your
hypothesis was supported but reflects instead how well you
discussed the data with reference to your hypothesis. Your
discussion will be brief (about a page long.) It is not meant to
be a long description of the scientific literature.
LITERATURE CITED:
This is a list of any source you cited in your manuscript,
formatted exactly as you did for the library lab. Cited literature
is expected! When you cite more than one source, list them in
alphabetical order by the last name of the first author of the
manuscript. If a manuscript has more than one author, do not
rearrange the order of the authors’ names.
Every source included in your Literature Cited section must
have been cited somewhere in your report. Conversely, every
source cited in the text must be included in the Literature Cited
9. section.
EXAMPLES OF CITATIONS:
Journal Articles:
Alcock, J. and Gwynne, D.T. 1987. Courtship feeding and mate
choice in thynnine wasps. Aust. J. Zool. 35: 451-458.
Nilsson, L.A. 1992. Orchid pollination biology. Trends Ecol.
Evol. 7: 255-259.
Schiestl, F.P., Ayasse, M., Paulus, H.F., Lofsdedt, C., Hanson,
B.S., Ibarra, F., and Franke, F. 1999. Orchid pollination by
sexual swindle. Nature. 399: 421-422.
Encyclopedia of Life Sciences:
Anderson, O.R. 2001. Protozoan ecology. In: eLS. John Wiley
& Sons.
Book:
Wickler, W. 1968. Mimicry in plants and animals. London:
Weidenfeld and Nicolson.
Article/Chapter in Edited Volume:
Stowe, M.K. 1988. Chemical mimicry. In Chemical mediation of
coevolution (ed. K.C. Spencer), pp. 513-587. San Diego, CA:
Academic Press.
4. Some journals are not available online at UHart; however, we
are lucky that the library is very well connected. Through
ILLiad, an electronic system that you can use to request an item
through Interlibrary Loan, we are able to access unlimited
resources. The name ILLiad can be thought of as an acronym for
InterLibrary Loan internet accessible database. The librarians
can help you to get an Interlibrary Loan account and show you
how to request items using ILLiad.
FIGURE LEGENDS:
Figures are sometimes considered to be the most important part
of a scientific paper. They contain and relay all the evidence
10. reported in the research. Since that is the case, all figures and
tables must be self-standing, which means that the reader should
be able to understand the figure just by reading the legend.
What to discuss when writing an effective figure legend:
Every figure legend should be written to answer the What-Why-
What questions.
What is it? Why did you do it? What were the results?
Be sure to include a descriptive title of all your graphs, tables,
and figures and a figure legend that allows the reader to
understand what is presented in the figure or table. Don’t forget
to include units and label the x and y-axes in all plots.
General Comments on Style
1. All scientific names (genus and species) must be italicized.
(Underlining indicates italics in a typed paper.)
2. Use the metric system of measurements. Abbreviations of
units are used without a following period.
3. Be aware that the word data is plural while datum is singular.
This affects the choice of a correct verb. The word species is
used both as a singular and as a plural.
4. Numbers should be written as numerals when they are greater
than ten or when they are associated with measurements; for
example, 6 mm or 2 g but two explanations of six factors. When
one list includes numbers over and under ten, all numbers in the
list may be expressed as numerals; for example, 17 sunfish, 13
bass, and 2 trout. Never start a sentence with numerals. Spell all
numbers beginning sentences.
5. Be sure to divide paragraphs correctly and to use starting and
ending sentences that indicate the purpose of the paragraph. A
report or a section of a report should not be one long paragraph.
6. Every sentence must have a subject and a verb.
7. Avoid using the first person, I or we, in writing. Keep your
writing impersonal, in the third person. Instead of saying, "We
weighed the frogs and put them in a glass jar," write, "The frogs
were weighed and put in a glass jar."
11. 8. Avoid the use of slang and the overuse of contractions.
9. Be consistent in the use of tense throughout a paragraph--do
not switch between past and present. It is best to use past tense.
Present tense is expected in the Discussion section.
And last but certainly not least…..
Proof-read your report (reading it aloud works well) and use a
spell-checker. Pay attention to little details like proper
punctuation.
Check that your writing is clear, concise and grammatically
correct, and that your thoughts are well organized,
Be certain there is no plagiarism: all phrasing, wording, etc. is
your own and all information obtained from other sources
(except general knowledge) is cited. I take plagiarism very
seriously; if you have any questions about it, ask me!
Questions to consider for discussion in laboratory or in your
written report
1. What pushed you to test your hypothesis? What observation
did you or other make before?
2. Do the results support your hypothesis? If so, does this mean
your hypothesis is correct? If not, might errors in the
experimental procedure have affected the results?
3. Did you expect the number of experimental measures to be
precisely the same in both conditions? Suggest reasons why
these values might differ.
4. On the basis of the data obtained how should the
organism/behavior/effect be classified? Does your analysis
match that usually given in textbooks? (Obs! It depends on the
variables that you are testing)
5. Did you expect the experimental group to behave similarly or
differently from the control group? Suggest reasons why these
12. values might be different.
6. If a definite relationship between conditions was observed,
suggest some reasons for this relationship.
7. In what way would you revise the experiment if you wished
to test a similar hypothesis again? Would you expect
experimental results of such an experiment to be quite similar
or very different?
8. Would the experiment have been better if we had used more
extreme conditions?
9. Other than an owner of planarian, who might find use for
what was learned about planarian and the conditions tested?
Use this checklist to see that your report meets the guidelines
General
1. Type your report
2. Spellcheck your report
3. Write the report using the past tense. Use the present tense
for the Discussion section
4. Have a title page that includes the title, your name and the
name of your partner
5. Number each page after the title page
6. Use headings (Materials and Methods, Results, Discussion,
References Cited)
Title
7. Identify the organism, the response measured, and the
environmental variable
Introduction
8. Include the hypothesis, the basis for the hypothesis, and the
13. prediction used to test the hypothesis
9. Include at least 2 pieces of information that you learned
from reference sources
Materials and Methods
10. Tell what was used at the time and tell how the item was
used. Don't make a separate list.
Results
11. Tell in words and paragraphs what was observed and what
did result
12. Place tables and figures (graphs) in the Results section
13. Give each table and each figure (graph) a number and a
title. Refer to each by number in the text of the Results section.
Write a figure legend.
Discussion
14. Evaluate the hypothesis by telling if the results support or
fail to support the prediction used to test the hypothesis.
15. Address biological reasons to explain why what resulted did
result, perhaps including information used to answer the
questions in the lab manual.
16. State a conclusion or the major piece(s) of information
learned in the study in a manner that has meaning if read
separate from the rest of the report.
References Cited
17. Include at least 4 citations, 2 in the Introduction and 2 in
the Discussion section. Cite the references used to learn
information related to the investigation.
14. 1
7
Bio310
How to write the methods section of a research paper.
Kallet RH & Fikret Erdemir
The methods section of a research paper provides the
information by which a study's validity is judged. Therefore, it
requires a clear and precise description of how an experiment
was done, and the rationale for why specific experimental
procedures were chosen. The methods section should describe
what was done to answer the research question, describe how it
was done, justify the experimental design, and explain how the
results were analyzed. Scientific writing is direct and orderly.
Therefore, the methods section structure should: describe the
materials used in the study, explain how the materials were
prepared for the study, describe the research protocol, explain
how measurements were made and what calculations were
performed, and state which statistical tests were done to analyze
the data. Once all elements of the methods section are written,
subsequent drafts should focus on how to present those elements
as clearly and logically as possibly. The description of
preparations, measurements, and the protocol should be
organized chronologically. For clarity, when a large amount of
detail must be presented, information should be presented in
sub-sections according to topic. Material in each section should
be organized by topic from most to least important. It is
generally recommended that the materials and methods should
be written in the past tense, either in active or passive voice.
It is generally known that the material and methods section is a
relatively easy section of an article to write. Therefore, it is
often a good idea to begin by writing the materials and methods
15. section, which is also a crucial part of an article. Because
“reproducible results” are very important in science, a detailed
account of the study should be given in this section. If the
authors provide sufficient detail, other scientists can repeat
their experiments to verify their findings.
Example from scientific literature:
Saul A. Villeda et al, Nat Med. 2014 June ; 20(6): 659–663.
doi:10.1038/nm.3569.
Immunohistochemistry
Tissue processing and immunohistochemistry were performed
on free-floating sections following standard published
techniques30. Mice were anesthetized with chloral hydrate
(Sigma-Aldrich) and transcardially perfused with 0.9% saline,
and brains were removed and fixed in phosphate-buffered 4%
paraformaldehyde for 48 h before cryprotection with 30%
sucrose. Free-floating coronal sections (40 μm) were incubated
overnight with rabbit anti-Egr1 (1:500, 588, Santa Cruz), rabbit
anti–c-Fos (1:500, 4-17, Millipore) or rabbit anti-pCreb
(1:1,000, Ser133, 06-519, Millipore) primary antibodies, and
staining was revealed using biotinylated secondary antibodies
and the ABC kit (Vector) with diaminobenzidine (DAB; Sigma-
Aldrich). Individual cell numbers were quantified by Egr1 and
c-Fos, and pCreb was quantified as the mean signal intensity
using NIH ImageJ software.
Example from Bio310 UHart:
Comparative Distribution of Thalamic Glial Cells using GFAP
Marker through Immunohistochemistry
Materials
Mice brain tissue was collected in the following manner.
Avertin (0.011-0.014 mL/g or 2.5% working sol) was used to
anesthetize mice, which were then suffused with 0.9% saline
solution and then a 4% Paraformaldehyde (PFA) solution (Lab
manual, 20). The whole brains were then postfixed at 4 ̊C
overnight in 4% PFA (Lab manual, 20). After 24 hours had
16. elapsed, the brains were washed thoroughly in Phosphate
Buffered Saline (PBS) at room temperature, with 1 brief wash,
and 3 washes for 25 minutes each. Brains were sliced at 50 μM
thickness, collected on slides, and were frozen at -20 ̊C.
Solution
s that were used included PBS, Block solution, I ̊ mouse
monoclonal antibody solution of Anti-Glial Fibrillary Acidic
Protein (GFAP), II ̊ antibody solution of anti-mouse GFAP,
4',6-Diamidino-2-Phenylindole (DAPI) nuclear counterstain,
and Semi-permanent mounting medium. PBS was a mixture of
0.01 g NaCl/mL of dissolved oxygen, 0.2 g KCl with pH
solution to pH 7.4, 1.44 g of Na2HPO4 brought to l liter with
distilled water, and 0.24 g KH2PO4 (Lab manual, 21). Block
solution was a mixture of PBS, 0.5% Triton X-100, and 5%
serum (Lab manual, 22). Glass slides and cover slips, cuvettes,
and micropipettes were used to mount the brain samples.
Methods
Primary antibody was added to two slides of the mouse brain
section. 400 μL of total solution (1:400 concentration of I ̊
antibody) was placed on each of the two slides and was left
overnight (Immunohistochemistry Principle, 13). Two slides
with 8 sections of whole brain each were carefully removed of
17. their cover slips with tweezers and were briefly rinsed with PBS
for one minute at room temperature, and were then washed with
PBS twice more for 10 minutes each. During the washing, the
secondary antibody was prepared in the following manner. The
II ̊ antibody solution of anti-mouse GFAP was concentrated
1:1000 (Immunohistochemistry Principle, 13).
After the final wash in PBS, the slides were removed from the
PBS, the back of the slides were dried with a kimtech wipe, and
the slides were placed flat in a slide holder. 250 μL of the II ̊
antibody was pipetted onto each slide from the made solution,
and the slide holder cover was placed over the slides to produce
a dark environment. Each section of the brain was covered with
the antibody solution. The lights in the lab were also dimmed to
minimize light interference with the auto-fluorescent dye in the
II ̊ antibody solution. The slides remained in the dark box for an
hour before they were washed in PBS once again for 20 minutes
at room temperature. The slides were removed from the PBS,
the back of the slides were dried with a kimtech wipe, and the
slides were placed flat in the slide holder before 1000 μL of
DAPI was pipetted on each slide. The DAPI was placed over
each brain section and the slides were covered and kept in the
box for 10 minutes. The slides were then washed in PBS briefly
and then once again for 10 minutes. The instructor allowed the
slides to dry in the dark for 5 minutes and a cover slip was
mounted on top with AquaPoly mount. The slides were then
18. dried in the dark at room temperature for 15 minutes, and were
stored in the dark at 4 ̊C overnight.