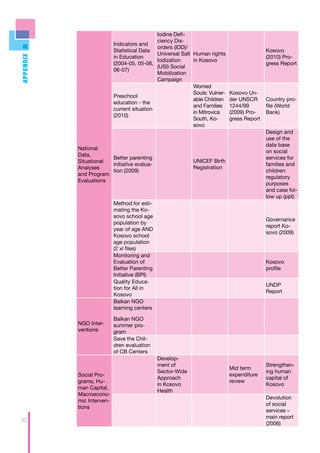
Joined Hands
 Better Childhood
           unite for children
Joined Hands
               Better Childhood


                         Pia Rebello Britto, Ph.D.

                             Jan van Ravens, Drs.

            Liliana Angelica Ponguta, MPH, Ph.D.

                                    Yale University

The Edward Zigler Center of Child Development and
                                      Social Policy

                                  August 31, 2011
ACKNOWLEDGMENTS
           We would like to thank the UNICEF Kosovo office for its support during the
    completion of this report. In particular, we thank Mr. Johannes Wedenig, Mr. Luciano
    Calestini, Ms. Aferdita Spahiu, Ms. Kozeta Imami, Ms. Ivana Milosavljevic, Dr. Agron
    Gashi, Ms. Laura Fragiacomo, and Ms. Beate Dastel, Ms. Arijeta Gjikolli and Mr. Gë-
    zim Hasani. Furthermore, we appreciate contributions and information provided by
    government officials, in particular Mr. Agim Berdyna and Mr. Alush Istogu, Mr. Haki
    Sfishta, Ms. Laberi Luzha and Ms. Merita Shala, Mr. Remzi Salihu, Ms. Merita Vuthaj,
    Mr. Ilir Begolli, and Ms. Nazmije Krasniqi. The authors also would like to express their
    gratitude to Save the Children Kosovo, the Kosovo Education Center, and Balkan
    Sunflowers (especially Joanna Brucker) for their valuable information and discus-
    sions. We also thank William Hodges for editorial work and Adrian Cerezo and Nancy
    Shemrah Fallon for support with illustrations. Funding for this report was granted by
    UNICEF.


2
Table of Contents
 EXECUTIVE SUMMARY....................................................................................... 4

 INTRODUCTION................................................................................................... 7

 STUDY OVERVIEW............................................................................................. 10

 PART 1: SITUATION ANALYSIS......................................................................... 13

     Introduction..................................................................................................... 14

     ­­­­­­Chapter 1: The People.................................................................................... 15

     Chapter 2: Economy and State Finance......................................................... 21

     Chapter 3: Poverty and Social Protection....................................................... 26

     Chapter 4: Health Status and Healthcare....................................................... 32

     Chapter 5: Early Learning and Education....................................................... 38

 PART 2: POLICY ARCHITECTURE ANALYSIS
 AND ASSESSMENT OF ECD PROVISION........................................................ 47

     Introduction..................................................................................................... 48

     Chapter 1: Legislative Framework.................................................................. 49

     Chapter 2: Strategies and Plans..................................................................... 53

 PART 3: RECOMMENDATIONS FOR ECD PROGRAMS
 AND POLICY IMPLEMENTATION..................................................................... 65

     Area 1: Achieving Equity in ECD: A Program for Kosovo............................... 66

     Area 2: Strengthening Governance for ECD................................................... 85

     Appendix I....................................................................................................... 89

     Appendix II...................................................................................................... 94

     Appendix III..................................................................................................... 95

 SELECTED REFERENCES................................................................................. 97


                                                                                                                            3
EXECUTIVE SUMMARY
          Kosovo is moving forward with a keen interest in early childhood. This report
    presents the findings of an analytical study of the programs and policies in Kosovo
    that directly or indirectly impact the lives of young children and families. The purpose
    of this report is to suggest a set of Early Childhood Development (ECD) program and
    policy recommendations for Kosovo.

          Early Childhood Development is a multifaceted concept that covers the early
    childhood period from prenatal to 6 years of age and encompasses a set of coordi-
    nated services for young children and families. From a Rights perspective, within the
    framework of the Convention on the Rights of a Child (CRC), ECD takes into consid-
    eration the fulfillment of children’s rights to survival, development, participation, and
    protection. For ECD in Kosovo, this approach translates into ensuring that programs
    and policies accommodate for the right of all children to survive and be healthy, to
    develop to their fullest potential in a holistic way across all domains of development,
    to be able to participate in their environment as agents-of-change, and be protected
    from abuse, neglect, and forms of disadvantage and vulnerabilities. However, these
    rights are not being fulfilled. The aim of the study was to understand how best to
    improve the health, development, protection, learning and participation of all young
    children through programmatic and policy initiatives.

         The study was conducted in three phases:

          Phase 1 consisted of a systematic analysis of documents pertaining to ECD
    programs and policies. The aim of the review and analysis was to ascertain the de-
    gree to which they address ECD and in particular the attention accorded to holistic
    development. The sampled documents included laws, strategies, regulations, pro-
    gram evaluations, and situation analyses from the key sectors of education, health,
    and protection. Phase 2 of the study involved collection of interview data with key in-
    formants and observations of early childhood settings. The aim of the interviews and
    observations was to fill in the gaps in information that could not be obtained through
    the document review, and to generate recommendations for feasible and sustain-
    able ECD programs. Key informants included relevant partners and key stakehold-
    ers who are involved in ECD program and service provision and policy planning and
    implementation. Observations were conducted at public kindergartens in Zvecan
    and Prishtina, a community-based ECE center in rural Shkanaj, and Prishtina City
    Hospital, Labor and Delivery. Phase 3 of the study focused on sharing the results
    of phases 1 and 2 with key stakeholders, NGO leaders and partners to obtain their
    feedback on the results and support for recommendations. A series of presentations
    and a day-long workshop were held over three days with representatives from the
    leading government sectors, international agencies, NGOs and private sector. The
    results of those deliberations were used to finalize this report.

    The results of the study are presented in three parts:
      ■■ 	 art 1: Situation analysis of ECD in Kosovo
          P
          In Part 1 of the report, the population and demographic profile highlights the
    relatively young population in Kosovo, with almost 30% below 15 years of age. With
4   respect to ethnic composition, the birth rate is roughly the same for the majority of
    the population and ethnic minority groups. Over 60% of the population resides in
rural areas, and is also disproportionately of low income and economically disadvan-
taged; 81% of the poor in Kosovo live in rural areas. Overall, close to 40% of all Ko-
sovar people live on less than 2.50 US$ per day, defined by the World Bank as living
in poverty. With respect to early nutrition, breastfeeding and infant feeding practices
are problematic in that, as the data suggest, only 1 in 8 infants are exclusively breast-
fed for the first 4 months of life, and more than one third of mothers have stopped
breastfeeding completely by six months. With respect to child outcomes, close to
20% of children are stunted (moderately or severely). These health outcomes could
be linked with low percentage of government spending on health (<10%) and limited
access to health centers.

      While the enrolment rate for pre-primary education is approximately 70%, the
proportion of children from ethnic minorities is less than 10%, thereby indicating a
disparity in enrolment into early educational opportunities. One of the largest areas
of need with respect to ECD is the gap in services for parents of young children. It
was noted that parenting and caregiving programs, an evidence-based strategy for
improving child outcomes, were poorly addressed by the health, education and pro-
tection sectors despite their potential to impact ECD significantly.

  ■■ 	 art 2: Content analysis of Laws, Sectoral Strategies, Strategic/Action
      P
      Plans, curricula, and regulations that address ther service provision for the
      youngest chidren in Kosovo
      Part 2 of the report focuses on the policy review and analysis. Due to the ab-
sence of an ECD policy or policies in Kosovo, the documents analyzed provide the
planning frameworks through which priorities, objectives, targets, and/or activities
are set. The vast landscape of policy documents, frameworks, strategies and laws
pertaining directly and indirectly to ECD suggest that Kosovo is committed to its
children. The results of the review indicate that the education sector appears to have
a comprehensive set of guidelines for ECD. Cumulatively, these documents cover
important aspects linked to young children’s learning and education. The content
analysis of Kosovo’s strategic documents suggests a limited alignment or cross- ref-
erence among sectoral plans, strategies, and provisions. Each set of policy docu-
ment appears to be directly linked with its own sector with little to no mention of
allied programs and services, or even policy monitoring, that could be occurring
under the aegis of other sectors. Finally, the legal framework for alleviation of social
problems appears to be a distinctive characteristic of the Kosovo strategy. It was
noted that there are a range of laws that have been endorsed with respect to social
problems facing young children and families and that this legal approach is one that
is consistently adopted by Kosovo.

  ■■ 	 art 3: Recommendations for ECD programs and policies
      P
      Part 3 of the report identifies the gaps between the situation facing young chil-
dren (Part 1) and the policy response (Part 2). Given that the aim of this report is
to seed the development of a comprehensive programmatic response to ECD, by
examining situations that are currently unanswered and with potential negative rami-
fications for ECD, this section of the report provides recommendations for two broad
areas of action.

     Recommendations for two broad areas of action provided in Part 3:

  ■■ Area 1: Achieving equity in ECD: A Program for Kosovo
     	
      Recommendation a: ECD Parenting Program (birth to 3 years of age). The re-
sults of the study indicate that the greatest area of inequity for children living in pov-
erty is early education, in particular linked with rural populations and ethnic minority
                                                                                             5
groups. A strong recommendation is made to improve parental involvement for child
    health, education and protection. For example, for children’s education the MEST
    Education Strategy can be expanded to include parental involvement. Research in
    multiple other contexts has demonstrated that children’s success in education is
    largely linked with parental involvement, therefore there needs to be an emphasis on
    supporting parents and caregivers. It is recommended, however, that all sectors and
    relevant ministries join forces in ascertaining if their existing programs and activities
    can be boosted in the area of parental education, and agree upon a strong policy that
    transcends the borders of the disciplines such as protection, health and education.

          Recommendation b: Improving early learning programs (3 to 6 years of age).
    Only focusing on expansion and access to ECD can lead to limited success because
    providing more access to ECD services is not always accompanied by improvement
    in quality of services. Research shows that the quality of programs is the key ingredi-
    ent linked to improved child learning and development. In this recommendation, we
    present the situation for early learning and the limited policy response as a rationale
    for expanding the access and quality of early learning. This represents a vibrant and
    bold strategy to fulfill early child outcomes as a right and a predictor to later success.

      ■■ 	 rea 2: Strengthening Governance for ECD
         A
          Recommendation a: Coordinating effective implementation of sustainable
    systems for ECD. Creating sustainable systems for ECD requires infrastructure sup-
    ports to ensure that the programs and services are coordinated when necessary
    and implemented effectively. Vertical interventions and comprehensive approaches
    to ECD service planning and implementation require a governance infrastructure that
    outlines the roles and responsibilities of key members and stakeholders. Kosovo’s
    provision of ECD services remains primarily sectoral. The literature suggests several
    reasons why comprehensive approaches are invaluable for helping to build and sus-
    tain ECD programs. To increase ECD effectiveness by integrating budgets, planning
    and implementation processes, within and across ministries is strongly encouraged
    through an ECD Coordinating Committee. This recommendation provides guidance
    for creating such a committee, its roles and responsibilities, so that cohesive service
    delivery can be strengthened under the guidance of such a group.

           Kosovo is well poised to take on this program of activities to improve outcomes
    for its youngest children. Moreover, based on initial and preliminary cost estimates,
    the economic investment is not great while the returns are manifold both for young
    children and the development of Kosovo. It is hoped that the results of this report
    will inform the creation of a strong ECD program for Kosovo and one that can be
    financially sustained and scaled up to serve the most vulnerable and disadvantaged
    populations.


6
INTRODUCTION
         “Every child should have…a nurturing, caring, and safe environment – to
         survive, be physically healthy, mentally alert, emotionally secure, socially
         competent, and able to learn.”
         United Nations, A World Fit for Children Goal, 2002

     The goal of development, be it human, societal, or economic, is progression
towards potential (Hart, 2008). The interrelatedness of human, social, and economic
capital has been established and the role of human capital, in this inter-relatedness,
cannot be underestimated. A key input in building human capital is early childhood
development (ECD).

      What is ECD and why is it important? ECD is making a strong appearance on
the global stage because the national economic and social development paradigm
is shifting from purely economic progress to human well-being (Alderman & King,
2006). For low, middle, and high-income countries alike, investment in human capi-
tal formation has become a pivotal part of national development strategies (Mankiw,
Romer, & Weil, 1992). Concurrently, three fields of knowledge – neuroscience, eco-
nomics, and program evaluation science have independently established that invest-
ing in the early years pays the greatest dividend to human capital formation. These
three fields converge on one conclusion – early human development is indispensable
to development in general (Heckman & Kruger, 2003; McCartney & Phillips, 2006;
Shonkoff & Phillips, 2000).

     ECD is a multifaceted concept that covers the early childhood period from pre-
natal to 8 or 9 years of age, or until the transition to school is complete (UNICEF,
2002a; UNESCO, 2005) and consists of a set of coordinated services for young chil-
dren and families. Children’s development – as a result of good health, nutrition, ed-
ucation, early stimulation, positive social and emotional interactions with significant
adults/caregivers, play, learning opportunities, and protection from violence – gets its
best start during this important period (Britto, Ulkuer & Meyers, 2009).

     Within this age period, children make rapid strides in all aspects of develop-
ment through interaction with their environment (Richter, 2010). Seminal work in
the Developed World “From Neurons to Neighborhoods” (Shonkoff & Phillips, 2000),
commissioned by the United States Institute of Medicine, and more globally by the
World Health Organization, “Early Child Development: A Powerful Equalizer” (Irwin,
Siddiqui, & Hertzman, 2007), cogently culled and coalesced research from the neu-
robiological, social, economic, and behavioral sciences to demonstrate that early
childhood is also considered the key period for ensuring child survival and develop-
ment. The achievement of holistic development is due to mutual influences of early
experience and gene expression.

      The multidimensional aspects of ECD are comprised of several domains of
growth, learning, and development, including physical health, motor skills, cogni-
tive skills, social, ethical, spiritual and emotional development, competencies in lan-
guage and literacy, and sense of national identity, to name a few (Britto & Kagan,
2010). The scientific research and evidence on ECD specifies three main age periods
                                                                                           7
during which development occurs with differing risks and opportunities (McCartney
    & Phillips, 2006). Conception to age 3 is the period of most rapid growth of mental
    and socio-emotional capacities, as well as the key period for ensuring survival and
    adequate growth (Shonkoff & Phillips, 2000). Brain architecture is built in a “bottom
    up” sequence, thereby necessitating the appropriate development of early capaci-
    ties. The development of the brain incorporates experience, positive or negative,
    that shapes the brain’s capacities through a complex connection of neural circuits in
    different parts of the functioning brain (Davidson, 2002). For example, the impact of
    poverty on early development can be noted prenatal where the odds of a poor infant
    to be born with low birth weight are nearly twice that of a non-poor infant (Brooks-
    Gunn, Britto, & Brady, 1999).

          Through the early years, an increase in malnutrition, stunting, and often delayed
    gross and fine motor development is also noted (Chueng, Yip, & Karlberg, 2001; Ka-
    riger, Stoltzfus, Olney, et. al., 2005; Kuklina, Ramakrishnan, Stein, Barnhart, & Mar-
    torell, 2004). Poor nutrition and infection cause stunting, which has been linked with
    delayed cognitive and verbal development (McGregor, et. al., 2007). Interventions
    during this period tend to be made through health and nutrition services and systems
    of support to families and communities (WHO, 1999). It should be noted that most
    infant and young child deaths are preventable with adequate nutrition and protection
    against disease, for example exclusive breastfeeding, clean drinking water, hygienic
    sanitation, and oral re-hydration during illness (e.g., diarrhea) (Bartlett, 2005; Black,
    Morris, & Bryce, 2003; Lopez, 2000).

          In addition to the risks of poor health and nutrition, children need to be protect-
    ed from the risks of exposure to violence and stress (Garbarino, Dubrow, Kostelny,
    & Pardo, 1992; Osofsky, 1997). Young children benefit from positive and responsive
    interactions with at least one consistent caregiver, including exposure to language
    and opportunities for exploration and learning (Britto, Fuligni, & Brooks-Gunn, 2006;
    Richter, 2004). For example, verbal engagement between parents and young chil-
    dren is one of the strongest influences on subsequent language development (Hart
    & Risely, 1995), which occur primarily in homes and communities (Britto, Engle &
    Alderman, 2007).

          In the period from 3-5 years, in addition to continuing support for strong physi-
    cal health, disease prevention, cognitive and learning stimulation, and emotional and
    social responsiveness, children need protection from violence, abuse, and neglect
    within their homes. The issue of protection is particularly relevant as very young
    children who suffer violence in their homes lack the capacity to report it, while those
    who are able to report incidents of violence against them are afraid to report for fear
    of the consequences (Pinheiro, 2007). Protection of children is required to ensure
    their safety and security; in particular, recent efforts aimed at reducing the risk of
    disaster note an increase in childhood deaths due to accidents and lack of safety.
    Beyond protection and safety, children also need exposure to educational oppor-
    tunities in formal and non-formal group settings, pre-primary and preschool, family
    and community-based programs (Bowman, Donovan, & Burns, 2001; Zigler, Gilliam,
    & Jones, 2006) as increased participation of the family and wider community facili-
    tates early childhood development. Participation in such quality early learning and
    development programs has been linked with improved child development outcomes
    (Murphy & Burns, 2002).

        The period from 6 to 8 or 9 years is normally the transition to school, a time
    when group learning and socialization opportunities are likely to be highly effective
8   (Montie, Xiang, & Schweinhart, 2006; Vogler, Crivello, & Woodhead, 2008). Research
has indicated that development during this phase, sometimes termed as school
readiness, is linked to learning, school completion, later skill development, and ac-
quisition of academic competencies and non-academic success (Arnold, 2004; Ja-
ramillo & Tietjen, 2001; Coordinators’ Notebook 2008; Kagitcibasi, Sunar, & Bekman
2001; Pianta & McCoy, 1997; Reynolds, 2000; Rouse, Brooks-Gunn, & Mclanahan,
2005). Human capital is created through a strong foundational start. Children who
enter school ‘ready to learn’ are more likely to succeed at school, stay in school, and
achieve life-long learning and productivity in later adulthood. In addition to families
and communities, schools play a major role (Connell & Prinz, 2002), as the three pil-
lars of school readiness are; ready children, ready families and communities, and
ready schools (Britto, 2010).

       The crucial role of schools as the fundamental context for learning and devel-
opment is widely recognized. However, this development is especially vulnerable to
adversity and risk during this critical window of time, such as exposure to disease
and toxins in the environment as well as accidents and injuries (Morgan, Garavan,
Smith, Driscoll, Levitsky, & Strupp, 2001; Rodier, 2004). Environments can potential-
ly pervert development, often inalterably. Based on this scientific evidence of ECD,
initiatives attempting to improve young child well-being should provide opportunities
in environments in which all children, in the target population, are able to develop to
their fullest potential.

      Early child development does not take place in a vacuum; the context is an
important determinant of children’s development and achievement of developmental
potential. Several conceptual models posit factors and influences on early human
development. While each has merit in its own right, we present an amalgamation of
these models, given the purpose of developing a holistic approach to ECD. From
the rights-based socio-ecological perspective, children require supportive, nurtur-
ing, and stimulating environments, contexts and conditions in order to promote and
foster development (McCartney & Phillips, 2006). The support and promotion of
ECD occurs in the context of viable systems, with respect to provision of education,
health, protection, and social services (Britto, Cerezo, & Ogbunugafor, 2008).

       From a Rights perspective, within the framework of the Convention on the Rights
of a Child (CRC), a focus on ECD should take into consideration the fulfillment of chil-
dren’s rights to survival, development, participation, and protection (Britto, 2002). For
the ECD approach in Kosovo this translates into ensuring that policies accommodate
for the right of all children to survive and be healthy, to develop to their fullest poten-
tial in a holistic way across all domains of development, to be able to participate in
their environment as agents-of-change, and be protected from abuse, neglect, and
forms of disadvantage and vulnerabilities. In addition, this literature establishes links
to other policy alternatives to create an “enabling environment” for the duty bearers
to accomplish their tasks towards young children (World Bank, 2006). The condi-
tions of optimal development are created by the adult population. The most proximal
adults are the key caregivers and families who create environments conducive for
optimal development (Bornstein, 2006; Vygotsky, 1998). At more distal levels are the
members of the community who provide support through programs and services to
create these environments conducive for development. Situated at the most distal
levels are policy makers who create the policy and legislative structure that indirectly
impact environments for children (Hodgkin & Newell, 2007). Therefore, all levels of
duty bearers are important in creating an integrated and enabling environment for
ECD to ensure the survival, development and well-being of all young children.

                                                                                              9
STUDY OVERVIEW
          The aim of the study was to analyze programs and policies in Kosovo to under-
     stand how to improve outcomes for young children in keeping with their Rights and
     to their full potential. The findings of the study are used to generate program and
     policy recommendations for ECD in Kosovo. In this section, we describe the meth-
     ods and the structure of this report.


     Methodology
           To ensure the sustainability and implementability of policy and program recom-
     mendations, it is important that they are based on the analysis of relevant services,
     programs, policy frameworks and indicators. Therefore the study methodology was
     designed to ensure a systematic review and comprehensive analysis of currently
     existing programs and policies.


     Data Collection
           The main types of data collected consisted of the following: documents, mul-
     tiple statistical sources (including international sources), and in-person interviews.

           Documents that address ECD, through direct and/or indirect provisions, were
     reviewed. These documents included laws, strategies, regulations, program evalua-
     tions, and situation analyses. The documents addressed the key sectors that work
     with young children and families in Kosovo – namely education, health, and protec-
     tion (Appendix I, Matrix 1). Documents were made available through UNICEF Ko-
     sovo.

          In-person interviews were conducted with the following relevant partners and
     stakeholders:

           UNICEF Kosovo: Mr. Johannes Wedenig (Head of Office), Mr. Luciano Calestini
     (Deputy Head of Office), Ms. Aferdita Spahiu (Education Specialist), Ms. Kozeta Ima-
     mi (Education Project Officer, Education Unit), Ms. Arijeta Gjikolli (Program Assistant),
     Ms. Ivana Milosavljevic (Education Field Office, Zvecan), Dr. Agron Gashi (Health and
     Nutrition Specialist), Ms. Laura Fragiacomo (Child Protection Specialist), Ms. Beate
     Dastel (Monitoring and Evaluation Officer)

           MEST: Mr. Berdyna (MEST Head of development of the Pre –University Educa-
     tion) and Mr. Istogu (Head of Administration of the Pre-University Education), Mr. Hki
     Sfisha (MEST Director of Finance) Ms. Laberi Luzha and Ms. Merita Shala (MEST/
     Preschool sector), Remzi Salihu (Municipal Education Directorate, Director of Munici-
     pal Education)

         MoH: Ms. Merita Vuthaj (MoH /Mother, Child and Reproductive Health Officer)
     and Mr. Ilir Begolli (representative of Institute of Public Health)

          MLSW: Ms. Nazmije Krasniqi (MLSW/Human Rights Coordinator)
10
Organizations, institutes and NGOs: Save the Children, Kosovo Education
Center/KEC-Step By Step, Balkan Sunflowers.

     Visits and interviews were conducted on the following sites: Public Kin-
dergartens in Zvecan and Prishtina (Director and Educators), a Community-Based
ECE Center in rural Shkanaj (Educators), Prishtina City Hospital, Labor and Delivery
(Hospital Director and neonatal nurses)


  Table 1. List of agencies and data sources

Agency/data source
Action Against Hunger
Balkan Sunflower
European Commission Liaison Office to Kosovo (ECLO)
Global Finance (gfmag.com)
Government of Kosovo
HMO-solutions
Kosovo Institute of Public Health
Ministry of Science, Education and Technology (MEST)
Statistical Office of Kosovo
TransMonee Database
UN Interim Administration Mission in Kosovo (UNMIK)
UNDP
UNDP Kosovo
UNESCO Institute for Statistics
UNICEF
UNICEF Kosovo
United Nations Kosovo Team
World Bank
World Health Organization
World Health Statistics


Data Analysis
      The goal of the study is to understand the situation of ECD programs and poli-
cies in Kosovo and to generate policy and program recommendations in this report.
In order to achieve that goal, the set of selected documents, data sources and inter-
view data were analyzed jointly.

      1. Situation analysis of national socio-economic profile, programs and
state of young children. As previously stated, the development of children takes
place within concrete contexts. Therefore, the first set of analyses examined the
multiple layers of the social and economic contexts in Kosovo. Furthermore, it is im-
portant to understand programs and services as components of the context. There-
fore, the analysis focused partly on access to programs and services. The final type
of situation analysis was the examination of multiple indicators of child, family, and
population well-being. Cumulatively, these analyses provide evidence for areas of
need and priorities for child health, development, protection and participation, and
they also describe the context in which these needs can be fulfilled.

     2. Policy architecture analysis. The second set of analyses were undertaken
to understand the major statements and actors in policy making and provision for         11
ECD in Kosovo. This analysis involved a mapping of the main documents, name-
     ly laws, strategies, regulations, and statements. Content analytic techniques were
     used to extract information on purpose, goals, governance, finance, and implemen-
     tation dimensions of these documents. The content analytic techniques allow for
     an examination of inter-relationships between documents and overlaps, and gaps in
     areas essential for holistic ECD.


     Reporting of Results and Structure of the Report
           The report is presented in 3 parts with the 1st two parts presenting the results of
     the study. Part 1 presents the results on the situation of children with respect to the
     social, economic, political, and cultural context. Particular attention is given to child
     health, education, and protection outcomes as dimensions of ECD. The emphasis in
     Part 1 of the report is to build a case for ECD by presenting the situation of children,
     families, and services in Kosovo. Part 2 of the report presents the results of the
     analysis of the social policy landscape. The strongest and most meaningful actions
     to address social problems in a country are through policies and legal frameworks.
     Therefore, Part 2 of this report presents the results of the review of this landscape in
     Kosovo to understand how the policies are addressing the ECD situation. Part 3 of
     the report, based on the findings of parts 1 and 2, provides recommendations to ad-
     dress the gap between the situation of children and the policy response. The aim of
     Part 3 is to highlight and prioritize policy and programmatic actions that Kosovo can
     undertake to improve the situation of young children within the existing context. The
     sets of recommendations, in addition to drawing on the situation analyses presented
     in Parts 1 and 2, also draws upon the general scientific literature and programmatic
     and policy evidence on ECD. Also presented in Part 3 are very initial and preliminary
     cost estimates of the programmatic ECD recommendations. These estimates pro-
     vide a preliminary indication of the costs involved in scaling up the ECD centers and
     introducing parenting programs.


12
PART 1
SITUATION ANALYSIS
Introduction
PART 1 SITUATION ANALYSIS


                                 Part 1 of the document focuses on the circumstances in which Kosovar chil-
                            dren grow up today. The aim of this report is to make recommendations to enhance
                            the way children in Kosovo develop during the early years. For this purpose, it is
                            important to have a comprehensive understanding of the current state of the social,
                            economic and demographic context and of the state of the children.

                                  In principle, children’s living conditions can be divided into three main catego-
                            ries. The first category consists of socio-geographic conditions that are linked with
                            inequity in child outcomes and can be improved by policies. Included in this cat-
                            egory is Kosovo’s ethno-cultural and geographic background. The second category
                            consists of contextual factors that are influenced by government policies. However,
                            policies are typically not viewed as part of an ECD policy framework. For example,
                            pollution or poor air quality has a negative impact on children’s health, but it is through
                            environmental policy rather than through ECD policy that a government addresses
                            it. The third and last category focuses on contextual characteristics, most directly
                            associated with ECD policy in that they directly affect young children’s growth, learn-
                            ing, and development.

                                  Part 1 of the report is broadly structured along the lines of the three categories
                            above. Chapter 1 presents an analysis of the people in Kosovo, their demographic
                            profile, composition, migration, and the geopolitical background. Chapter 2 provides
                            an overview of the economic development and financial situation, thereby, also ex-
                            ploring the scope for enhanced investment in ECD. Chapter 3 addresses poverty,
                            with a particular focus on the nature and distribution of poverty and the social protec-
                            tion instruments aimed at alleviating it. Chapter 4 focuses on the health status of the
                            Kosovar people and children in particular, as well as the quality of and the access to
                            health services. Chapter 5 examines the contexts and conditions for early learning
                            and education.

                                  We preface Part 1 of the report with two notes. First, it is assumed that the read-
                            ership of this report is comprised primarily of Kosovar citizens. Therefore, the report
                            does not go into detail about topics that are well known to people living in Kosovo.
                            Second, as the monitoring and statistical system is weak in Kosovo (Commission of
                            the European Communities, 2009:22), data were limited and the available data are
                            not always uncontested. Despite these limitations, the authors decided to use the
                            available data to compile this situation analysis, as it is expected that the margins of
                            uncertainty are not sufficiently significant to invalidate the analyses.


14
­­­­­­Chapter 1: The People


                                                                                                                                                                       PART 1 SITUATION ANALYSIS
      The demographic profile of Kosovo, with respect to age composition and the
expected number of annual newborns, is examined, followed by a focus on ethnic
communities1 and the rural population (United Nations Kosovo Team, 2008:8). The
rationale for the age examination is inherent to the nature of this report, i.e., ECD,
which is a focus on age of human development. The focus on ethnic and rural com-
munities is important from an exclusion and equity perspective, as those populations
are the most disadvantaged.

      The latest estimation of the population of Kosovo is 1,733,872. It is a relatively
young population with almost 30% below age 15 and less than 7% above age 65
(figure 1). Males (boys and men) are graphed on the left and females (girls and wom-
en) on the right. Each bar represents five age cohorts (0-5, 5-10, et cetera) with the
youngest, most relevant to this report, at the bottom.

         Figure 1. Demographic profile of Kosovo for 2011
                                                                              Gender
                                                 Male                                                         Female


              100+                       6.5%                                                                     7.3%                            100+
              95-99                                                                                                                               95-99
              90-94                                                                                                                               90-94
              85-89                                                                                                                               85-89
              80-84                                                                                                                               80-84
              75-79                                                                                                                               75-79
              70-74                                                                                                                               70-74
              65-69                                                                                                                               65-69
 Age Groups


                                                                                                                                                          Age Groups


              60-64                                                                                                                               60-64
              55-59                                                                                                                               55-59
                                                                                                                             65.4%
              50-54                                                                                                                               50-54
                                   64.4%
              45-49                                                                                                                               45-49
              40-44                                                                                                                               40-44
              35-39                                                                                                                               35-39
              30-34                                                                                                                               30-34
              25-29                                                                                                                               25-29
              20-24                                                                                                                               20-24
              15-19                                                                                                                               15-19
              10-14                                                                                                                               10-14
                 5-9                                                                                                                              5-9
                 0-4       29.9%                                                                                                 27.2%            0-4

                       1,200 1,000         800      600       400      200                200      400      600      800     1,000 1,200
                                                                               Count

Source: Demographic, Social, and Reproductive Health Survey in Kosovo, November 2009


   1	         The term “ethnic communities” is the official terminology for ethnic minorities such as the Roma, the Ashkali and the Egyptians.
              Using this terminology, this report is in keeping with the Kosovo Constitution and the Law on the Protection and Promotion of the
              Rights of Communities and their Members in Kosovo (March 2008).                                                                                                15
Figure 1 shows that, before the transition years, Kosovo’s demographic profile
                                                          had the traditional shape of a pyramid with relatively high birth rates, i.e., children
                                                          born during the transition years are young adults now. The present generation of
PART 1 SITUATION ANALYSIS


                                                          20-25 years old is the largest and is entering the labor market during a time period
                                                          when the demand for labor is insufficient to absorb the large labor force supply,
                                                          thereby creating a glut. However, it should also be noted that given the relatively
                                                          smaller number of children entering the school system, compared to the previous
                                                          decades, the Kosovar education system may now have financial resources freed up
                                                          to invest in the quality of education. This provides a window of opportunity to close
                                                          the enrolment gap in preschool education because presently fewer children need to
                                                          be educated (we return to this point later in the report).

                                                                The annual number of births is an important indicator because it predicts the
                                                          demand for ECD services in the coming years. This indicator is likely to rise in the
                                                          near future because most births take place when parents are between 25 and 30
                                                          years of age (Statistical Office of Kosovo, 2008a: 16), which is Kosovo’s largest age
                                                          bracket. However, beyond this small birth-wave, it is hypothesized that there will be
                                                          a decrease in the number of newborns from 2015 onwards, as the number of citizens
                                                          in the most fertile age range will drop sharply. Figure 2 shows the development of
                                                          the annual number of births throughout the last three decades, as evidence for the
                                                          hypothesized size of the future ECD age cohort.

                                                                Figure 2. Number of births in Kosovo, 1981-2007
                            60000


                            50000


                            40000


                            30000


                            20000


                            10000


                               0
                                    1981
                                           1982
                                                  1983
                                                         1984
                                                                1985
                                                                       1986
                                                                              1987
                                                                                     1988
                                                                                            1989
                                                                                                   1990
                                                                                                          1991
                                                                                                                 1992
                                                                                                                        1993
                                                                                                                               1994
                                                                                                                                      1995
                                                                                                                                             1996
                                                                                                                                                    1997
                                                                                                                                                           1998
                                                                                                                                                                  1999
                                                                                                                                                                         2000
                                                                                                                                                                                2001
                                                                                                                                                                                       2002
                                                                                                                                                                                              2003
                                                                                                                                                                                                     2004
                                                                                                                                                                                                            2005
                                                                                                                                                                                                                   2006
                                                                                                                                                                                                                          2007
                                                                                                                                                                                                                                 2008
                                                                                                                                                                                                                                        2009


                                                          Source: Statistical Office of Kosovo (2008b), except the figure for 2009 which was found in the Statistical
                                                          Office of Kosovo (2010a:16)


                                                                The overall trend in figure 2 is downward, but the indicator could be considered
                                                          potentially unstable, adding a dimension of uncertainty to hypothesized population
                                                          projections. The two major events in the recent past – the transition years and the
                                                          war – have left their mark on the development of the number of births, which dropped
                                                          sharply between 1990 and 1991, recovered slightly until 1996, and showed a steady
                                                          decline until 2003. The emigration rate peaked in 1998 and 1999 at 15.0% and
                                                          9.6%, respectively, after a long period of very moderate emigration and even a few
                                                          years of net immigration (1992-1994). Since 2004, emigration has been in the order
                                                          of 0.7% to 0.8%. On the assumption that no major disruptive events will take place
16
in the coming decade, and taking into account that beyond 2015, the number of
young families will be lower than it is today (see figure 1). Based on these demo-
graphic trends, it is hypothesized that the annual number of live births will eventually


                                                                                                      PART 1 SITUATION ANALYSIS
stabilize at a level slightly lower than the present one, e.g. at 32,000.

     The ethnic composition of the population of Kosovo is provided in figure 3,
using two sources of data. The blue bars represent data from the Statistical Office
while the red bars represent data from the Ministry of Education, Science and Tech-
nology (MEST).

   Figure 3. Ethnic composition of Kosovo, 2010
100

 90

 80

 70

 60

 50

 40

 30

 20

 10

  0
                  Albanian                                 Serb                               Other


Source: Statistical Office of Kosovo (homepage of website, January 2011) and MEST (2010:15)


      The category “other” comprises a number of small minorities, of which some
are known to be significantly disadvantaged. A further breakdown of this category
was found for the number of live births in 2009. This indicator is relevant for the
purpose of this report because the number of births predicts the demand for ECD
services more precisely than the number of citizens of any age (which is the indicator
of figure 3). Figure 4 shows this ethnic distribution of live births. The data must be
treated with caution, as many births are not registered, especially among the Roma,
Ashkali and Egyptian, and Serb communities.


                                                                                                            17
Figure 4. Live births by ethnicity, 2009
                            100
PART 1 SITUATION ANALYSIS


                             90

                             80

                             70

                             60

                             50

                             40

                             30

                             20

                             10

                               0
                                        Albanian                 Serb                  Turk                Bosnian                RAE                   Other


                            Source: Statistical Office of Kosovo (2010a:20)


                                  At 0.1% the number of births in Serb communities is inexplicably low according
                            to these data. The Roma, Ashkali and Egyptian group (0.7%) is also smaller than
                            expected. Given that reliability of these estimates is to be established, an alternative
                            approach to the estimated ethnic composition was completed by MEST (2010:16) in
                            which enrolment figures in pre-university education were broken down by ethnicity
                            (figure 5). This alternative method validates the estimates presented in figure 3 for the
                            Albanian and Serb school population. However, it should be noted that the indicator
                            estimates in figure 5 are also slightly problematic as the enrolment rates to education
                            are not universal. As is demonstrated later in the report, the lack of universal enrol-
                            ment is linked with some children missing preschool and primary school, and others
                            dropping out before the age of 18. Additionally, these patterns of non-enrolment
                            and dropout are not equally divided across the eight groups in figure 5. Taking into
                            consideration these patterns, it can be estimated that Roma, Ashkali and Egyptian
                            comprise 2%2 of the school age population.


                             2	    More precisely: their shares are 0.3%, 1.1%, and 0.4%, respectively, which adds up to 1.8%, but it is widely known that
                                   educational exclusion at all levels is more common in this group than among the majority population. Hence, we round off to 2%.
                                   To test this estimation, it has been compared with older data from the Statistical Office of Kosovo (2008b:8). These data show
                                   that after a very steady increase between 1961 and 1991, the Roma population halved from 46,000 to 23,000 between 1991 and
                                   2006, while the overall population continued to grow (ibidem, page 6). Within a total population of 2.2 million, the 23,000 Roma
                                   would represent a share of slightly less than 1%. This largely exceeds the 0.3% share of the school population in figure 5, and the
                                   difference can perhaps not fully be accounted for by the educational exclusion that biases that figure. However, the discrepancy
                                   may well be because older data of the Statistical Office do not report separate data for Ashkali and Egyptian, and that these have
18                                 possibly been included in the category Roma.
Figure 5. Children 0-18 in Pre-University education in Kosovo, 2010
100


                                                                                                                  PART 1 SITUATION ANALYSIS
 90

 80

 70

 60

 50

 40

 30

 20

 10

  0
         Albanian           Serb           Bosnian          Ashkali          Roma   Turkish   Egyptian   Gorani


Source: MEST (2010:16)


      Finally, it is important to note that since 2001, the share of the Roma popula-
tion in the total number of births - according to a publication by the Statistical Office
(2010:14) - has by and large been equal to their share in the total population (ibidem
8). In other words, the birth rate is roughly the same as for the majority population,
which suggests that the share of Roma (and Ashkali and Egyptian) children of school
age is not likely to increase or decrease significantly in the near future.

      Together, the trends suggest that the size of the severely excluded ethnic groups
in Kosovo is relatively small. This implies that achieving equity requires more specific,
intense and very targeted interventions that can be made possible through political
will and improving parents’ knowledge and attitude towards schooling. Achieving
equity does not require the mobilization of substantial financial resources or over-
coming major technical barriers.

      Furthermore, great inequity is noted between rural and urban populations in Ko-
sovo. Unfortunately, official figures on the percentage of the population living in rural
areas could not be found3. The Statistical Office does publish breakdowns by munici-
pality and, although some of the municipalities are predominantly rural, some of their
inhabitants live in small towns. Vice versa, some predominantly urban municipalities
may be home to people in rural settings. Therefore, the breakdown by municipal-
ity cannot be the basis for a good estimation of the rural share of the population.
Despite the limitation on available disaggregated data, certain conclusions can be
drawn. In 2003, the UNMIK (2003:183) reported enormous uncontrolled migration
from rural to urban areas due to unemployment and lack of economic perspective.
The same source estimated the share of the rural population at 60% (page 8) or 60-
65% (page 166). More recent sources report the same 60%4, so it can be concluded
that the massive rural to urban migration has slowed down or even ended. Further-
more, the average number of children per family does not vary dramatically across
the municipalities (Statistical Office of Kosovo, 2008a:52), which is another reason to


 3	   A new Census, to be conducted in 2011, is likely to provide more clarity.
 4	   See for example, UNDP Kosovo homepage, accessed in January 2011.                                                  19
assume that the rural share of the total population may continue to be around 60%
                            in the future5. What has not remained stable, however, is the share of rural people
                            in poverty nationwide. Table 2 shows that in 2005/2006, no less than 81% of poor
PART 1 SITUATION ANALYSIS


                            people in Kosovo lived in rural areas, against 58% only three years earlier.


                               Table 2. Trend in poverty by location in Kosovo, 2002-2006

                                                                       2002/03                       2003/04                      2004/05                 2005/06
                            Rural                                         57.8                          66.1                         69.5                    70.9
                            Urban                                         42.2                          33.9                         30.5                    29.1
                            Total                                          100                           100                          100                     100
                            Source: Copied from World Bank (2007:45)


                                  Table 2 suggests that poverty is experienced by a significantly large percentage
                            of rural compared to urban families, almost in a 2:1 ratio. It should be noted that
                            even though geographic location appears to drive the poverty status, poverty, rural
                            geographic location, and ethnic identity are confounded. Therefore, all three dimen-
                            sions are accorded attention in this report.


                             5	   It could be the case that two trends have more or less neutralized one another in the past decade: some degree of rural-to-urban
                                  migration versus somewhat higher fertility levels in the rural areas. Another possibility is that internal re-migration, from towns and
                                  cities back to rural areas, is picking up as a result of the financial crisis. E,g., in Kyrgyzstan, increasing numbers of people manage
                                  better to survive unemployed in rural areas – where family and informal networks back them up - than unemployed in urban areas
                                  (van Ravens, 2010). This trend does, however, contribute to rural poverty and could (partly) explain the increase in rural poverty
                                  shown in table 2. In any case, the fact that the figure of 60% (the rural share of the Kosovar population) seems rather stable, may
                                  conceal various trends that partly compensate one another. This makes it difficult to predict the demand for (financial support to)
20                                ECD services.
Chapter 2: Economy and


                                                                                                               PART 1 SITUATION ANALYSIS
State Finance
      The guiding question for this chapter is, “will Kosovo be able to finance a sub-
stantial expansion and improvement of child services?” For a general assessment
of the financial possibilities of the state and citizens of Kosovo, economic growth is
examined. The annual increase, or decrease, of the Gross Domestic Product (GDP)
largely determines the income of citizens and it forms the basis from which the gov-
ernment can draw resources for public expenditure through taxation. Figure 6 shows
the development of GDP growth over the past decade.

   Figure 6. GDP growth in Kosovo, 2002-2011
  7

  6

  5

  4

  3

  2

  1

  0

  -1     2002      2003      2004       2005       2006      2007      2008       2009       2010       2011


Sources: World Bank (2007:2) for 2002-2006, and Global Finance website (www.gfmag.com) for 2007-2011.
Note: The figure for 2010 is an estimate and the figure for 2011, a projection.


        In the first years of the decade growth was negative on average (figure 6). This
was a sharp fallback after very high growth figures (of over 20%) in 2000 and 2001, re-
sulting from massive donor investment. The positive trend over 2006-2011 is mainly
due to another external factor: remittances sent by Kosovar people working abroad
in other European countries and regions of the world. The industrial and agricultural
sectors used to be the growth engines of Kosovo, but 10 years after the war, their
contribution to GDP growth has still not risen to previous levels (World Bank, 2007).
Instead, human labor is the main export product of Kosovo and this is likely to be a
dominant contributor to the economy and society of Kosovo for years to come. It is
hypothesized that for the growing generation of young children, this trend may make
it difficult to identify with a nation where wealth seems to come mainly from outside,
and where absent people (e.g., the “uncle in Germany”) serve as role models.

      For the purposes of this report, and based on the trend in GDP over the past
decade, an average growth rate of 5% is estimated. This estimate is in keeping with
the level of growth over the last five years shown in figure 6, and it is slightly more
conservative than the official forecast used in the Midterm Expenditures Framework
                                                                                                                     21
2010-2012 (Government of Kosovo, 2009:30). More volatile than growth, however,
                                              is inflation. High in 2008, negative in 2009 and moderate in 2010 (www.gfmag.com,
                                              accessed January 2011), the inflation rate makes it difficult to predict the purchasing
PART 1 SITUATION ANALYSIS


                                              power of citizens and state of Kosovo.

                                                    The next question is: what share of the GDP will be available for public expendi-
                                              ture? The answer to this question lies in the scope and commitment for enhanced in-
                                              vestment in child services. In 2006 and 2007, the Government’s revenues exceeded
                                              expenditures substantially, while Kosovo broke even in 2008 (UNDP, forthcoming,
                                              chapter 2). But for 2009 and 2010, a budget deficit is estimated in the order of 10%
                                              (Government of Kosovo, 2009:13), due to increased public expenditure both in sala-
                                              ries and capital investment. The Midterm Expenditures Framework expects a return
                                              to a balance in 2011 and 2012, which could, in principle, open up possibilities for
                                              financing child services. In order to test that hypothesis, we examine specific budg-
                                              ets.

                                                   As a result of Kosovo’s decentralization process, a large share of the budgets
                                              relevant to ECD – health, social welfare, education – is channeled from the Central
                                              Bank of Kosovo directly to municipalities. For example, all of the pre-university edu-
                                              cation – which includes early childhood education – is financed via the municipalities
                                              through the so-called specific grant for education. Similar specific grants exist for
                                              health and social welfare; a general grant for public administration. Table 3 shows the
                                              development of these grants over recent years and the near future.

                                                 Table 3. Municipalities’ budgets for health, social welfare, and education, 2009-2012

                            Grants and Municipal Own Source Revenues
                                                                                        Year 2009         Year 2010   Year 2011          Year 2012
                            for three years ( E mill.)
                            General Grant                                                          85.0        94.3          99.3            104.4
                            Specific Health Grant                                                  24.3        24.8          25.4             26.1
                            Specific Social welfare grant                                                      1.80           1.8              1.8
                            Specific Education Grant                                          103.6           108.5         114.0            114.0
                            Total Grants financing                                            212.9           227.6         238.8            246.3
                            Own Source Revenues                                                    37.2        50.4          50.9             51.4
                            Total Municipal Financig fron Grants and OSR                      250.1           280.4         289.8            297.7

                                              Source: Copied from Government of Kosovo (2009:35)

                                                   The data indicates that the budgets for health, social welfare, and education
                                              did not grow substantially (table 3). However, this growth is in accordance with the
                                              growth in total government spending. In fact, expressed as a percentage of total
                                              government spending, the budget for education grew more sharply between 2005
                                              and 2007 (figure 7). Given the fact that the large age cohorts born 20-25 years ago
                                              are moving out of the education system, this could imply that spending per student
                                              increased.


22
Figure 7. Sectoral breakdown of government spending, 2005-2007
      %                                                                                                                          2005          2006            2007
30


                                                                                                                                                                       PART 1 SITUATION ANALYSIS
              24
25


20     19.6                                                   19.4                                                                                          19.3
                   18.8                                              18.6
                                                                                                                                                       17.7     17.9
                                                                 15.7                                                                   15.5 16 16.7
15
                                          12.3
                                                       11.3                                             10.410.3
10                                               9.4                                                               10.3


 5
                                2.9 2.7
                          2.2                                                              2 1.5 2.2                      0.9 0.8 1.3
                                                                            0.1 0.2 0.3
 0
          General         Defence         Public order        Economic      Environ-      Housing and     Health          Recreation     Education        Social
           public                          and safety           Afairs       mental        community                      culture and                   protection
          services                                                          protection      amenities                       religion

Source: Copied from Government of Kosovo (2010:25)


      However, for reliable interpretation of government spending, it is important to
compare Kosovo to other similar countries. The TransMONEE-database contains
data on expenditure for countries in Central and Eastern Europe and the Common-
wealth of Independent States. For a selection of these countries, figure 8 shows total
health expenditure as a percentage of GDP. It should be noted that the analyses and
interpretation do take into account that Kosovo has experienced more recent and
greater conflict compared to some of the comparison countries, which implies that
it takes a country longer to recover to stability than non-conflict countries. Notwith-
standing the recent history of Kosovo, these comparisons are useful to make estima-
tions and projections for future investments.

     Figure 8. Health expenditure as a percentage of GDP in selected countries, 2005-2008
7
                                                                                                               2005             2006           2007          2008
6


5


4


3


2


1


0
            Kosovo                    Albania                   Bosnia              Croatia             Montenegro                Serbia                 TFYR
                                                              Herzegovina                                                                              Macedonia

Sources: TransMONEE Database (www.transmonee.org) except for Kosovo: UNDP (forthcoming).
Note: The indicator in figure 8 differs from that in figure 7 in that the former expresses health expenditure as a share of
GDP, and the latter as a share of total government expenditure.


                                                                                                                                                                             23
Figure 8 indicates that compared to the other countries, Kosovo’s investment
                                         in healthcare is relatively low. All other countries, except Albania, have much higher
                                         values with health expenditure as a percentage of GDP touching upon the threshold
PART 1 SITUATION ANALYSIS


                                         of 6%. West European countries, for reference, typically invest around 10% of GDP
                                         in healthcare. The fact that Kosovo is among the poorer countries in this group may
                                         not be a valid reason for the low levels of investment, as the numbers reflected in fig-
                                         ure 8 express investment as share of income, as opposed to an absolute amount. A
                                         low income would be an argument for a low absolute level of investment (expressed
                                         in euro per head of the population), but not for a low relative level.

                                              Figure 9 contains a similar comparison for the field of education. The selection
                                         of countries differs from that of figure 8 because of some missing data in the Trans-
                                         MONEE database.

                                            Figure 9. Education expenditure as a percentage of GDP in selected countries, 2005-2008
                            6
                                                                                                                             2005       2006        2007         2008

                            5


                            4


                            3


                            2


                            1


                            0
                                Kosovo         Albania              Serbia                TFYR                Slovenia               Bulgaria              Romania
                                                                                        Macedonia

                                         Sources: TransMONEE Database (www.transmonee.org) and, for Kosovo, Government of Kosovo (2010:25).
                                         Note: The indicator in figure 9 differs from that in figure 7 in that the former expresses health expenditure as a share of GDP,
                                         and the latter as a share of total government expenditure. As Kosovo does not appear as such in the TransMONEE database, its
                                         values in figure 7 have been used instead. These have been converted to match those of the other countries.


                                               Investment in education (figure 9) appears to be higher than investment in health
                                         (figure 8) for Kosovo compared to other countries. In particular, compared to border-
                                         ing countries, Kosovo performs well and shows a modest increase. A bigger gap
                                         exists between Slovenia, Bulgaria, and Romania, each of which are close to or above
                                         the OECD average of 5.3% (2006). The better performance in education compared
                                         to health can be explained by differences in age composition. With its relatively
                                         young population, Kosovo is bound to spend more on education than countries with
                                         aging populations; the latter are more likely to spend more on health.

                                              For social protection, the TransMONEE database does not provide for suitable
                                         comparative investment data. Therefore, figure 10 is drawn from a recent UNICEF
                                         report on Child Poverty (UNICEF Kosovo, 2010:9).


24
Figure 10. Spending on Social Protection in Kosovo and Selected Countries, 2008
20
       A. Spending on Social Protection


                                                                                                                                                  PART 1 SITUATION ANALYSIS
18                                                                                 17.2              17.5

16
                              15.0
14
                                                                                                                                       13.2
12

10                                                                9.7
                                                                                                                        8.3
 8
             7.1
                                                6.2
 6

 4

 2

 0                  0.4              0.9            1.3              1.4               0.3                  0.1                1.7          2.5
          Albania             BiH             Kosovo          Macedonia        Montenegro          Serbia             ECA             OECD
                                                                                                                    evarage          average
                                       Social Assistance Program                 Other Social Protection

Source: Copied from UNICEF Kosovo (2010:9). Original source: Gueoruieva. A. (2008).
Note: The indicator in figure 10 differs from that in figure 7 in that the former expresses health expenditure as a share of
GDP, and the latter as a share of total government expenditure.


      Kosovo has the lowest level of spending on social protection of these countries
(figure 10). At the same time, the share of social assistance within total spending on
social protection is the highest, which most probably reflects the high incidence of
poverty on the one hand, and the low spending on more structural forms of social
assistance on the other hand (e.g. Kosovo has no child benefit system). In the next
chapters, social protection, health and education are discussed in greater detail.


                                                                                                                                                        25
Chapter 3: Poverty and
PART 1 SITUATION ANALYSIS


                            Social Protection
                                  One of the fundamental questions regarding mitigating the negative impact of
                            poverty is the poverty reduction approach. Reactive policies, while attempting to
                            reduce poverty, tend to spend funds on alleviating the negative impacts of poverty.
                            However, more proactive approaches also concerned with reducing toxic poverty im-
                            pact focus more on investments that reap dividends over the long term. The European
                            Commission (Commission of the European Communities, 2008) clearly states that
                            Member States, which spend higher proportions of their GDP on social protection (ex-
                            cluding pensions), tend to have the lowest child poverty rates. The Commission also
                            notes (i) that social assistance benefits that are specially targeted at children – rather
                            than at families or adult family members – have the strongest impact on child poverty,
                            and (ii) affordable childcare makes a big difference in granting parents access to labor
                            markets (and thus tackling in part the causes of poverty). Based on the principle that
                            higher spending is associated with lower poverty levels, and the results reported in
                            figure 10, this chapter explores poverty and social protection in the Kosovo context.
                                  In an international comparison on poverty, the World Bank (2010) found that
                            close to 40% of all Kosovar people live on less than 2.50 US$ per day6. In Albania
                            this number is about 15%, Macedonia and Montenegro 10%, Serbia 2%, and Bosnia
                            and Herzegovina 3%. These estimates suggest that attention to the issue of poverty
                            and change in the strategies to address it is urgently needed. A recent study com-
                            missioned by UNICEF (Child Poverty in Kosovo, 2010) has developed comprehensive
                            policy options to expand and improve Kosovo’s system of social protection. This
                            chapter builds on the UNICEF study, a poverty assessment conducted by the World
                            Bank, and other accessible documents. However, prior to presenting an analysis of
                            the situation, the chapter begins with a mapping of poverty in Kosovo.
                                 Normally, the key driving force to poverty alleviation is economic growth. Further-
                            more, the development of the average income of the citizens, or per capita GDP, is a
                            strong indicator of growth. Figure 11 shows per capita GDP in Kosovo over the past
                            decade, including projections for 2011 and 2012.

                               Figure 11. Per capita GDP in Kosovo in €, 2003-2012
                             2500


                             2000


                             1500


                             1000


                              500


                                  0
                                        2003-2005           2006             2007             2008            2009             2010              2011             2012

                            Sources. The figures for 2003-2010 are from UNDP (forthcoming).
                            Those for 2011-2012 are projections by the IMF (http://www.imf.org/external/np/ms/2009/062409.htm)
26                           6	       Different poverty rates for Kosovo (and other countries) can be found in different studies. This is due to different definitions and
                                      thresholds that are in use for “poverty” and “extreme poverty”.
Kosovo’s per capita GDP is low compared to other countries: that of Albania is
twice as high and that of Macedonia almost thrice as high, while the gap with other
countries in the region is even larger7. However, a very steady upward trend in per


                                                                                                                                           PART 1 SITUATION ANALYSIS
capita GDP can be observed (figure 11). This increase is predicted to be associated
with a steady reduction in poverty levels. In order to test this prediction, the con-
struction of a trend-line for poverty in Kosovo was attempted. However, because
data for multiple years came from different sources, the generation of a trend line
was not possible. An alternative approach to assessing poverty trends is the World
Bank’s poverty assessment (2007), which uses data from household surveys held in
2003/2004 and in 2005/2006. These data show a small but clear increase in poverty
in the intermediate period of two years, even more so for extreme poverty compared
to more moderate poverty (World Bank, 2007:10).

       This small increase, however, conceals an area of concern: rural poverty had
risen sharply by 5 percent points from 44.2% to 49.2% in the two-year interval be-
tween the two surveys, while urban poverty had dropped by almost the same 5
percent points, from 42.1% to 37.4% (World Bank, 2007:21). This result could be
explained by the fact that the rural population is higher than the urban population;
the two opposite trends result on balance in a moderate upward trend at the central
level.

      Another finding that is contrary to predictions in trends is that poverty, for those
who are employed, has slightly risen while the number of poor people among the
unemployed slightly dropped (though it remained higher than that of the employed;
World Bank, 2007: iii). This counterintuitive finding suggests that the working poor
are facing decreasing salaries (taking inflation into account) and/or decreasing profits
from enterprises and farming, while many of the unemployed may have benefited
from increasing remittances and/or social benefits. Despite the possible explana-
tions, the case remains that the relationship between poverty in Kosovo and eco-
nomic efforts is complex in that growth of per capita GDP does not spill over to all
citizens, as expected.

      The unique combination of a rising average income and rising poverty levels in
rural areas can only be addressed through income policy. This area of policy is usu-
ally not seen as part of ECD policy, and it certainly is beyond the scope of this report.
Yet, an equitable distribution of income is critical in attacking child poverty, which is
urgently needed as table 4 shows. The table distinguishes three poverty lines8:

 ■■ The food or extreme poverty line. This is the most severe criterion. People un-
    	
    der this threshold live on €0.93 per day or less.
 ■■ The absolute poverty line. In this larger group, people spend €1.42 per day or
    	
    less.
 ■■ The international comparison rate. Spending up to $2.15 per day (about €1.58),
    	
    this is the largest group.


 7	   Kosovo is not always included in international datasets. Therefore, comparisons with other countries - based on similarly defined
      indicators and similarly collected data – are scarce. The findings reported in the text are from the so-called CIA-factbook, which
      does allow such a comparison. These data were found on: http://en.wikipedia.org/wiki/List_of_sovereign_states_in_Europe_by_
      GDP_(nominal)_per_capita.
 8	   Even more definitions of poverty exist, which explains why very different poverty rates can be found for Kosovo at the same
      moment in time.
                                                                                                                                                 27
Table 4. Poverty rates in Kosovo according to various definitions, 2006-2007

                                                                                                                         Childless                Households
                                                       General Population                      Children
                                                                                                                       Households                with Children
PART 1 SITUATION ANALYSIS


                            Food/Extreme
                                                                            17.5%                  18.9%                        18.0%                       17.3%
                            poverty line
                            Absolute
                                                                            46.2%                  48.6%                        38.3%                       45.3%
                            Poverty Line
                            2.15 a day
                                                                            62.3%                  65.4%                        49.4%                       60.8%
                            Poverty Line
                            Source: Copied from UNICEF (2010:21)


                                  Judging by the absolute poverty line – the most current – almost half of the
                            population of Kosovo is poor, and within this group, 17.5% live in extreme poverty.
                            Table 4 also shows that the figures for children are worse than for the general popu-
                            lation, in that households with children are poorer than those without (except for the
                            extreme poverty line where the two are nearly equal). It should be noted that pov-
                            erty amongst Roma Ashkali and Egyptian communities is substantially higher than
                            the average, while the Turkish, Bosnian and especially the Serb communities, fare
                            better than the average (UNDP, forthcoming). Compared to neighboring countries,
                            Kosovo’s poverty rates are by and large twice as high (UNDP, forthcoming).

                                  The association between poverty and child well-being, however, is also com-
                            plex. Access to potable water and sanitation is very important to children’s health.
                            Many families in Kosovo are deprived from these essential utility services, with the
                            difference between rich and poor being small: 42% of the poorer families and 36%
                            of the richer families9 lack these services (UNDP, forthcoming). This small difference
                            suggests that income policy and social protection alone are not enough to enhance
                            child well-being, and that Kosovo is in need of more policy interventions aimed at
                            expanding the coverage of utility services, especially in rural areas where coverage
                            is referred to as “substantially lower” by the UNDP (forthcoming).

                                  These results lead to the next set of questions aimed at understanding the in-
                            struments that Kosovo needs, in order to address poverty and exclusion from goods
                            and services. The palette is incomplete: a child benefit scheme and unemployment
                            benefits are lacking, while paid maternity leave was recently implemented in the pub-
                            lic sector but has not yet reached the private sector. In place are a social assistance
                            scheme, a pension scheme, and several more specific schemes for people affected
                            by war and disability. The social assistance scheme has a category 1 for poor fami-
                            lies with no access to the labor market, and a category 2 for such families also having
                            a child below the age of five or an orphan below fifteen (UNICEF, 2010:8). Since a
                            raise in 2009, the monthly rates are €40 for a single adult, €55 for a couple, and €5
                            extra for every child (with a ceiling of €80) (UNICEF, 2010:8). By comparison, the sal-
                            ary of a nurse is €180 per month on average. The World Bank found that the rates
                            tend to insufficiently follow changes in price levels (2007:28). An important innova-
                            tion is the specific assistance of €100 per month for families with disabled children
                            (0-18), introduced in 2009. Some allowances come with additional benefits such
                            as free healthcare10, reduced electricity prices, and compensation for fees paid for


                             9	  In this case, the criterion for being rich or poor is; having/lacking “basic goods and services” as defined in the Kosovo Mosaic
                                 Survey of UNDP.
                             10	 Essentially, healthcare is free in Kosovo, but small payments must be made for each visit (see next chapter). These are waived for
                                 people on social assistance. In addition, there are hardly any medicines available at the healthcare facilities, thus in most cases,
28                               the patients need to secure all the medicines and other medical supplies by themselves.
higher education. Fee compensation for preschool is not among these benefits, but
it would be a feasible option.

     A problem of the social assistance scheme is that it fails to reach many poor


                                                                                        PART 1 SITUATION ANALYSIS
people, whereas it does reach some richer people who are not entitled to it. Figure
12 shows the under-coverage of the social assistance scheme, which consists of
the number of people who should receive it but do not. In 2005/2006, this stands
at 77% of the poor people. In other words, only 23% really receive the benefit. Of
the extremely poor, 65.7% are not covered and only 34.2% receive the benefit. Be-
tween 2003/2004 and 2005/2006, the degree of under-coverage decreased slightly,
but what increased was leakage: the transfer of benefits to those who do not need it.


                                                                                              29
Figure 12. Under-coverage and leakage in the social assistance scheme, 2003-2006

                                                      80
                                                                   79.3
PART 1 SITUATION ANALYSIS


                                                                              77.0

                                                                                                      66.9        65.9
                                                      60
                                                                                                                                           Leakage to
                                                                                                                                          the non-poor
                                                      40


                                                      20                                                                                             21.8
                                                                                                                                         19.5


                                                        0
                                                                          Poor                        Extreme Poor                           Non-poor

                                                                                       2003/04           2005/06

                            Source: Copied from World Bank, 2007:31


                                 The combined effect of low coverage and low rates leads to a very small impact
                            of the social assistance scheme. The World Bank estimates that the current social
                            assistance instruments reduce poverty by only 2%; even the pension scheme has a
                            higher impact, at 4% (World Bank, 2007:30). Several proposals have recently been
                            developed to enhance the impact of social assistance, e.g. by Gassman and Roelen
                            (2009) and in the Child Poverty report of UNICEF (2010).

                                  Linked with poverty, but an issue of its own merit and consideration, is the
                            problem of abandonment, abuse, and neglect of children11. Both in 2008 and 2009,
                            the total number of abandoned, abused and neglected children in Kosovo was 66
                            (Statistical Office of Kosovo, 2009:23). Though this figure is difficult to benchmark
                            internationally, it does not seem to be exceptionally high. Kosovo’s infrastructure for
                            abandoned, abused and/or neglected children appears adequate with at least one
                            Center for Social Welfare in (almost) every municipality. Children are referred within
                            24 hours, based on the established criteria. The interview data, however, suggest
                            the following bottleneck: children who are recently abandoned find their first shelter
                            in a hospital, and their stay there tends to be longer than desirable.

                                  Beyond this stage, Kosovo has a network of 40 families who are well prepared
                            to foster children. In exchange, these families receive a fee of €150 per child per
                            month. There is broad consensus that such a network is much better than the in-
                            stitutionalization of children which used to be the dominant modality in countries in
                            Eastern Europe. Social Protection, in general, is decentralized to the municipal level,
                            which receives funding through a dedicated “specific grant”. The role of the Ministry
                            of Labor and Social Welfare is to develop policy, to set and maintain standards, and
                            to monitor.

                                  Within each Center for Social Welfare there is a Child Protection Unit. These
                            are not yet formalized, but a foreseen revision of the Family Law in 2012 may alter
                            this. Other innovations are (i) the implementation of the Case Management System
                            in 2005, where children are supported by one dedicated case manager who takes
                            care of contacts and consultation with the more specialized professionals, and (ii)

30                           11	 Unless indicated otherwise, the information in the following paragraphs stem from interviews, hence the scarcity of references.
the development of several manuals and protocols. However, formalization of these
schemes has yet to take place.

     The case management approach for abandoned children was adopted and


                                                                                           PART 1 SITUATION ANALYSIS
adapted from Kosovo’s juvenile justice system, where it was introduced by Terre des
Hommes, a Swiss-based international NGO. In this area, too, there is the intention
to mainstream the innovations after review and evaluation.

      Both for abandoned children and for juvenile justice, the case management ap-
proach has the potential to enhance inter-sectoral collaboration. Until now, effective
interaction between the fields of social protection, health, education, and justice is
lacking according to all those who were interviewed on this issue for this report. The
respondents noted that the system is not conducive for inter-sectoral collaboration.
For the case management approach to become fruitful boundaries must be broken
down and mentalities changed.

      A second major missing link is prevention. While a lot of attention is rightfully
accorded to children who are already abandoned, abused, neglected, or at risk of
becoming criminal, little is done by way of addressing the causes of these outcomes.
“The system is about victims, not prevention”, as one interviewee expressed it. It
should be noted that the analysis is limited at this point due to lack of data. However,
in the section addressing policy frameworks, this issue is elaborated upon further.

      In closing, this chapter also addresses child labor. Due to poor statistical data
on child labor, a thorough analysis of this child protection indicator was not possible.
However, there is broad consensus that child labor is widespread in Kosovo, and that
it can often be categorized as “Worst Form” and “Hazardous” (United Nations Ko-
sovo Team, 2008:11). This is due partly because of economic hardship (ibidem), and
to that extent it can be combated by poverty reduction strategies. Furthermore, there
is a cultural component that explains the persistence of child labor (ibidem). This
implies, once again, that the knowledge and attitudes of parents may be important
targets to trigger change in practices. Given the lack of objective information, this
report can only make the urgent recommendation to map and analyze this problem
with a view to develop powerful policies to strengthen ECD practices in the society.
May it be understood that the brevity of this paragraph on child labor does no justice
to the gravity of the problem, further research is needed.


                                                                                                 31
Chapter 4: Health Status
PART 1 SITUATION ANALYSIS


                            and Healthcare
                                  The health status of children in Kosovo is an area of concern, as indicated by
                            the data presented. Some of the causes of poor child health can be referred to as
                            “contextual” from the perspective of the situational analysis. Environmental deg-
                            radation12, poor waste management, rampant and irresponsible construction, and
                            neglect of natural resources need to be urgently addressed (UNDP, forthcoming), but
                            are typically not seen as part of ECD policy, rightly or wrongly. Likewise, limited cov-
                            erage of safe drinking water and sanitation threatens children’s health, as noted in
                            the preceding chapter. This is due to their limited policy association with ECD, which
                            is not addressed comprehensively. The focus of this chapter is on the health care
                            system as a policy intervention and the most proximal environment influencing early
                            childhood development, namely, caregiving and parenting practices that are linked
                            with poor child health, in particular breastfeeding practices.

                                  Causes of the problematic child health status are directly linked to the capacity
                            of the health system. Several interviewees emphasized that funding is insufficient for
                            proper execution of essential tasks (see also figure 8 of this report). The forthcoming
                            Human Development Report (UNDP) adds that, the resources that are available are
                            often not efficiently managed, thereby leading to waste. Furthermore, as explained
                            during the interviews, while nurses earn a salary that is low by international standards
                            (but can still compete with that of people who work at similar levels in other sectors in
                            Kosovo), specialists have an income far below that of others with a university degree.
                            Overburdened and under-funded, they no longer have access to international oppor-
                            tunities for continuing their education and training through conferences and need to
                            rely on increasingly outdated knowledge.

                                 Patients who can afford to pay fees opt out of the public health system and at-
                            tend private institutions, in various medical disciplines and sometimes abroad (World
                            Bank, 2008:ii). Those who opt out are rich, and probably well-educated. Their out-
                            of-pocket spending - equaling 40% of total health spending in Kosovo (World Bank,
                            2008:ii) – is directed at private providers and fails to support the public health sys-
                            tem, which is in need of committed stakeholders.

                                  The people who remain dependent on the public health system tend to be less
                            economically and educationally advantaged, and poorly organized; interviewees see
                            no beginning of a civil movement for better services. Ironically, the “symbolic” fees
                            that people need to pay in the public system are too low to make a big difference for
                            the funding of the system, but high enough to keep the poorest away from healthcare
                            (World Bank, 2008:ii). “Unofficial payments” also limit access (World Bank, 2008:46).
                            These financial thresholds result in low utilization rates in public primary health care
                            centers and hospitals (World Bank, 2008:ii).

                                 Figures 13-17 underscore the situation described above. The first set of indica-
                            tors concern the state of the children, the second the provision of healthcare. Life


32                           12	 Some children have more lead in their blood than instruments can measure (Mitrovica/e Institute for Health, 2008).
expectancy, in figure 13, is usually seen as the grand general indicator of the quality
of life in a country. It should be kept in mind that it depends not only on healthcare,
but also on contextual factors, healthy lifestyle and, more in particular for Kosovo,


                                                                                                                                                          PART 1 SITUATION ANALYSIS
tobacco consumption.

     Figure 13. Life expectancy at birth in selected countries, 2008
85
                                                                                                                                 All    Female     Male


80


75


70


65


60
          Kosovo           Albania          B and H           Croatia       Montenegro          Serbia           Slovenia        Macedonia       Eu-15


Source: World Health Statistics, 2006 except for Kosovo: Statistical Office of Kosovo, Vital Statistics Reports.
Note 1: B and H stands for Bosnia and Herzegovina.
Note 2: The vertical axis has been cut off at age 60.


      At 69 years, the life expectancy in Kosovo clearly lags behind that of nearby
countries and the gap with the EU-1513 average is eleven years. Yet, there is a clear
upward trend, from 67 in 2005 (UNDP, forthcoming). The UNDP notes that this is not
only to be ascribed to better healthcare, but also to a more general improvement of
living conditions since the War. It should be noted that Kosovo is recovering from a
conflict situation and therefore, this factor should be taken into consideration when
assessing the indicators in this chapter. Unfortunately, trend data are scarce for Ko-
sovo, which makes it difficult to assess development over time.

     Child mortality is considered high and among the highest in the region. The
perinatal mortality rate for 2010 is estimated to be 19.1 perinatal deaths (stillbirths
plus deaths during the first week of life) per 1,000 births. Based on the reported early
neonatal deaths for 2000 in Kosovo early neonatal mortality rate was 14.8 per 1000,
while for 2010 it is 7.8 per 1000. According to Perinatal Situation in Kosovo 2010,
perinatal mortality rate has not declined in comparison with 2009 and the perinatal
mortality rate in Kosovo is still high.

       Infant and under-5 mortality is largely preventable with adequate nutrition and
protection against disease, for example through exclusive breastfeeding, (e.g., Bart-
lett, 2005; Black, Morris, & Bryce, 2003; Lopez, 2000). In Kosovo, the rate of exclu-
sive breastfeeding is 16% during the first 4 months of life, and 12% over the first 6
months (Micronutrient Status Survey). Given that reduction in infant and U5 mortality
is a key goal for Kosovo, for ECD, an understanding of the situation of breastfeed-
ing practices is relevant. According to a study conducted by Action Against Hunger
(1999) with a sample of 900 women, up to one fourth of mothers do not breastfeed


 13	 Note that in the data-set used here, the EU had fifteen member states, mainly in West-Europe. This was before the wave of
     accessions of Eastern European countries.                                                                                                                  33
in the first 24 hours after birth and more than 1 in 10 mothers never14. While local
                            health care professionals do not agree with the exact results and statistics of this
                            study, they do support the main implication of the results, that breastfeeding and
PART 1 SITUATION ANALYSIS


                            infant feeding practices are a problem in Kosovo. Another source of information in
                            breastfeeding suggests that only 1 in 8 infants are exclusively breastfed for the first
                            4 months of life and that more than a third of mothers have stopped breastfeeding
                            completely by 6 months (UNICEF, 1997). Paradoxically, Kosovo’s cultural traditions
                            support breastfeeding. However, the practices neither reflect the tradition nor inter-
                            national standards of exclusive breastfeeding (Hormann, 1999).

                                 In 2009, the number of mothers who did not survive childbirth was 12. Based
                            on population data from chapter 1, this has been converted to a value of 43.3 per
                            100,00015 births, so that it can be compared with values of other countries. But
                            given the narrow statistical basis, this figure must be treated with utmost caution;
                            such a small figure can easily halve or double within a year.

                               Figure 14. Maternal mortality per 100,000 live births, 2005-2009

                             50

                             45

                             40

                             35

                             30

                             25

                             20

                             15

                             10

                               5

                               0
                                          Kosovo                   Albania                   Croatia                   Serbia                   Slovenia


                            Source: World Health Organization Database (data for 2000-2009), except Kosovo. Source for Kosovo: Perinatal Situation
                            in Kosovo for 2000-2009 (2010). The figure for Kosovo is for 2009.


                                  When it comes to stunting, the numbers in Kosovo are comparable to those in
                            Albania, but again much higher than in other nearby countries, as figure 15 shows.
                            It can be added that even East Asia and Latin America – regions where food afford-
                            ability is a big issue – fare better than Kosovo and Albania, with 16% of the children
                            suffering from reduced growth.


                             14	 While newer data might be available documenting the breastfeeding rates, these data were not accessible for the study analysis
                                 and report.
                             15	 The absolute number of maternal deaths in 2009 was 12. Given the number of births of that year, we estimate that this equals
34                               43.3 per 100,000 births.
Figure 15. Moderate and severe stunting in selected countries, 2007-2009
 25


                                                                                                                        PART 1 SITUATION ANALYSIS
 20


 15


 10


   5


   0
          Kosovo          Albania         B and H          Croatia      Montenegro          Serbia          Macedonia

Source: UNESCO Institute for Statistics, 2007, except for Kosovo: UNICEF, Nutritional Survey Report 2010.
Note: B and H stands for Bosnia and Herzegovina.


     These data raise the question: what can Kosovo do to improve the health status
of mothers and children? Evidence suggests that increased investment in ECD, in-
cluding parenting programs, might offer a solution. With respect to increased invest-
ment and health spending, as was indicated by figure 8 (Chapter 2), Kosovo spends
about half of the amount that other nearby countries spend on health. Figure 16
shows the development of health spending as a percentage of GDP (blue bars) and
as a percentage of total government spending (red bars), over 2004-2009.

   Figure 16. Health spending as share of GDP and of total government spending, 2004-2009
 12
                                                                     As % of GDP            As % of Govt. Spending

 10


   8


   6


   4


   2


   0
             2004               2005                2006             2007               2008                 2009

Source: UNDP, forthcoming


      Figure 16 shows that health spending is stagnant. Expressed as a percentage
of GDP as well as government spending, it is even on a slightly downward trend
since 2007. Although the geographical density of health facilities is still good, with
most people living on a reasonable distance from a primary health center (UNDP,
forthcoming), the number of personnel lags once again, far behind that of nearby
countries as figure 17 shows (Sweden has been added as a reference point). Den-
tists are particularly scarce.


                                                                                                                              35
Figure 17. Number of health professionals per 1000 inhabitants, selected countries, 2001-2006
                             12
                                                                                                 Doctors         Dentists         Nurses
PART 1 SITUATION ANALYSIS


                             10


                              8


                              6


                              4


                              2


                              0
                                      Kosovo           Albania        B and H          S and M         Croatia         Slovenia            Sweden


                            Source: World Health Statistics, 2006 except for Kosovo: National Institute of Public Health.
                            Note1: The data for Kosovo are for 2006. Those for the other countries are mostly from 2002-2004.
                            Note 2: B and H stands for Bosnia and Herzegovina. S and M stands for Serbia and Montenegro.
                            Note 3: The red bars (dentists) of Kosovo and Albania are hardly visible; the values are 0.06 and 0.03 respectively.


                                 The last issue to be addressed in this chapter is parental education: learning
                            and counseling activities for parents aimed at enhancing their parenting skills. Vari-
                            ous modalities exist and can be combined: group sessions, home-visits (on a one-
                            to-one basis), counseling of parents while in health facilities (e.g. for immunization or
                            on other occasions), mass-media, and advocacy.

                                  Ideally, parental education cuts across the boundaries of social protection,
                            health and education. In fact, this will be a key issue for this report’s policy analysis,
                            gap analysis, and recommendations. Parental education can be essential for the
                            prevention of child abuse, abandonment and neglect, which is the missing link in
                            the field of social protection as the previous chapter emphasized. Likewise, parental
                            education is critical for early learning and stimulation, the basis for further learning
                            in the education system and throughout life. But empirically, parental education in
                            Kosovo, as in many other countries in the region, is strongly health oriented. For that
                            reason only, it is presented in the health chapter.

                                  In the previous socialist health system, the specific home-visiting scheme was
                            implemented by the health facilities. With the introduction of the Family Medicine
                            Concept as the health reform resulting from the Health Policy for Kosovo in 2001 the
                            practice of home-visiting was set aside. The Family Medicine Concept, as explained
                            by the respondents, due to many issues was never fully implemented and it will take
                            time. The interview data suggest that on average, one doctor and two nurses cover
                            a catchment area of 2,000 inhabitants, with the doctor as the primary contact point
                            for patients, executing preventive as well as curative tasks. Respondents also noted
                            that by concentrating all services in buildings, the prevention dimension to the ap-
                            proach disappeared. The paradox of prevention is that it enhances awareness in
                            people who may have a low initial level of awareness, but don’t realize that they need
                            the service. They first need to be sensitized to the issues to become knowledgeable
                            about the problems and possible services to alleviate the conditions. Thus, reach-
                            ing out to these people requires the proximity that comes with home-visiting, and
                            the time and familiarity that comes with field workers who are in a better position to
                            offer services than the doctor in the Family Medicine Center. Another advantage of
36
home-visiting (and other modalities for parental education) is that it offers better op-
portunities for a more integrated approach, including elements of early learning and
social protection.


                                                                                                                                      PART 1 SITUATION ANALYSIS
      The main form of parental education has been through leaflets via health facili-
ties, outreach activities, health workers in Family Medicine Centers, and the broad-
casting of video clips. The leaflets and video clips aim to change behavior in areas
such as child care and development, early child education, infectious disease, hy-
giene, sanitation, nutrition, early stimulation, special needs, safe motherhood, et ce-
tera. An evaluation in 2009 showed good results. The Human Development Report
(UNDP, 2010) also notes that better public health information has led to improved
outcomes in recent years, e.g. with regards to iodine in pregnant women and chil-
dren.

      However, both the Human Development Report and several interviewees note
that there is a case for further enhancement of public health information. Potential
allies are the Red Cross as well as the health mediators, a role developed by the
Soros Foundation. Expanding the range of modalities, from leaflets to mass-media,
group-sessions, and home-visiting is important in order to reach those who need
the service most: the ethnic minorities and the rural poor, among whom we still find
many illiterate mothers unable to read the leaflets16. A legal framework and structural
funding from the Ministry of Health seems imperative. And as mentioned before,
broadening the content to include protection and learning would be very synergetic.


 16	 In rural areas, 9.5% of females aged 16-19 were found to be illiterate, and another 16.3% were weakly literate (United Nations
     Kosovo Team, 2008:8).                                                                                                                  37
Chapter 5: Early Learning
PART 1 SITUATION ANALYSIS


                            and Education
                                  The focus of this chapter is on all forms of learning during early childhood.
                            Therefore, it addresses all activities and services that enhance holistic development,
                            ranging from the earliest stimulation within the family (including forms of parental ed-
                            ucation that support this) to the more formalized learning settings, such as daycare,
                            preschool, and pre-primary education. Following the format of the social protection
                            and health chapter, first a situation analysis of the state of the children is presented
                            followed by evidence on the quality and coverage of the relevant services.

                                  A problem in the assessment of the state of the children when it comes to
                            learning is that Kosovo has not yet participated in international surveys of learning
                            achievement. The data available pertains to educational attainment with respect
                            to diplomas, certificates, and degrees that Kosovo’s youth obtain. This is not an
                            entirely reliable indicator because education systems differ in terms of selectivity;
                            e.g. attaining a diploma from higher secondary education can require more learning
                            achievement in one country than in another. Taking into consideration this difference,
                            selected core indicators of the education system of Kosovo are presented in table
                            5. This table does not include preschool and preprimary education; this will be dis-
                            cussed in-depth, hereafter.

                               Table 5. Core indicators for Kosovo’s education system, school-year 2008-2009

                                                             Number of                                     Gross Enrolment Survival Rate in
                            Education Phase                                      Compulsory
                                                             Years                                         Ratio           Last Grade
                            Primary                          5                   Yes                       103.9                        -
                            Lower Secondary                  4                   Yes                       114.7                        91.0%
                            Upper Secondary                  3                   No                        81.8                         53.4%
                            Tertiary                         Varied              No                        ±17                          -
                            Source: Ministry of Education Science and Technology (2008/2009:33-41)
                            Note: The Gross Enrolment Rate for tertiary education is lacking in the above-mentioned source. The 17% is an estimate
                            of the authors, based on the fact that 33,984 students were enrolled in 2008-2009, whereas the total population in the
                            relevant age range is about 200,000 (see figure 1 of this report). It is a rough estimation, merely serving as a broad
                            indication.


                                 Since a major reform in 2000/2001, Kosovo’s education system consists of a
                            primary cycle of 5 years, a lower secondary cycle of 4 years - together adding up to
                            9 years of compulsory education17 – as well as an upper secondary cycle of 3 years
                            and higher education courses of varying length. Remarkably, the Gross Enrolment
                            Ratio is above 100 for primary education and well above 100 for lower secondary
                            education18. This ratio can exceed the value of 100 when many children enter before

                             17	 The team was informed that there are plans to abolish the 9th grade of compulsory education. This would be a step in the wrong
                                 direction.
                             18	 These enrolment ratios must be treated with caution since population data are unreliable. We know how many children are in
38                               school in absolute numbers (the numerator), but we don’t know the population (the denominator).
or after the official entry age. It is even possible that some children never attend,
and that this is (over-) compensated by over- and under-aged children. ECD has the
potential to enhance timely entry in primary education, especially when combined


                                                                                                                                              PART 1 SITUATION ANALYSIS
with close interaction with parents (Engle et al, 2007).

      While survival rates in the first three grades of lower secondary education are
high, it drops to 91% at the end. Furthermore, 83.4% of the students make the
step from lower to upper secondary (Ministry of Education Science and Technol-
ogy (2008/2009:42), where the Gross Enrolment ratio stands at 81.8%. The survival
rate in upper secondary is very low at 53.4%. Internationally, completion of upper
secondary education is seen as a condition for successful entry in the labor market
(World Bank, 2009:7). In fact, reducing the number of youth who fail to complete up-
per secondary education is one of six key benchmarks of the European Union (Com-
mission of the European Communities, 2002). Yet, many students in Kosovo drop
out before attaining this level.

      As previously said, high Gross Enrolment Ratios can conceal pockets of exclu-
sion. The NGO Balkan Sunflower (2010:2) – quoting EU sources – reports that less
than half of the Roma, Ashkali and Egyptian children attend primary education; that
less than 20% are in school beyond age 12; that 4.5% complete secondary school;
and that a mere 40 young people from a Roma, Ashkali or Egyptian background are
studying in higher education19. Unless action is taken urgently, there is a serious risk
that educational exclusion is passed on to younger generations, sustaining the cycle
of poverty and marginalization. ECD can play a key role, as the activities of Balkan
Sunflower illustrate.


      In the age range between birth and entry in primary school, Kosovo has
five types of programs:

 ■■   	Pre-primary education;
 ■■    	 ublic preschool education, usually referred to as the kindergarten;
       P
 ■■    	 rivate preschool education;
       P
 ■■    	 ommunity-based ECD centers operated by the NGO EveryChild;
       C
 ■■    	nformal day-care/babysitting centers20.
       I

      Figure 18 shows the development of the absolute numbers of children attend-
ing these programs, with the exception of the community-based centers and the in-
formal centers, as these centers do not appear in official statistics. In 2005, Szczurek
reported that between 1999 and 2005, a total of 600 children between the ages of 3
and 6 had benefited from the program (Szczurek 2005:5). However, this data does
not provide information about the structural capacity of this program on an annual
basis, but it does suggest that this program is of a smaller order of magnitude than
the other ones. For private preschool, the only figure available is for 2008, showing
its order of magnitude, but not its development over time.


 19	 Since the total number of RAE people in Kosovo is rather small, their low degree of educational participation has little effect on the
     total figure.
 20	 These centers are comparable to the private provision, but they differ from these in that they form a cheaper option for many
     struggling young couples. However, they meet no official standards and are not monitored by the government. Hence they can be
     dangerous and lack sanitation and other essential facilities.                                                                                  39
Figure 18. Numbers of enrolled children in three early childhood programs, 2004-2009
                                 25000
PART 1 SITUATION ANALYSIS


                                 20000


                                 15000
                                                                                                                                     Public Pre-School
                                                                                                                                     Private Pre-School
                                 10000
                                                                                                                                     Pre- Primary

                                  5000


                                       0
                                              2004         2005           2006          2007          2008          2009


                            Source: Shala & Luzha (2010:6)

                                  It is important to note that figure 18 presents absolute numbers of children and
                            not enrolment rates. As indicated in figure 2 at the beginning of this chapter, the an-
                            nual number of newborns has been about 35,000 on average in the relevant years, but
                            it has somewhat fluctuated. This suggests that the enrolment ratios may have been
                            more volatile than the blue and green bars suggest. It remains a fact, however, that the
                            capacity – the number of “child-places” – in public preschool has hardly changed since
                            2005 (blue bars in figure 20), and that the capacity for pre-primary education actually
                            decreased since 2006 (green bars). Each of the four early learning programs mentioned
                            above are discussed next.
                                  Pre-primary education – referred to as Grade 0 in the KESP21 - is a one-year
                            trajectory before entry in primary education, which ideally takes place at age 6. Thus,
                            in pre-primary one will find 5 or 6 year-old children, depending on the date of birth.
                            The preparation year can be offered in various institutional settings: primary schools,
                            preschools or kindergartens, and community centers. In some cases, teachers from
                            one preschool, travel to more remote communities to deliver the programs on site in
                            other preschools. Whatever the setting, the program complies with established quality
                            standards and remains an official program under the aegis and legal framework of the
                            government.
                                  There appears to be a broad consensus that the preparatory year is critical for
                            successful entry in primary education and that, by implication, it needs to be part of
                            the compulsory cycle. Indeed, the second draft of the Curriculum Framework for pre-
                            school, primary, secondary, and post-secondary education (Ministry of Education, Sci-
                            ence and Technology, 2010a: 17) proposes a new structure for the education system in
                            which this would be realized by 2012. This contradicts the Kosovo Education Strategic
                            Plan that aims at universalizing the pre-primary year by 2016 (Ministry of Education, Sci-
                            ence and Technology, 2010b: 43). This issue needs to be revisited, as the documents
                            appear contradictory, i.e., make compulsory in 2012 what does not become available
                            until 2016.
                                  The current coverage of the pre-primary year, expressed as a ratio, was 70.1% in
                            the 2008-2009 school year (Ministry of Education, Science & Technology, 2008:34). In
                            that same year, the number of children from ethnic minorities was 593, mainly Bosniak,
                            Ashkali and Egyptian (Shala & Luzha, 2010:15). These 593 children represent 3% of

40                           21	 KESP stands for Kosovo Education Strategic Plan (Ministry of Education, Science and Technology, 2010b:20).
the total number of children in pre-primary (ibidem), while the share of these particular
groups among the total population is about 1% (see figure 4 of this report). Clear data
could be found on disparities between urban and rural children within pre-primary enrol-


                                                                                                                                     PART 1 SITUATION ANALYSIS
ment.
      The (absolute) number of children with special needs in pre-primary is estimated
to be a mere 17 (ibidem). Although it is not possible to convert this into a ratio, this fig-
ure is alarmingly low and warrants further investigation. On the positive side, it must be
added that promising initiatives for inclusive education have been taken by a number of
preschool institutions (Pëllumbat e Paqes in Gjilan; Gëzimi ynë in Pristine; and others)
and SOS Kinderdorf (ibidem). Finally, there are about 5% more boys than girls enrolled
in pre-primary education (Ministry of Education, Science & Technology, 2010b:44). This
is remarkable as gender gaps in early childhood education are rare even in many low-
income countries.
     The costs of universalizing pre-primary education are relatively low. The excluded
proportion of 30% represents 8,432 children22. Assuming a teacher-pupil ratio of 1:20,
and taking into account that it concerns a half-day program, it is estimated that 211
teachers – or fulltime equivalents – are needed, against an annual salary of €2400 (Shala
& Luzha, 2010:18). The total annual salary costs would be €505,903. With an additional
20% for utilities and replacement of materials and inventory, the total recurrent costs
would be in the order of magnitude of €600,00023. For reference, the total education
budget is €130,861,859. The cost requirement of €600,000 is 0.46% of the education
budget.
      This small proportion can be found by, for instance, creaming off a very small frac-
tion from the higher education budget, which is disproportionally high (United Nations
Kosovo Team, 2008:8). Another potential source is a reduction of the government’s
subsidy to the elite that have access to full-day kindergarten (see next paragraphs).
Finally, it is important to note that even if the education budget does not grow as a pro-
portion of GDP, it will still grow as a result of GDP growth, which is assumed to stand at
5% (see chapter 2 of this report). This would imply an increase of the education budget
with €6,543,093, which is more than ten times the resource requirement of €600,000.
Note that the 5% increase is cumulative – every year, another €6.5 million will be added
to the budget – while the resource requirement is structural. After a few years of moder-
ate economic growth, the budget increase will have dwarfed the resource requirement.
      Universalizing the pre-primary year has become extremely urgent. This has to
do with the exclusion paradox. When only a few children have access to a prepara-
tory year, the excluded child is not alone; it belongs to a large majority. The education
system – the curriculum, the expectations of the teacher – will be tuned to the needs of
the vast majority that is unprepared. But at an enrolment ratio of 70%, the education
system will slowly adjust itself to the ones who are prepared, consciously or subcon-
sciously. Teachers will adjust their teaching strategies to the prepared children. The
unprepared children will be in an even more difficult situation than ever before. True, a
70% enrolment rate is better than 10%, but the last 30% deserve to be attended to as
soon as possible. Closing the gap is urgent and of relative low cost. The fact that the
total capacity for pre-primary education has remained stagnant ever since 2005 (see
figure 18) is alarming.
      Delivered in 43 mainly urban kindergartens, public preschool education is divided
in childcare for children 1-3 years old and education groups for those 3-6 years old
 22	 This is found by multiplying the current number of 19674 by 30 and dividing the outcome by 70.
 23	 Investment costs can remain limited since existing space if often used for pre-primary education. In any case, the investment
     costs occur only once, they are not structural.                                                                                       41
(Ministry of Education, Science and Technology, 2010b:41). Two sources report that
                            the enrolment ratio stands at 10% (e.g. United Nations Kosovo Team, 2008:8; Shala
                            and Luzha, 2010:3), while another source reports 12% (UNDP, forthcoming). A fourth
PART 1 SITUATION ANALYSIS


                            source mentions a rate of 4% (HMO-solutions, 2009:6)24. Neither of these figures could
                            be reproduced exactly. If we divide the 5,000 children enrolled in preschool (see figure
                            18) by six times the 35,000 children in each age cohort (0 to 5, including 5), the result
                            would be a ratio of about 2.5%. The aforementioned authors may have included the
                            1,440 children in private kindergartens to the 5,000 in public institutions, but this does
                            not bring us much closer to the other estimates. Another possibility is that the other es-
                            timates are based on a narrower age range, for instance the children of 3, 4 and 5 years
                            old (i.e. just the education group, not the daycare group). In this case, the numerator
                            drops by 1,133 (Statistical Office of Kosovo, 2010b: 10) from 5,000 to about 3,850, while
                            the denominator drops to 3 times 35,000. This time, the result is a ratio of 3.7%, which
                            is fairly close to the 4% estimated by HMO-solutions, and still significantly different from
                            the estimations of 10% and 12%.
                                  Adopting the estimation of 3.7%, we compare this enrolment ratio in figure 19 with
                            that of other countries in Central and Eastern Europe and the Commonwealth of Inde-
                            pendent States. All of these countries have similar preschool systems. The enrolment
                            ratios of these countries are plotted against their per capita GDP, for reasons explained
                            in the figure below.
                               Figure 19. Preschool enrolment by per capita GDP in the wider region, 2008
                                                                             100,0

                                                                              90,0
                               NetEnrolm. Ratio Preprimary, ages 3,4 and 5


                                                                              80,0

                                                                              70,0

                                                                              60,0

                                                                              50,0

                                                                              40,0

                                                                              30,0

                                                                              20,0

                                                                              10,0

                                                                               0,0
                                                                                     0   1.000   2.000   3.000   4.000    5.000   6.000    7.000   8.000

                                                                                                 GDP per capita (constant US$ year 2000)

                            Sources: Transmonee database, except for Kosovo. Per capita GDP for Kosovo is from UNDP (forthcoming) and preschool
                            enrolment is calculated by the authors of this report.
                            Note: Included in the figure are all countries in the region Central and Eastern Europe and the Commonwealth of Inde-
                            pendent States, except Slovakia, Georgia, Turkmenistan, Uzbekistan (no data for preschool) and Slovenia (outlier with
                            comparatively high per capita GDP). The red dot represents Kosovo, the green dots are Moldova, Ukraine and Belarus.

42                           24	 The figure reported by HMO solutions concerns the year 2006. But this cannot explain the difference with the other figures, since
                                 back in 2006 neither the number of children in kindergarten nor the total age group was very different from today.
Figure 19 suggests some important implications. Kosovo is the red dot in the
lower left corner of the grid. It has the lowest preschool enrolment but it does not
have the lowest income. Although at first sight the regression line suggests that


                                                                                                                           PART 1 SITUATION ANALYSIS
there is a positive correlation between wealth and enrolment – the richer the coun-
try, the more children in preschool – the line’s position is strongly determined by the
group of seven countries in the upper right corner of the grid. These countries are
Croatia, Czech Republic, Estonia, Hungary, Latvia, Lithuania, and Poland. Most are
EU members, some are OECD members, and all are generally more developed and
form a separate group. If we would delete these countries from the grid, there would
hardly be any correlation left between wealth and preschool enrolment. Within the
remaining countries, Kosovo has a middle position in terms of income. The green
dots in the upper left corner are (left to right) Moldova, Ukraine, and Belarus. The
first two have much higher enrolment levels than Kosovo despite a clearly lower per
capita income. Only slightly richer than Kosovo, Belarus has the highest enrolment
of all countries, inluding the seven rich ones.

      The reason why a country’s wealth does not determine preschool enrolment is
that a kindergarten is a home-grown service. Nothing in it comes from abroad. So if
the average income in country A is twice as high as in country B, teacher salaries will
also be twice as high. Similarly, the construction workers who build the facility and
the salaries of those who produce the construction materials follow the same trend.
Therefore, while the citizens of country B are twice as poor, the preschool service is
twice as cheap and therefore equally affordable as in country A.

       However, the rationale above still does not explain Kosovo’s exceptionally low
position on the grid. An important factor is the high unit cost. Figure 20 provides a
first indication; further elaboration of this point follows after the figure.

   Figure 20. Unit costs as % of per capita GDP in kindergarten in six countries, 2007-2010

 80

 70

 60

 50

 40

 30

 20

 10

   0
          Armenia        Kosovo        Kyrgyzstan      Macedonia        Moldova          Poland         Romania

Sources: van Ravens (2010:46-47 and 2011:27), except for Kosovo. The unit costs of full-day kindergarten in Kosovo was
estimated, based on information from various sources about the fee that parents pay (varying from €25 to €30, ignoring
very high fees charged in public kindergartens in Pristine) and about the state contribution (varying from €75 to €120).
The fee and the state contribution have been added up and were divided by per capita GDP.
Note: Although the data in figure 20 stem from different years (2007-2010), the unit cost for each country was always
divided by the per capita income of the same year in which that unit cost was observed. In Romania, about 75% of all
enrolees in kindergarten are in a half-day program, which explains the low unit cost.


                                                                                                                                 43
The six countries in figure 20 have very similar preschool systems, with very
                            similarly equipped and programmed kindergartens. They provide opportunities for
                            play and learning, meals, dormitories, and are staffed with caregivers, teachers,
PART 1 SITUATION ANALYSIS


                            cooks, cleaners, and administrators. Few countries in Western Europe can afford
                            to provide this expensive service on a heavily subsidized basis, and the countries in
                            figure 20 only provide it for a small and privileged elite, mainly consisting of double
                            income families. But even in this group of countries, Kosovo is exceptional in that
                            its unit cost – expressed as a percentage of average income – towers above that of
                            the other countries, at almost thrice the average of the other countries. This trend
                            points to a considerable inefficiency and over-resourcing. There seems to exist no
                            pressure or incentive towards cost efficiency despite the fact that a large percentage
                            of children in Kosovo are growing up in poverty.

                                  For a good understanding of figure 20 and its implications, it is important to note
                            that the per capita income of a country is an abstraction: it is the total income of a coun-
                            try divided by all its inhabitants, including the economically inactive such as children,
                            youth, and elderly. Few people earn exactly the average income; most earn several
                            times the average income. Teachers, for instance, earn typically 2 to 3 times the per
                            capita GDP (UNESCO, 2004:165) so that they can sustain a family of, for instance, two
                            adults and two children on one income. In Kosovo, this is not the case. Teachers and
                            nurses earn hardly more than once the average income, which points at a very inequita-
                            ble distribution of wealth. This hypothesis is supported by the finding (in chapter 2 of this
                            report) that a rising average income goes hand in hand with rising unemployment lev-
                            els. Some people in Kosovo must be accumulating wealth from mainly external sources
                            (remittances, aid) and this wealth does not spill over sufficiently to the unemployed and
                            to the working poor in the countryside. It is in this context that the government contrib-
                            utes about €4 per day25 to just the care of a privileged child, while half of the children in
                            Kosovo have less than €1.42 per day (table 4 of this report) to cover all of their needs:
                            food, clothes, housing, et cetera. Another way of expressing this paradox is by stating
                            the fact that more taxpayers’ money goes to one child in kindergarten than to the social
                            assistance of a family with six children.

                                   This section on public kindergarten concludes with data on disparities. Of the 5,091
                            children enrolled in 2008-2009, 316 were from ethnic minorities, in this case mostly
                            Roma, Turkish, and Bosniak (Shala and Luzha, 2010:14). This represents 1.77% of all
                            enrolled children. While this is only a small proportion both of total enrolment and of the
                            number of children within these ethnic groups, it does correspond broadly with the share
                            of these groups within the total population. The presence of these children is most prob-
                            ably the outcome of a policy to reduce or waive the fee for a maximum of 10% percent
                            of all child-places in the kindergartens. In 2008-2009, 47 disabled children were enrolled
                            in the kindergartens (ibidem), a little more than one per institution. Official figures on the
                            urban-rural divide were not found, but as kindergartens hardly exist in rural areas, the
                            enrolment of rural children is bound to be very low.

                                  Very little is known about the private preschool institutions. Shala and Luzha
                            (2010:15) estimate that 35 of such kindergartens exist, enrolling 1,440 children in
                            2008. They also note that some of these institutions used to have a license, but these
                            have expired. Other private kindergartens never had a license so presently none of
                            the private kindergartens operate under any legal framework. No data are available
                            on essential aspects such as teacher qualifications, program, and methodology. The
                            fee is estimated at €80 which is thrice the fee in the public kindergarten, but since
                            there is no state contribution, the fee equals the unit cost. Therefore the unit cost is

44                           25	 The government’s share in the unit cost is in the order of at least €80 per month, during five days per week. This makes €4 per day.
much lower than in the public system. This division of roles between public and pri-
vate is unusual. Normally, countries have a public system for the masses, while rich
elites can opt out and choose higher quality services and pay the cost price. We see


                                                                                                                                        PART 1 SITUATION ANALYSIS
this in healthcare, education, transport, et cetera. But in Kosovo’s preschool system,
it is the public system that functions as the luxury option. And since it is heavily sub-
sidized, there is no strong market push for private provision26.

      The fourth and last service for early learning in Kosovo concerns the Communi-
ty-based ECD Centers. These Centers are based on a well-tested and cost-effective
approach to early learning that is successful in many countries around the world,
rich and poor. Moldova and Kyrgyzstan are good examples of countries that are
comparable to Kosovo and where these Centers have proven to reach out to remote
and disadvantaged communities and tailor their programs to local needs. In Kosovo,
there were 27 such Centers in 2005, operated by several NGOs of which Every-
Child was the largest. At the time, EveryChild ran 16 Centers with the assistance of
UNICEF (Szczurek, 2005:4-5).

     Unlike the regular kindergartens, their primary function is not to care for children
so that parents can work. Instead they are entirely focused on child development,
providing pedagogical activities that are well tuned to children’s age and stage of
development. The Centers target children of 3, 4 and 5 years old in their catchment
areas. The children are attended to in short daily sessions, which explains the low
costs. Spaces in existing schools and community buildings are normally used.

      In fact, in an economical sense, the real costs are minimal. In its Human De-
velopment Report for Kosovo, UNDP (forthcoming) stresses the need to develop
rural areas by creating employment opportunities in the so-called non-farm sector,
especially for women. The organization sees this as a critical strategy to enable the
rural population to lift itself beyond subsistence living. By appointing 40 rural women
as teachers/caregivers (Szczurek, 2005:5), EveryChild created opportunities in areas
where hardly any salaried employment existed. Through the so-called multiplier ef-
fects, these women’s salaries will create an impulse in the local economies. This cre-
ates strong arguments for government to invest in community-based ECD: not just
to enhance child development, but also to stimulate rural development more directly.

      However, the government in Kosovo has not supported the momentum towards
community-based ECD, and most municipalities lack the resources and/or the vision
to make things happen. While it is one of the hallmarks of this approach that parents
and communities contribute financially to some extent – this enhances local owner-
ship and shared responsibility – it is not the case that they should sustain the Centers
entirely. Structural co-financing from the state is critical for the Centers’ sustainabil-
ity. Indeed, many of the original 27 Centers had to close down in recent years. At
this moment, only 5 Centers are said to be sustainable, while Save the Children – an
international NGO that runs large numbers of community-based ECD Centers all
around the world – has withdrawn from this activity in Kosovo.

      Given the government’s ambition to expand preschool education – this will be
elaborated in Part 2 of this report – it is interesting to note that the unit costs per
child per month in community-based ECD are low27. This is broadly consistent with
the finding in several other countries that full-day kindergarten is about 4 to 6 times
more expensive than half-day programs in Centers (van Ravens, 2010:48 & 2010:63).

 26	 For an elaborate discussion of such policy dilemmas, see chapter 5 of “Fair Play”, a report on preschool education in Macedonia,
     also available in Albanian and English (http://www.unicef.org/tfyrmacedonia/).
 27	 For a similar but slightly more complex program, Balkan Sunflower spends €35 per child per month.                                        45
Box 1: Insights from the team’s visit to a rural Community Based ECE Center in Shkabaj

                                  Fifteen children and two teachers welcome us mid-day into their classroom.
                            The children engage in free-play in a small room with a broken window and an
PART 1 SITUATION ANALYSIS


                            exposed wood stove that releases heat, a sharp burning smell, and a thin fog.
                            The community-based center sits on a hill neighboring a primary school. One of
                            the teachers is uncertain about the future of the center.


                                   Dependant entirely on parental fees and facing infrastructural and adminis-
                            trative challenges, the sustainability of the initiative is unpredictable. The same
                            teacher, however, is optimistic about what the center represents for the children:
                            it enables them to interact, socialize and engage in basic learning processes.
                            The quality of the center (from the perspective of infrastructural safety, learn-
                            ing materials, and adherence to curricular standards) is a stark contrast to the
                            better supplied, financed and regulated public ECD centers we visited closer to
                            Prishtina. Despite the availability of start-up costs, the Center lacks resources
                            for its upkeep and quality daily operations. However, the Community-Based ECE
                            Center is located strategically just outside Prishtina and has the unique potential
                            to reach underserved young children in the area. With the support of the commu-
                            nity, the Center presents an opportunity for government intervention and multiple
                            stakeholder commitment to early childhood education.


                                  In conclusion, based on an analysis of the 4 early learning institutions – pre-
                            primary grade, public and private kindergarten, and community-based centers –
                            it appears that missing from the approach are services oriented towards parental
                            education. Even if all children in Kosovo attend early learning programs from age
                            3 onwards, through currently existing programs, the critically important age range
                            of 0-3 would still not be covered. Worldwide, parental education, in groups and/
                            or through home-visiting, is seen as a good strategy to fill this gap. The same
                            was said in previous chapters regarding health and protection. So, the case for
                            integrated content is strong. Part 3 of this report will further elaborate on this.


46
PART 2
POLICY ARCHITECTURE ANALYSIS AND
    ASSESSMENT OF ECD PROVISION
Introduction
PART 2 POLICY ARCHITECTURE ANALYSIS AND ASSESSMENT OF ECD PROVISION


                                                                            Part 2 of the report presents the findings of the content analysis of Laws, Sec-
                                                                      toral Strategies, Strategic/Action Plans, curricula, and regulations that address the
                                                                      service provision for the youngest children in Kosovo. Since there is an absence
                                                                      of an ECD policy or policies in Kosovo, the documents analyzed herein provide the
                                                                      planning frameworks through which priorities, objectives, targets, and/or activities
                                                                      are set. The planning frameworks may be directed towards the entire population,
                                                                      a sub-set of the population (i.e. school-aged children, minorities, individuals with
                                                                      disabilities), or specifically towards children 0-6 years of age. Disaggregating the
                                                                      provisions within the policy and planning frameworks by age ranges (early or late
                                                                      childhood) allows for the following analytic process:

                                                                       1.	 	dentify the main priorities and strategies by the Government of Kosovo (as evi-
                                                                           I
                                                                           denced in the sampled documents) that set the service and programmatic stage
                                                                           for Kosovo;
                                                                       2.	 	dentify how the needs of the youngest children are addressed within the pro-
                                                                           I
                                                                           grammatic frameworks. Differentiating services that target a sub-population of
                                                                           all ages (i.e. minorities, individuals with disabilities, all school-aged children) is
                                                                           important because they may or may not reach children 0-6 via spillover effects;
                                                                       3.	 	dentify potential services and/or programs that are inclusive of and/or specifi-
                                                                           I
                                                                           cally targeted towards young children. This allows for planning coordination ef-
                                                                           forts and for a systematic understanding of the necessary policy interventions
                                                                           needed to achieve coordination of ECD services for all children;

                                                                           This part of the report addresses the legislative/strategic basis for ECD provi-
                                                                      sion and utilizes documents to lay a comprehensive map of the centrally-led efforts
                                                                      to address the health, education and protection of Kosovo’s youngest children. It
                                                                      is important to mention that the analysis presented herein does not inform how the
                                                                      downstream implementation processes are being conducted and/or fulfilled. To as-
                                                                      sess challenges in the implementation of services, programs and activities, a sys-
                                                                      tematic dissection of the systems, institutions and actors responsible for delivery is
                                                                      required. From the sampled documents we have extracted:

                                                                       1.	 	 summary of the sponsoring sectors involved in the completion of the docu-
                                                                           A
                                                                           ment;
                                                                       2.	 	 summary of frameworks relevant to the endorsement and development of the
                                                                           A
                                                                           document’s content;
                                                                       3.	 	 description of the vision, indicators, and other key components within the
                                                                           A
                                                                           document;
                                                                       4.	 	 n extraction of elements within that document (i.e. objectives, targets, activi-
                                                                           A
                                                                           ties) explicitly targeted towards Early Childhood.

                                                                           Based on sampled documents, the analyses herein assesses objectives and
                                                                      targets that have specific provisions/activities targeted torwards young children. The
                                                                      content analysis of the documents will be used to: 1) evaluate alignment between
                                                                      goals and needs of young children and; 2) build the policy and strategic recommen-
                                                                      dations in Part 3 of the report.
48
Chapter 1: Legislative Framework


                                                                                             PART 2 POLICY ARCHITECTURE ANALYSIS AND ASSESSMENT OF ECD PROVISION
      An analysis of relevant laws is followed by an analysis of strategies and strate-
gic plans.


Law on Education in the Municipalities of Kosovo
Sponsoring sectors and driving frameworks

      The purpose of this law, which was signed in 2008, is to regulate the organiza-
tion of public educational institutions and the provision of public education at the
pre-primary, primary, lower secondary, upper secondary and higher education levels
in the municipalities of Kosovo. The sponsoring sectors are the Ministry of Educa-
tion, Science and Technology of the Republic of Kosovo (MEST), and the municipali-
ties in accordance with the Law on Local Self Government.

      MEST is responsible for ensuring that the educational system is in keeping with
the education goals of Kosovo. The Ministry is responsible for the design, imple-
mentation, coordination, and supervision of educational institutions (pre-primary to
higher) in the municipalities. Municipalities shall have full power with respect to the
implementation of education in the jurisdiction as it concerns local interests. How-
ever, this must be aligned with standards and provisions with respect to pre-primary
to higher education. For example, where required that municipalities should have the
competency to create conditions for providing educational services in the Serbian
language, which are in keeping with the guidelines and standards of MEST. For every
aspect of the education system, the law provides for coordination and joint execution
between MEST and municipalities for the effective functioning of the system.


Goals, strategies and extraction of ECD-specific provisions
      With respect to ECD specific provisions, it is the pre-primary and primary
schools that are most relevant. The law states that the municipalities support pre-
primary and primary education in accordance with general guidelines, regulations
and standards of MEST for construction of educational facilities, registration and
admission of students, selection and employment of teachers, school personnel and
director, training educators and other professional staff in accordance with guide-
lines, principles and standards of MEST, supervision and inspection of the education
process in accordance with guidelines established by MEST, and monitoring and
reporting on students’ educational and social progress to parents should be fol-
lowed. The municipalities have to provide educational administration services that
are required for effective functioning of pre-primary and primary schools.
      Particular guidance is provided for the registration, public health and safety in-
spection and licensing of pre-primary educational institutions. The law states (i) that
reporting on pre-primary level education, budgetary and management operations
to municipal governments and MEST should be in accordance with municipal and
central legislation, and (ii) that determination of the parents’ participation fee for the
admission of children to nurseries and kindergartens be in accordance with Kosovo’s
laws.
                                                                                                              49
PART 2 POLICY ARCHITECTURE ANALYSIS AND ASSESSMENT OF ECD PROVISION


                                                                      Law on Preschool Education (2006)
                                                                      Sponsoring sectors and driving frameworks
                                                                             The law on preschool education is promulgated by the Constitutional Frame-
                                                                      work for Provisional Self-government in Kosovo with the purpose of setting a legal
                                                                      base for the regulation, progress, and improvement of preschool education. The
                                                                      principles framing the law are equality, inclusion of children with disabilities, demo-
                                                                      cratic process of implementation, staff autonomy, professionalism and responsibility,
                                                                      equal capacities for children and parents, taking into consideration changes between
                                                                      children, the right to be different, and all-inclusive development of children’s person-
                                                                      ality. The main implementer of the law is MEST.


                                                                      Goals, strategies and extraction of ECD-specific provisions
                                                                           The goals of the law are stated with respect to early holistic development and
                                                                      include multiple domains of development, including; language, social development,
                                                                      appreciation of culture and society, artistic and creative appreciation knowledge
                                                                      of science, ability to learn, physical development and good hygiene, good mental
                                                                      health, and positive attitude towards life.
                                                                             The role of the preschool institutions is to support the parents in child care-
                                                                      taking and education; promote quality for children and family life; create conditions
                                                                      for development of individual potential of children, and its manifestation; and create
                                                                      conditions for the increase of capabilities of the children in fulfilling the tasks and
                                                                      obligations presented by the school. Ensuring preschool education is the responsi-
                                                                      bility of the community, particularly in situations where there is no public preschool
                                                                      institution. Communities are required to either organize a preschool or to request
                                                                      the municipal preschool education to extend the capacity of preschool institutions.
                                                                      Every preschool has to have an annual plan and program for one academic school
                                                                      year, which should be provided by the Steering Committee of the preschool institu-
                                                                      tion to MEST administration.
                                                                            With respect to the curriculum for the preschools, all educational programs
                                                                      should be based on general curriculum approved by MEST, Experts Council and
                                                                      School Textbooks. However, the preschools can develop their own curricula objec-
                                                                      tives based on this general guidance. Parents should be given the information on the
                                                                      curriculum in the language of instruction, which is in most cases is Albanian. But in
                                                                      areas with large ethnic minorities, local languages should be used. Education pro-
                                                                      gram providers for preschool education in public institutions, should be selected by
                                                                      the Municipal Assembly.
                                                                            Parents have the right to select a preschool program for their children in either
                                                                      a public or a private institution. However, the way of selecting the programs is regu-
                                                                      lated with administrative instruction. For children who cannot attend preschool insti-
                                                                      tutions because of their disability, formal preschool education in the family should be
                                                                      organized in compliance with the Law and the administrative instruction.
                                                                           As per the Law, preschool education programs can be financed by: the Kosovo
                                                                      budget, Founders, fees paid by families, donations, and other recourses. The Law
                                                                      states that the owners of the preschool institution are obliged to provide funds for
50
its establishment and functioning. The difference between the cost price of the edu-
cational program and the fees paid by parents should be provided by the municipal
budget on financing personal incomes, goods, employees’ tariff in institution and


                                                                                               PART 2 POLICY ARCHITECTURE ANALYSIS AND ASSESSMENT OF ECD PROVISION
expenses for materials in compliance with standards.
      MEST and other competent bodies are responsible for monitoring and super-
vision. Monitoring information should be collected, stored, and shared in order to
provide preschool education, monitor activities and use statistics to project needs.
The way of collecting data should be regulated by administrative instructions. The
supervision of implementation of this law and the provisions issued from this law are
the responsibility of MEST.


Family Law of Kosovo
Sponsoring sectors and driving frameworks
      The Family Law of Kosovo was signed in 2004 to uphold the value of the family,
which is seen as a vital community of parents and their children and other members
of the kin. Protection of rights is the driving framework for this law as it pertains to
social protection and the protection of the family and the children. As per the law, the
family is recognized as the natural and fundamental nucleus of society and needs to
be protected. The legislative provisions for social assistance and protection of the
family come into play only when required. With respect to children, this law recog-
nizes the protection of children’s rights and the responsibility of both parents for the
growth and education of the children until they are 18 years of age. The law also
recognizes the social protection needs of children with no parents and those who
are vulnerable due to disabilities and who are unable to take care of themselves. In
addition, the law provides specific guidance on financial arrangements in the family,
property arbitration, financial responsibilities, and procedures to appeal when basic
rights are violated.


Goals, strategies and extraction of ECD-specific provisions
      With respect to ECD, the law offers several types of protection for young chil-
dren. Paternity and maternity of children are recognized and protected. Child pro-
tection provisions in this law are strong with respect to the child’s right to life, to grow
up in a family with parents, to receive special service if they have a disability, to be
eligible for free of charge primary school, and to be protected from abuse, child traf-
ficking, labor, and use of drugs. The law states that both parents are obliged to take
care of, educate and feed their children, even in situations of separation, divorce and
marriage annulment. Parents are primarily responsible for their children, including
ensuing that the emotional, social and material welfare of their children is ensured.
With respect to adoption, custody and foster care of vulnerable young children, the
law provides protection against abuse and neglect, while ensuring that the young
children receive the protection of public institutions.


Law on Social and Family Services
Sponsoring sectors and driving frameworks
      As per the Constitutional Framework for Provisional Self-Government in Koso-
vo, in 2005, the law on Social and Family Services was established for the regulation
and advancement of social and family services for persons in need and families in                               51
circumstances where there is no family support or where the welfare of an individual
                                                                      cannot be ensured. The Law is based on the Kosovo Legislation and the Interna-
                                                                      tional Human Rights Conventions.
PART 2 POLICY ARCHITECTURE ANALYSIS AND ASSESSMENT OF ECD PROVISION


                                                                            The Ministry of Labor and Social Welfare is responsible for the governance of
                                                                      services that fall under this law including, direct social care, counseling, and mate-
                                                                      rial assistance. The Ministry is responsible for the development of policies and the
                                                                      preparation of strategic plans for the provision of Social and Family Services in a
                                                                      manner that ensures equal access to Services without any discrimination, such as
                                                                      race, ethnicity, gender, etc. The Ministry is responsible for ensuring that these poli-
                                                                      cies and strategic plans are implemented according to the standards of regulations
                                                                      by municipalities and other organizations, that international and government agen-
                                                                      cies, non-government organizations and the private sector coordinate their efforts in
                                                                      providing and supporting services, and to encourage community participation and
                                                                      the development of community initiatives related to social welfare. However, the final
                                                                      decision regarding where, how and by whom these services will be delivered, includ-
                                                                      ing the right to provide these services, rests directly with the Ministry.
                                                                             The Institute for Social Policy, a Department within the Ministry of Labor and
                                                                      Social Welfare, is directly responsible for the implementation of this law. The Institute
                                                                      is also responsible for the development and promotion of professional knowledge,
                                                                      skills and standards in the area of Social and Family Services through research, train-
                                                                      ing, and consultations with service provision systems. However, it is the General
                                                                      Social and Family Services Council who is responsible for the maintenance of pro-
                                                                      fessional standards for professionals working in the field and who is the licensing and
                                                                      registration authority for Social and Family Services.
                                                                           Each Municipality, through its relevant Directorate, is responsible for ensuring
                                                                      the provision of Social and Family Services within its territory to a standard specified
                                                                      by the Ministry of Labor and Social Welfare. Municipalities establish and maintain a
                                                                      Centre for Social Work that is responsible for implementing this law.


                                                                      Goals, strategies and extraction of ECD-specific provisions
                                                                           There are no ECD-specific provisions in this Law. However, the Law does ad-
                                                                      dress children in general and many of the conditions that impact child well-being and
                                                                      are addressed in this Law are also experienced by young children. Therefore, the
                                                                      goals, strategies and provisions in this Law that could be considered important for
                                                                      ECD have been extracted below.
                                                                            As per the Law, the state, through the governance bodies described above, has
                                                                      the responsibility to take care of children who have been orphaned of both parents,
                                                                      placed for adoption, abandoned, whose parents are unknown, or who have been
                                                                      placed by their parents in the care of the Centre for Social Work. A Ministry ap-
                                                                      pointed Child Placements Panel has the responsibility to approve of and allocate fos-
                                                                      ter or adoptive parents. These decisions are made based on specific set of guides
                                                                      provided in the Law that pertain to the child’s age, background, and abilities of the
                                                                      foster or adoptive parents. In other words, the best match between the child and the
                                                                      new family context is considered when making such a decision.


52
Chapter 2: Strategies and Plans


                                                                                                                                                              PART 2 POLICY ARCHITECTURE ANALYSIS AND ASSESSMENT OF ECD PROVISION
      Six key strategies, relevant to the health, education and protection of children
are analyzed below. Figure 21 illustrates the sectors involved in the development
and implementation of the strategy/plan, and overarching and ECD-specific objec-
tives/targets.

 Figure 21. Sectoral involvement in strategies and plans & analysis of overarching and ECD-specific objectives objectives


                                                               Overarching Objectives/Targets                                      ECD Objectives/Targets
                Strategy/Plan
                                  2-Improve management of existing resources and quality of services                                       1-To decrease
                                  3-The function, reorganization and the completion of the existing infrastructure of                      morbidity and
                                  the healthcare system and the procurement of medical equipment in accordance                            mortality of the
                   Strategy
                   Health
                   Sector


                                  with European standards                                                                              overall population
                                  4-Continuing implementation and development of Health Information System                              (inclusive of but
                                  5-To establish e sustainable funding system of the health sector                                        not specific to
National
                                                                                                                                                    ECD)
 Sector
                                  1-Healthy and supportive environment
                                  2-Appropriate physical and healthy environment
   HEALTH


                   Promoting
                   Schools


                                  3-Sufficient human and material resources
                   Health


                                  4-Continuous and qualitative care for pupil’s health
                                  5-Low level of violence within schools
                                  6-Level of health and environmental culture of the pupils


                                  3-Quality Improvement/Training
                                  4-Curricula and Standards                                                          1-Inclusion in pre-primary education
                                  5-Management and professional capacity                                              2-Inclusion in pre-school education
                      KESP


                                  6-Developing pre-school expertise                                                                      (Explicit to ECD)
                                  7-Awareness raising activities
   EDUCATION


                                  2-Prevention of discrimination and segregation in the system of education                 1-To improve school-commu-
                                  3-Meaningful and efficient cooperation between relevant institutions and                 nity cooperation and increase
                    Integration


                                  organization serving for improved education of RAE communities                             community responsibility for
                                  4-Increasing awareness among involved parties on the need to support                        education in rural areas (in
                    of RAE


                                  the education of members of RAE communities                                                  order to develop an active
                                                                                                                           partnership in school manag-
                                                                                                                             ment) - (Inclusive of but not
                                  1-Health                                                                                               specific to ECD)
                                  2-Eudcation
   PROTECTION


                                  3-Employment
                                  4-Social protection
                   Action Plan


                                  5-Accessibility
                   Disability
                   National


                                  6-Statistical Data


                                  1-To improve school-community cooperation and increase community responsi-
                                  bility for education in rural areas
                                  3-To provide education adapted to the learning needs of children in rural areas                2-To increase participa-
                                  4-To increase participation of rural people in relevant non-formal education and             tion and retention of rural
                   Integration


                                  training programmes (adult education), especially linked to income generation                  children, especially girls
                                  5-To improve the physical and material resources of rural schools and ensure at
                   of rural
                   people


                                                                                                                              and minority groups, in ba-
                                  least a minimum level of resources necessary for the teaching process                        sic education (pre-school
                                  6-To establish a reliable and accessible education information system (not only               and primary school) and
                                  related to rural schools)                                                                     develop oppurtunities for
                                  7-To develop the management capacity and organizational structure of rural                   their enrolment into post-
                                  schools                                                                                          compulsory educaiton
                                  8-To develop the human resources of education in rural areas by improving the                          (Explicit to ECD)
                                  recruitment, training and retention of teachers in rural schools


                                                                                                                                                                               53
PART 2 POLICY ARCHITECTURE ANALYSIS AND ASSESSMENT OF ECD PROVISION


                                                                      The Strategy for Health Promoting Schools in Kosovo


                                                                      Sponsoring sectors and driving frameworks

                                                                            The Strategy for Health Promoting Schools in Kosovo was released in 2008
                                                                      and represents the basic framework through which the education, health, environ-
                                                                      ment, youth, and business sectors, along with other stakeholders, were provisioned
                                                                      a program to increase the quality of education in a healthy school environment. The
                                                                      Committee on Health Promoting Schools began to function in 2003 and in 2005 a
                                                                      coordinator was appointed. The coordinator operated within MEST and reported to
                                                                      MEST, MoH and MESP. Other Ministries (i.e. MCYS) also contributed to the Com-
                                                                      mittee’s operations. The overall mission of the Strategy is to “Provide a healthy and
                                                                      friendly school environment, secure through health education, promoting of environ-
                                                                      ment protection and strengthening partnership within schools, parents and commu-
                                                                      nities”. The Strategy was drafted in response to assessments and evaluations that
                                                                      determined that schools and education in Kosovo inherited a fragmented system
                                                                      that placed little emphasis on strong quality and infrastructure28. The Strategy con-
                                                                      tains a Situational Analysis concerning the education system in Kosovo (Appendix I,
                                                                      Box-1).

                                                                            According to the Strategy, in financial terms, MEST is responsible for issues re-
                                                                      lated to curricula and training of educational personnel, and municipal departments
                                                                      to ensure maintenance of school infrastructure. After 2002, there was a gradual
                                                                      shift of the burden of investment in infrastructure from different donors to the local
                                                                      institutions. Despite efforts to transfer financing roles from donor to local sources,
                                                                      until 2002 investments in education were made only in accordance with community
                                                                      requirements and evaluations based on various donor organizations. The lack of a
                                                                      centralized and systematic approach to address the problem of school infrastructure
                                                                      led to a fragmented investment processes. A database by the International Man-
                                                                      agement Group in 1999, was one attempt to centralize the available data. However,
                                                                      according to findings of the current study, fragmentation of data to track institutional
                                                                      infrastructures in Kosovo, is still prolific29.

                                                                           The scope of the Strategy is largely based on the WHO’s principles of healthy
                                                                      school promotion30. The process of health promoting schools delineates mecha-
                                                                      nisms to ensure that “schools take care about the social welfare to the environment
                                                                      where physical and mental health, and safety of all participants in the educational
                                                                      process is supported in the form of partnership with family, community, and partici-
                                                                      pation of government and non-governmental bodies within the community”.


                                                                       28	 Based on a research conducted in July 1999, 132 schools were completely damaged. From 596 schools, 42 did not posses any toilets
                                                                           and 380 of them had toilets outside of the school building, and about 132 schools had no water at all. From those schools that had water
                                                                           supply, more than half of them had a water supply system outside the school building. Based on the evaluation of the education system
                                                                           organized immediately after the war, it was recommended to conduct a research on the water quality and as a result, IKSHP supported
                                                                           by UNICEF in 2002, organized similar research in 40 schools in rural areas in Kosovo, which were not connected with the water supply
                                                                           system. The research concluded that 75% of the water resources in the tested schools were bacterially contaminated and more than 50%
                                                                           were chemically contaminated. About 80% of the tested schools had no potable water.
                                                                       29	 Our interviews with multiple stakeholders revealed that lack of a cohesive data collection system in Kosovo is currently a challenge.
                                                                       30	 Promoting health in school is defined as: programs leading to improvement; advancement and preservation of health; but also
                                                                           timely identification and treatment of diseases or deviations that caused damage to the health of participants in the education
54                                                                         process.
The Strategy follows principles within the framework of the Convention on the
Rights of the Child and on the Elimination of All Forms of Discrimination against
Women by framing its larger program objectives as follows: (i) to improve social ser-


                                                                                                                                                   PART 2 POLICY ARCHITECTURE ANALYSIS AND ASSESSMENT OF ECD PROVISION
vices and to empower families with knowledge and skills to create opportunities to
ensure that babies and children are healthy, emotionally secure and able to learn in
a safe environment; (ii) to contribute to universal access to qualitative formal and
informal education and to reduce the percentage of abandonment of education, par-
ticularly girls and minority children; (iii) to provide children with the skills necessary to
become healthy, active and responsible citizens; and (iv) to contribute in improving
policies and legislation for children who need special protection, and presentation of
family-based alternatives.

     The Strategy specifies that in the context of Kosovo, the European principles
for health promoting schools (democracy, equality, empowerment, racing activities,
school environment, curricula, and training of educational personnel, measuring the
success of cooperation, community, and sustainability) underlie the Strategy’s pro-
grammatic priorities. Furthermore, several Kosovo-specific documents, policies and
principles are cited in the Strategy as being relevant to its objectives and plan31.


Goals, strategies and extraction of ECD-specific provisions

     The working group that led the development of the Strategy identified six stra-
tegic objectives to drive targeted activities and processes between the years 2009-
2012. The Strategy is to be implemented in two phases: period 1 (2005-2010) and
period 2 (2010-2018). The overarching objectives are:

  1.	 Healthy and supportive environment provided by teachers, pupils and parents;
      	
  2.	 Appropriate physical and healthy environment for teaching and learning (based
      	
      on guidelines for the development strategy of under graduate education in Ko-
      sovo 2007-2018);
  3.	 Sufficient human and material resources;
      	
  4.	 Continuous and qualitative care for pupil’s health;
      	
  5.	 Low level of violence within schools;
      	
  6.	 The satisfactory level of health and environmental culture of the pupils.
      	

       In order to meet the objectives, several strategies, corresponding indicators,
and specific measures were provisioned. However, the strategy does not specify
how objectives are targeted to different age ranges. The objectives are applicable to
all levels of education and do not outline guidelines for implementation in Early Child-
hood Centers, preschools and the first years of primary schooling


 31	 (i) The Law of Primary and Secondary Education (enrolment and progress must be given regardless of gender, presence of
     disabilities, ethnicity, social origin); (ii) Principles of the health system (equality, quality, honesty and responsibility, inclusion and
     non-discrimination, correct treatment of citizens based on the law and respect of human rights and freedom); (iii) The Kosovo
     Health Strategy (2005-2012) (includes overarching goals such as reduction of morality and morbidity through the improvement
     of growth and psycho-physical development, of reproductive health promotion, of immunization, youth health, smoking reduction
     and other addictive behaviors, and mental health status, oral health, environmental health; reduction of communicable and non-
     communicable diseases, traffic accidents).                                                                                                                     55
PART 2 POLICY ARCHITECTURE ANALYSIS AND ASSESSMENT OF ECD PROVISION


                                                                      Draft Kosovo Education Strategic Plan (KESP) 2011-2016


                                                                      Sponsoring sectors and driving frameworks

                                                                           The Kosovo Education Strategic Plan 2011-2016 (KESP) takes as its starting
                                                                      point and guiding legislative framework the following four documents:

                                                                       1.	 Strategy for Development of Higher Education in Kosovo (2005-2015): Officially
                                                                           adopted before Kosovo declared its independence on February 17, 2008;
                                                                       2.	 	 trategy for Development of Pre-University Education in Kosovo (2007-2017):
                                                                           S
                                                                           Adopted in September 2004 by the first democratically elected Government of
                                                                           Kosovo;
                                                                       3.	 	 he Roadmap for the Education Sector: The roadmap suggested that the two
                                                                           T
                                                                           strategies (Pre-University and Higher Education) should be developed as a sin-
                                                                           gle education strategy based upon a Life-Long Learning framework. The Road
                                                                           Map laid out several priorities to improve aid effectiveness, efficiency and co-
                                                                           ordination32.
                                                                       4.	 	 edium Term Expenditure Framework (2011-2013)
                                                                           M

                                                                            The key legislative frameworks within KEPS that address ECDE are the Law
                                                                      on Pre-University Education; Law on Education in Municipalities of the Republic of
                                                                      Kosovo (2008); Law on National Qualifications (2008); Law on Preschool Education
                                                                      (2006); the General Standards for Preschool Education in Kosovo for ages 3-6 (2006);
                                                                      the Curriculum for Preschool Education in Kosovo for ages 3-6 (2006); and the Stra-
                                                                      tegic Plan for the Organization of Inclusive Education in Kosovo 2010 – 2015. Fur-
                                                                      thermore, ongoing work on the Standards for the Development and Learning in Early
                                                                      Childhood (0-6 years) and the Strategic Plan for the Prevention of Drop-outs (2009 –
                                                                      2014) are also legal frameworks relevant to the ECD provisions within KESP. Beyond
                                                                      the legal frameworks that drive ECD-related provisions in the Strategy, KESP outlines
                                                                      the basic structure of the Education Sector in Kosovo33.


                                                                      Goals, strategies and extraction of ECD-specific provisions

                                                                            KESP was divided into seven program areas: preschool education, pre-univer-
                                                                      sity education, vocational education and training, teacher education, higher educa-
                                                                      tion, adult education and training, and information and communication technology
                                                                      (ICT). Overview of projected costs for key sub-sector areas was estimated according
                                                                      to development and recurrent costs (appendix II, table 1).

                                                                           According to KESP, the overall objective of preschool education is to “provide
                                                                      inclusive and equitable access for all children to quality, non-discriminating edu-
                                                                      cation up to the age of 6 by 2016 through increasing the capacity of the physical

                                                                       32	 Priorities of the Roadmap for the Education Sector include: improved strategic planning and base-line data; building a
                                                                           comprehensive capacity development plan and improved TA utilization; improved sector budget and financing of prioritized needs;
                                                                           improved performance of PFM systems and risk mitigation; improved development partner co-ordination; managing for results and
                                                                           monitoring of sector performance.
                                                                       33	 The education system encompasses preschool education (children ages 0-3 and 4-5) and pre-primary grade 0 for children ages 5-6.
                                                                           Pre-university education comprises children ages 6-18 attending one of the three education levels: primary school (children ages 6-11 in
56                                                                         grades 1-5), lower secondary school (ages 11-15 in grades 6-9) and upper secondary school (ages 15-18 in grades 10-12/13).
infrastructure and by improved awareness campaigns and by enhancing curriculum
and learning materials, and initiating a program for professional development for
educators and staff”. The Strategy’s overall benchmark is that all children of age


                                                                                               PART 2 POLICY ARCHITECTURE ANALYSIS AND ASSESSMENT OF ECD PROVISION
5-6 be included in pre-primary education by 2016 and that 35 percent of children of
age 0-5 be included in various forms of preschool education. KEPS assigns MEST
and municipalities the responsibility of establishing the foundation for managing the
program. Table-2 (appendix II) summarizes the ECD-specific key areas addressed in
KESP and the sub-sector issues addressed in the preschool program. In sum, the
targets addresses could be classified under the general categories of mechanisms
or equity, access and quality as follows:

 ■■ Equity — gender parity and issues pertaining to the enrolment of ethnic mi-
    norities, campaigns to raise awareness of gender parity issues among service
    providers;
 ■■ Access — increase in enrolment (compulsory by 2016), awareness campaigns
    among stakeholders of the importance of preschool education;
 ■■ Quality — systems of accreditation for teachers, development and implementa-
    tion of age-specific curricula for each target (0-3 and 3-6), increase of manage-
    rial capacity of preschool managers (including the establishment of an Advisory
    Group for Preschool Education).

      Pre-University education was given the largest proportion of the projected
cost (appendix II, table 1). Other provisions specified for pre-university education,
teacher education, adult education and training, and information and communication
technology (ICT) are relevant to ECD. Target areas have been extracted (appendix
1, table-2) to facilitate the identification of activities that may spill over into services
concerning children 0-6 years of age.


Participatory Strategy Development for Education
for Rural People (2004-2009)


Sponsoring sectors and driving frameworks

      Several international frameworks were relevant to the drafting of the Participa-
tory Strategy Development for Education for Rural People. The Strategy states: “the
Millennium Goals of Poverty and Hunger Eradication and Universal Primary Educa-
tion will not be achieved by 2015 if rural people do not have better access to quality
basic education”. Global imperatives that drove the Strategy for Education for Rural
People in Kosovo include the World Food Summit, Education for All Conference
(EFA, Jomtien, 1990), MDGs, FAO and UNESCO’s partnership on Education for Rural
People (ERP) within the International Alliance Against Hunger and the EFA initiative.

      The development of the Strategy was based on an assessment of educational
needs and the problems facing rural people in terms of access to quality basic edu-
cation. The assessment was done in three villages in each of the five municipali-
ties selected according to their proximity to a main urban centre, population size,
and multi-ethnic representation.34 Information was gathered from the 15 villages on
household economic activities, household members, and participation in education
(primary and secondary schools). At the time of the assessment, preschool classes

 34	 Lipjan, Prizren, Kamenice, Peje, and Skenderaj                                                             57
were available in 12 out of the 16 rural primary schools covered by the assessment,
                                                                      but only 22% of 5 year olds in the surveyed households attended preschool. Ac-
                                                                      cording to the Strategy, “the main problem associated with participation in preschool
PART 2 POLICY ARCHITECTURE ANALYSIS AND ASSESSMENT OF ECD PROVISION


                                                                      in rural areas, is one of demand rather than supply. Although not all primary schools
                                                                      in the study have preschool classes, in those villages where preschool education
                                                                      exists, many children do not attend. The main reasons given are ‘disinterest by par-
                                                                      ents’ or ‘too far for children to walk’ ”.


                                                                      Goals, strategies and extraction of ECD-specific provisions

                                                                            The vision of the Participatory Strategy Development for Education for Rural
                                                                      People was to provide “Quality learning and education opportunities for all rural peo-
                                                                      ple”. This medium term development strategy was designed for implementation
                                                                      within a five-year time span (2004 – 2009). In addressing the challenges and achiev-
                                                                      ing the vision, the focus of the strategy was framed around the following eight stra-
                                                                      tegic goals:

                                                                        ■■ 	Goal 1 To improve school-community cooperation and increase community re-
                                                                            sponsibility for education in rural areas (in order to develop an active partnership
                                                                            in school management);
                                                                        ■■ 	Goal 2 To increase participation and retention of rural children, especially girls
                                                                            and minority groups, in basic education (preschool and primary school) and de-
                                                                            velop opportunities for their enrolment into post-compulsory education;
                                                                        ■■ 	Goal 3 To provide education adapted to the learning needs of children in rural
                                                                            areas;
                                                                        ■■ 	Goal 4 To increase participation of rural people in relevant non-formal education
                                                                            and training programs (adult education), especially linked to income generation;
                                                                        ■■ 	Goal 5 To improve the physical and material resources of rural schools and en-
                                                                            sure at least a minimum level of resources necessary for the teaching process;
                                                                        ■■ 	Goal 6 To establish a reliable and accessible education information system (not
                                                                            only related to rural schools);
                                                                        ■■ 	Goal 7 To develop the management capacity and organizational structure of
                                                                            rural schools;
                                                                        ■■ 	Goal 8 To develop the human resources of education in rural areas by improving
                                                                            the recruitment, training and retention of teachers in rural schools.

                                                                            Strategic goal # 2 explicitly addresses ECD services. It targets access to pre-
                                                                      school education based on two key findings: (i) low level of participation by rural
                                                                      children in preschool education; and (ii) lower level of participation among girls and
                                                                      ethnic minorities in grades 5-9 of compulsory basic education, as a consequence of
                                                                      the dropout phenomena. Key Actors were broadly delineated for each goal35 with

                                                                      35	 Actors specified for the 8 programmes of the Participatory Strategy Development for Education for Rural People
                                                                          Goal 1- Community members, parents, teachers, school directors, school boards, municipal and regional education officers.
                                                                          Goal 2- Community members, parents, teachers, school boards, school directors, municipal and regional education officers.
                                                                          Goal 3- MEST, education (curriculum) specialists, teacher trainers, community members, parents, school boards, school directors,
                                                                          teachers, regional and municipal education staff, employers.
                                                                          Goal 4- Community groups, youth, NGOs, schools, municipal officers, MEST, MAFRD, MLSW, MTI, training centres, employment offices,
                                                                          employers, farmers.
                                                                          Goal 5- MEST, regional and municipal authorities, utilities (water, electricity supply) teacher trainers, community members, parents,
                                                                          school boards, school directors, teachers.
                                                                          Goal 6- MEST, University of Pristina, IT specialists, regional and municipal education officers, SOK, KEC, school directors, school
                                                                          boards, teachers.
                                                                          Goal 7- School directors, school boards, regional and municipal education officers, MEST, teacher trainers (in the Faculty of Education),
                                                                          specialists in management training.
58                                                                        Goal 8- Teachers, teacher trainers (in the Faculty of Education), MEST, regional and municipal education officers, school boards.
municipal officer responsibilities spanning through all proposed goals. Also a set of
programs to match the strategic goals was specified and budgeted. Furthermore, a
prioritization of the objectives was put forth to “guide lines of action for donor sup-


                                                                                                                                          PART 2 POLICY ARCHITECTURE ANALYSIS AND ASSESSMENT OF ECD PROVISION
port”. The prioritization was as follows:

 1.	 To improve management and leadership in basic education and increase com-
     	
     munity participation in school affairs;
 2.	 	 o improve teaching and contextualize the curriculum in rural primary schools so
     T
     that education is adapted to the learning needs of children in rural areas;
 3.	 	 o provide adequate teaching materials, books and equipment for rural primary
     T
     schools (in line with curriculum reforms);
 4.	 	 o support community learning and awareness (non-formal adult education) in
     T
     rural areas;
 5.	 	 o reorient secondary vocational (agricultural) education towards meeting the
     T
     learning needs of rural communities.


Strategy for integration of Roma, Ashkali, and Egyptian
communities in Kosovo (education)


Sponsoring sectors and driving frameworks

      The Strategy for Integration of Roma, Ashkali and Egyptian Communities in
Education is one of the components of a more comprehensive strategy towards the
integration of these communities in Kosovo, developed under the aegis of the Prime
Minister’s Office. Drafting of the strategy was sponsored by the Ministry of Educa-
tion, Science, and Technology (MEST) and supported by the Kosovo Foundation for
Open Society (KFOS). The process of developing the education component was co-
ordinated by the Kosovo Education Center (KEC) and was characterized by a broad
participation of all involved parties: government, Roma, Ashkali, and Egyptian com-
munities representatives, civil society, political parties, international organizations
engaged in human and children’s rights (OSCE and UNICEF), among others.

      Pre-existing strategies (such as the Strategy for Development of Pre-University
Education for years 2005-2015) were important to the development of the Strategy
for Integration of Roma, Ashkali and Egyptian communities. The strategic document
also refers to the Universal conventions as key frameworks that guided its develop-
ment. Some of those driving frameworks include the Framework Convention on
Protection of National Minorities36; Article 27 of the International Convention on Civil
and Political Rights guarantees the right to use their language within their community
and with other members of their group; Article 5 of the UNESCO Convention against
Discrimination in Education provisions enabling minorities to learn and to teach in
their mother tongue; Convention on Children’s Rights, primarily Article 28 (on the
right to education) and Article 30, which provides that a child belonging to a linguistic
minority must not be denied its right to use his/her mother tongue; and the UN Decla-
ration on the Rights of Persons belonging to National, Ethnic, Religious, or Linguistic
Minorities as well as the Universal Declaration of Human Rights.


 36	 Article 14 of the Framework Convention on Protection of National Minorities, provisions the right of minorities to safeguard their
     collective identity through their mother tongue. This right is implemented through education. These instruments highlight that
     the right to safeguard one’s identity through the minority language should be balanced with the responsibility for integration and
     participation.                                                                                                                                        59
Goals, strategies and extraction of ECD-specific provisions

                                                                            The strategic objectives were directed primarily towards the partial integration
                                                                      and insufficient participation of Roma, Ashkali and Egyptian communities in educa-
PART 2 POLICY ARCHITECTURE ANALYSIS AND ASSESSMENT OF ECD PROVISION


                                                                      tion. The vision of the Strategy is “a knowledge and inclusive society, respecting di-
                                                                      versity, fully integrated into European trends, offering equal opportunities for personal
                                                                      development of all individuals of Roma, Ashkali and Egyptian communities, who in
                                                                      return contribute to the sustainable economic and social development”. The Mis-
                                                                      sion of the Strategy is “Building of a high quality and inclusive system of education,
                                                                      based on justice, equity and respect for diversity, contributing to the full integration
                                                                      of Roma, Ashkali and Egyptian communities in the society”.

                                                                             For each objective, the strategy specifies a measure, activities, responsible en-
                                                                      tities, budget, time, target group, indicator, and supporters. Strategic objective-1
                                                                      (Significant improvement of access and quality of education for members of Roma,
                                                                      Ashkali and Egyptian communities) directly addresses the preschools and pre-prima-
                                                                      ry sector. Activities to increase the inclusion of Roma, Ashkali and Egyptian commu-
                                                                      nities in these two sectors include: i) conduct a needs assessment for preschool and
                                                                      pre-primary education; ii) inclusion of ranked Roma, Ashkali and Egyptian qualified
                                                                      teachers and assistants in the education system; iii) the provision of incentives and
                                                                      financial assistance to future educators for studies, work and practice; and iv) provi-
                                                                      sion of accredited training programs. The activities, although not all directly linked to
                                                                      the larger objective of increased inclusion, present mechanisms to increase cultural-
                                                                      ly-sensitive and targeted approaches to early education. It is unclear, however, if the
                                                                      activities would target the true barriers which have been identified.


                                                                      Disability Action Plan for Kosovo 2009-2011
                                                                      Sponsoring sectors and driving frameworks

                                                                             The Kosovo Disability Action Plan 2009-2011 seeks to translate the aims of the
                                                                      Convention on the Rights of Persons with Disabilities and other relevant internation-
                                                                      al treaties and recommendations with regard to human rights, non-discrimination,
                                                                      equal opportunities, and full participation of persons with disabilities in the first policy
                                                                      framework on disability for the years 2009-2011. The Kosovo Disability Action Plan,
                                                                      in line with the CRPD and the Council of Europe’s New Strategy for Social Cohe-
                                                                      sion (2004), points out the need for a special commitment to ensure access to hu-
                                                                      man rights for people who are at risk of becoming vulnerable, such as children and
                                                                      young people, ethnic minorities and migrants, people with severe disabilities and
                                                                      the elderly. ILO Recommendations regarding the employability of persons with dis-
                                                                      abilities, coming from the ILO Convention, are also referenced to in the Action Plan
                                                                      as key guiding principles.

                                                                           Furthermore, the Plan makes reference to existing Kosovar legislation on health
                                                                      services for persons with disabilities. Main acts cited are the Law 38/2004 on the
                                                                      Rights and Responsibilities of Citizens in Healthcare and the Law 4/2004 Koso-
                                                                      vo Health Law, on Community Based Rehabilitation. The Plan also references the
                                                                      Council of Europe’s Action Plan (2006), which declares: “Rehabilitation of persons
                                                                      with disabilities, by virtue of the economic and social integration it achieves, should
                                                                      be among priorities of any society”.

                                                                           The Disability Action Plan is structured around several cross-cutting issues: i)
                                                                      vulnerable groups within persons with disabilities (including Women, Girls, Children,
60
Youth, and persons with disabilities from minorities and migrants); ii) data collection;
iii) awareness raising and education for behavior change; iv) multidisciplinary com-
missions; v) training on CRPD for Parliamentarians and governmental officials; and


                                                                                            PART 2 POLICY ARCHITECTURE ANALYSIS AND ASSESSMENT OF ECD PROVISION
vi) international cooperation.

      The Plan also includes the following overarching thematic issues that are di-
rectly relevant to children:

         Health: Comprehensive free medical care for all persons with disabilities;
   defining a program on professional approach of the health care providers towards
   persons with disabilities according to international human rights standards; im-
   prove accessibility to health infrastructure; improve rehabilitation services for per-
   sons with disabilities; ensure the availability of a sign language interpreter on the
   health system at central and local level.

         Education: Creating equal opportunities for persons with disabilities in the
   educational system; implementing legislation in the educational field for persons
   with disabilities; ensuring an inclusive education system in preschool institutions;
   professional development programs on inclusive education for teachers and peo-
   ple involved in the educational system; improving competences on disability at
   municipal level.

         Social protection: Improving social services, reflecting the fundamental
   rights and freedoms of persons with disabilities; enhancing the economic living
   standards of persons with disabilities and families; creating and implementing
   a coherent legal framework for the access of persons with disabilities to a large
   spectrum of quality community services.

      Other thematic issues relevant to all people with disabilities include activities
and budget lines to address accessibility (constructions or removal of architectural
barriers, development of systems for statistical data gathering, mechanisms for em-
ployment, and decentralization systems).


The Health Sector Strategy 2010-2014
Sponsoring sectors and driving frameworks

     The Kosovo Development Strategy and Plan (KDSP) was developed by the
transitory KDSP Secretariat and structured for implementation over the period, 2007-
2013. KDSP provided over-arching policy objectives for Kosovo that incorporated
the policy priorities, which resulted from several Working Groups drawn from the
Ministries and other stakeholders. The Health Sector Strategy 2010-2014 was gen-
erated by one of these Working Groups. The preparation process of revised Sec-
tor Strategies, through which priorities would be determined and which would offer
information for the planned expenditure on activities in 2009, was disrupted by the
General Election and by the progress towards Independence. The KDSP, published
in 2007, was then translated into the Medium-Term Expenditure Framework (2008-
2010)

      Despite several limitations to generate an accurate health profile for Kosovo (i.e.
difficulties in integrating the Serbian community into the Kosovar reporting system
and the not-fully developed Health Information System), available evidence suggests
that Kosovo’s health profile is amongst the worst in the South-Eastern Europe. High
levels of infantile mortality, tuberculosis and issues with inadequate nutrition are per-
                                                                                                             61
sistent problems while limited abilities and mental health are cross-cutting issues.
                                                                      Furthermore, the Strategy reports there are 0.94 doctors, 2.61 nurses and 0.06 den-
                                                                      tists per 1,000 inhabitants in Kosovo. These ratios are low in comparison with other
PART 2 POLICY ARCHITECTURE ANALYSIS AND ASSESSMENT OF ECD PROVISION


                                                                      countries, especially that of doctors. In Primary Health Care, the ratio of senior staff
                                                                      to intermediate staff is only 1:3. The average number of beds per 1,000 inhabitants is
                                                                      1.43, extremely low in comparison with other countries in the region. In summary, the
                                                                      Strategy sites the following as critical problems at the root of a low-performing health
                                                                      system: absence of a functional Health Information System; absence of a Health
                                                                      Insurance System; the referral system; lack of standards for services or work proto-
                                                                      cols; need for improvement of managerial knowledge and skills; and non-functional
                                                                      infrastructure.


                                                                      Goals, strategies and ECD-specific focus

                                                                           Based in the broad-stroke situational analysis of the Health system in Kosovo,
                                                                      the strategy’s vision is to achieve “A healthy population across all of the Republic of
                                                                      Kosovo”. From that larger vision, 5 strategic objectives are derived:

                                                                            Strategic Objective-1: Strategic Objective-1: To decrease morbidity and mortal-
                                                                            ity of the overall population;
                                                                            Strategic Objective-2: Improve management of existing resources and quality of
                                                                            services (framework of Kosovo based on basic quality standards by end of 2014);
                                                                            Strategic Objective-3: The function, re-organization and the completion of the
                                                                            existing infrastructure of the healthcare system and the procurement of medical
                                                                            equipment in accordance with European standards;
                                                                            Strategic Objective-4: Continuing implementation and development of a Health
                                                                            Information System;
                                                                            Strategic Objective-5: To establish a sustainable funding system for the health
                                                                            sector.


                                                                           Objective-1 outlines activities that specifically target early childhood. Figure
                                                                      22 summarizes the objectively verifiable indicators and means of verification for the
                                                                      Health Sector Strategy.

                                                                           Figure 22. Figure 22: Strategic Objective-1 from the Health Sector Strategy: Reduce morbidity and
                                                                      	               mortality of the overall population

                                                                          OBJECTIVELY VERIFIABLE INDICATORS                     MEANS OF VERIFICATION
                                                                          -Mortality rate of children under 5yrs to
                                                                                                                                -Annual Health Status report from NIPHK
                                                                          decrease by 2/3 by 2014
                                                                                                                                -Reports from relevant Health Institutions
                                                                          -Maternal mortality rate to decrease by 3/4
                                                                                                                                based on legislation
                                                                          by 2014
                                                                                                                                -Annual Reports from Mother and Child
                                                                          -Infectious disease morbidity rate to
                                                                                                                                Health Committee
                                                                          decrease by 20% by 2014
                                                                                                                                -Health Information System
                                                                          -Un-infectious chronic disease morbidity
                                                                                                                                -Statistical Office of Kosovo (SOK)
                                                                          rate to decrease by 20% by 2014
                                                                      Source: Taken from the Health Sector Strategy 2010-2014. Child Protection Frameworks and Institutional Arrangements


62
The Kosovo Probation Service is a structure that operates within the Ministry of
Justice, established in December 2002. The activity of this service is legislated by
four key laws: Provisional Criminal Code of Kosovo, the Criminal Procedure Code of


                                                                                                                                   PART 2 POLICY ARCHITECTURE ANALYSIS AND ASSESSMENT OF ECD PROVISION
Kosovo, the Law on Execution of Criminal Sanctions, and the Juvenile Justice Code
of Kosovo. Not included in this content analysis but nonetheless central to the pro-
visions for the criminalization and prevention of child abuse, is the Juvenile Justice
Code of Kosovo. The Code provides the legal framework addressing prevention of
abuse and child protection. Additionally, the Kosovo Strategy and Action Plan for
Children Rights 2009-2013, is the key document that addresses the child rights per-
spectives in Kosovo.

      According to Kosovo’s 2001 Policy Statement on Social Services, in terms of
the organizational strucutre for child social protection, “the Ministry of Labour and
Social Welfare (MLSW) is the responsible state body appointed for organizing social
and family services provision along with local government units. MLSW is responsi-
ble for overseeing provision of social and family services throughout the territory of
Kosovo. Furthermore, the Ministry of Local Government and the Ministry of Econ-
omy and Finance are responsible for coordinating the overall process of transfer of
competencies from the field of social and family services in the municipalities and
must ensure that this process is in full compliance with legislation in Kosovo”. The
Policy Statement on Social Services specifies that all municipalities in the territory
of Kosovo are responsible for provision of social and family services through their
Centers for Social Work, and other governmental and non-governmental institutions,
under the supervision of MLSW. These Centers are municipal public institutions
competent for the protection of citizens with social need (i.e. a child without parental
care; a child with antisocial behavior; distorted relationships in the family; individu-
als at risk of mistreatment or abuse; and individuals who are victims of family vio-
lence). Figure-1 (appendix-1) describes the governance and administrative structure
of MLSW until the moment of transfer of competencies to the Municipal Directorate
for Health and Social Welfare (MDHSW).


Conclusion
      The vast landscape of policy documents, frameworks, strategies and laws per-
taining, directly and indirectly to ECD is clear indication that Kosovo is committed to
its children. The review of the policy landscape, based on the accessible and avail-
able documents37, demonstrates that the education sector appears to have a com-
prehensive set of guidance for ECD. Cumulatively, these documents cover important
aspects linked to young children’s learning and education. Second, an alignment or
cross-reference across sector documents was not noted. Each set of policy docu-
ment appears to be directly linked to its own sector with little to no mention of allied
programs and services, or even policy monitoring, that could be occurring under the
aegis of other sectors. Finally, the legal framework for alleviation of social problems
appears to be a distinctive characteristic of the Kosovo Strategy. It was noted that
there are a range of laws that have been endorsed with respect to social problems
facing young children and families and that this legal approach is one that is consist-
ently adopted by Kosovo.


 37	 It should be noted that the documents reviewed were made available to the study group and accessed online. We are unsure if
     they are representative of Kosovo’s social policy documents.                                                                                   63
64
PART 3
     RECOMMENDATIONS
FOR ECD PROGRAMS AND
 POLICY IMPLEMENTATION
Kosovo intends to build a strong ECD program. In response to that aim, Part
                                                                    3 of this report uses the findings of the situation and policy analyses in Parts 1 and
                                                                    2, respectively to identify the ECD needs and suggest recommendations. The cur-
PART 3 RECOMMENDATIONS FOR ECD PROGRAMS AND POLICY IMPLEMENTATION


                                                                    rent situation of child outcomes demonstrates that there are areas not addressed by
                                                                    current programs and policies. Two categories of recommendations are presented
                                                                    in this section of the report as a response to this gap or unmet needs. These recom-
                                                                    mendations are supported by the evidence of effective ECD. The first category of
                                                                    recommendations addresses the programmatic aspects of ECD. The second cat-
                                                                    egory of recommendations addresses governance dimensions of ECD to ensure ef-
                                                                    fective and cohesive programming. Taken together by addressing programming and
                                                                    policy, it is anticipated that Kosovo will ensure that all young children develop to their
                                                                    fullest potential.

                                                                     ■■ Area 1: Achieving equity in ECD: A Program for Kosovo
                                                                     ■■ Area 2: Strengthening Governance for ECD


                                                                    Area 1: Achieving Equity in ECD:
                                                                    A Program for Kosovo
                                                                          Kosovo is keenly interested in moving forward a strong program for ECD. To
                                                                    that end two recommendations are presented:

                                                                     ■■ Recommendation a: ECD Parenting Program
                                                                     ■■ Recommendation b: Early Learning Program


                                                                          The first part of this chapter provides the overview for the programmatic recom-
                                                                    mendation. The second part of this chapter addresses the first recommendation of
                                                                    parenting programs. The third part of this chapter describes the early learning mod-
                                                                    els. The last part of this chapter presents preliminary and initial cost estimates for
                                                                    the parenting and early learning programs. For the ECD centers, the costing is based
                                                                    on a pilot analysis of a few existing ECD centers in Kosovo combined with costing
                                                                    experience in other countries, whilst the financial analysis of the parenting program
                                                                    is based entirely on the international knowledge base. Hence, it should be empha-
                                                                    sized that this analysis cannot be used as the immediate starting point for concrete
                                                                    planning. The policy community in Kosovo should define these two programs fur-
                                                                    ther, with respect to program characteristics that are most suited for Kosovo. The
                                                                    analysis presented in this report could be used as the first indication of the costs as
                                                                    it provides information on the feasibility of the programs and data to support further
                                                                    decision-making.


                                                                    Overview of Program Recommendations
                                                                         The goal of the ECD program is to ensure equity in ECD outcomes for all chil-
                                                                    dren in Kosovo. First described is the definition of equity and its dimensions fol-
                                                                    lowed by a description of the recommended ECD Program.
66
Equity in ECD

      Equity in ECD can be understood with respect to equitable access and oppor-
tunity for quality programs and services. While access has been a primary thrust,


                                                                                              PART 3 RECOMMENDATIONS FOR ECD PROGRAMS AND POLICY IMPLEMENTATION
guiding action towards reducing disparities in opportunities for young children, it
can be considered a limited approach to improving equity in ECD (Britto, Yoshi-
kawa & Boller, 2011). Only focusing on expansion and access to ECD can lead to
limited success because providing more access to ECD services is not always ac-
companied by improvement in quality of services. Research shows that the quality
of programs is the key ingredient linked to improved child learning and development.
Therefore the recommendations for the ECD program in Kosovo is that it focuses
both on increasing access and quality of the programs as a vibrant and bold strategy
to improve early child outcomes as a right and a predictor to later success.


Recommended ECD Program

      Presented in the introduction of this report was the evidence that between birth to
6 years of age, children present different phases of vulnerability and opportunity, based
on the age of the child. In addition, the role and influence of the contexts and situations
within which the child lives also varies by age. For the youngest children, the primary
caregiver or parent is the most important influence. The infant is completely dependent
upon this adult or key adults for their survival and development. As the infant grows,
gains mobility and starts to explore her/his surroundings, she/he starts socializing with
other individuals and the influence of other adults, peers, and contexts starts to grow.
Therefore from a developmental perspective, designing an ECD program requires atten-
tion to the needs, vulnerabilities and opportunities for development of the growing child.

     However, other considerations, beyond development need to be accounted for
in developing a program. The second, consideration is sectoral involvement in ECD.
In Kosovo, the health, education and social welfare sectors are most involved in pro-
grams and services for young children and families. These sectors are important to
include if the programs are to be sustainable and scaled up.

      A third consideration in ECD programming is ensuring that children and families
receive consistent good quality services. For example, it has been noted in several
countries, that when one sector takes the lead in programming for a specific age
group and another sector for an older age group, in the transition often, either chil-
dren loose access to services or the programs are not consistent in their content.
As a result the children and families are disadvantaged. In the recommendations
presented in this chapter, ways in the ELDS can be used to ensure consistency and
quality across parenting and learning programs are suggested.

      Based on the aforementioned considerations, a program for ECD is recom-
mended that consists of parenting and early learning programs, the content of which
is informed by ELDS (see figure 23 below).


                                                                                                               67
Figure 23. Overview of Recommendations for ECD Programs and Policy Implementation

                                                                    Child age in years   0       1             2             3             4            5            6
PART 3 RECOMMENDATIONS FOR ECD PROGRAMS AND POLICY IMPLEMENTATION


                                                                                               Parenting Programs                        Early Education Programs
                                                                                             (Lead by Health Sector)                    (Lead by Education Sector)


                                                                                                          Social Welfare & Child Protection Sector


                                                                                                      ELDS (ensures quality and continuity)


                                                                          As illustrated in the figure, age of the child is present in two age brackets, birth
                                                                    to 3 years and 3 to 6 years. For the birth to 3 years age bracket parenting programs
                                                                    supported by the health sector are recommended. For the 3 to 6 years age group,
                                                                    early learning and education programs are recommended supported by the educa-
                                                                    tion sector. It should be noted that at 3 years of age, both health and education sec-
                                                                    tors are noted for their involvement. The implication of this involvement is to ensure
                                                                    that no families “fall through the cracks” in the transition between parenting and early
                                                                    learning programs. Furthermore it should be noted that while health and education
                                                                    sectors take the lead for parenting and early learning programs, respectively, they
                                                                    do not do this alone. Each type of program while lead by one sector is supported
                                                                    by the other sector. This design ensures that both health and education sectors are
                                                                    involved in the ECD program, but their role will vary depending on the type of pro-
                                                                    gram. This sectoral involvement has been suggested to ensure cohesion for the ECD
                                                                    program. Given that the rural poor families and those from ethnic minority groups are
                                                                    the most disadvantaged, the Social Welfare and child protection sector is involved
                                                                    throughout the entire age span, with a targeted focus on the disadvantaged popula-
                                                                    tions. This sector will work along side the health sector in the first 3 years and along
                                                                    side the education sector in the next 3 years ensuring that quality parenting and early
                                                                    learning programs are accessible to the most disadvantaged children.

                                                                          Finally, as per this model, the ELDS can provide the consistency and cohesive-
                                                                    ness that is required for an effective ECD program. ELDS were developed in Kosovo
                                                                    for children from birth until 6 years of age. Therefore they are the perfect tool to align
                                                                    the content of the program as they are developed in keeping with local expectations
                                                                    and values and cover the entire age span. Moreover representatives from the health
                                                                    and education sectors were involved in the development.

                                                                          With respect to costs and without compromising on quality, a series of cal-
                                                                    culations are presented on the assumption that age 3 is the transition year and the
                                                                    service providers who provide parental support hand the child over to the teachers
                                                                    of the ECD centers during this time. However, in keeping with the lead and sup-
                                                                    port sector model, described above, to ensure cohesion across services, the costing
                                                                    model used for the ECD centers assumes that the teachers have some time avail-
                                                                    able for interaction with parents, so that parental support does not stop altogether. It
                                                                    should be kept in mind that if access to the ECD centers is not universalized, parental
                                                                    support should be continued until 6 years of age. Finally, this model also makes note
                                                                    to the issue of universalization of programs regarding children 5 years of age. The
                                                                    current ECD centers include this age group. However, nationwide 70% of them are
68
in the pre-primary year. To avoid that children enter grade one of primary school with
too many different “educational histories” (from an ECD center; from the pre-primary
year; from kindergarten), it seems best to aim for the universalization of the pre-


                                                                                                                                             PART 3 RECOMMENDATIONS FOR ECD PROGRAMS AND POLICY IMPLEMENTATION
primary year, and to restrict the target group for the ECD centers to ages 3 and 438.


Recommendation a: Parenting education
and involvement
     We now turn to the first programmatic recommendation; that of a strong parent-
ing program for families with children 3 years of age and younger. The recommen-
dation is presented in 3 parts: the rationale for this recommendation based on the
current situation in Kosovo; the empirical evidence in support of the program and a
description of the program.

      The results of the study indicate that the greatest areas of inequity are for chil-
dren living in poverty. As demonstrated in the report, poverty in Kosovo is linked with
the geographic region of residence, i.e., the rural population is greatly economically
disadvantaged compared to the urban population, and ethnic background, i.e., eth-
nic minorities represent a larger percentage of low-income families. The results of
this study clearly indicate that poverty levels among the rural population in Kosovo
are high and tend to be increasing, thereby raising attention to the growing disparity.

      With respect to a policy response to this situation, while the Participatory Strat-
egy Development for Education for Rural People and the Strategy for the Integration
of Roma, Ashkali, and Egyptian Communities, does address this situation, it clearly
falls short of achieving the objective with respect to ECD. The policy directives
provided in these strategies are not sufficiently specific in their recommendations
for young children. The government, through the Participatory Strategy Develop-
ment for Education for Rural People, provides a framework to promote inclusion of
rural communities and promote mechanisms to increase access to quality educa-
tion. However, the specified activities targeted directly towards the young children
are meager. Young children are the most vulnerable to poverty shocks and the most
effected by household economic well-being and environment. Additionally, their
needs and vulnerabilities are unique and cannot be subsumed under adult response
to poverty. For example, according to the Participatory Strategy, “the main problem
associated with participation in preschool in rural areas, is one of demand rather
than supply.” Although not all primary schools in the study have preschool classes,
in those villages where preschool education exists, many children do not attend. The
main reason for the low enrolment appears to be the low uptake of services due to
parental lack of interest or that the school is too great a distance for the young child
to walk. Our interviews with parents in a rural community of Zvecan, supported the
latter view. Difficulties in transportation and physical access to the centers were the
main concern of the parents’ regarding their children’s continuing participation in
a preschool program. Despite the knowledge of predominant challenges, the Par-
ticipatory Strategy does not address mechanisms to overcome the infrastructural
hurdles nor does it consider initiatives to promote and facilitate parental involvement.

     Based on our findings in rural and ethnic community minorities, one clear entry-
point for the ECD program is parental education. The importance of parental educa-


 38	 The costs of universalizing the pre-primary year will as such not be estimated in this chapter since this is not a new policy. As was
     noted earlier in this report, enrolment in the pre-primary year has stagnated at around 70% for too long, and closing the final gap
     of 30% should be accomplished soon.                                                                                                                      69
tion for child development is widely agreed and accepted (Engle et al, 2007; the Con-
                                                                    sultative Group on Early Childhood Care and Development, 2010). Parents and key
                                                                    caregivers have been recognized as the most important influence on development in
PART 3 RECOMMENDATIONS FOR ECD PROGRAMS AND POLICY IMPLEMENTATION


                                                                    the early years. The great strides the infants, toddlers and young children make in
                                                                    the areas of growth, health, learning, cognition, language, social and emotional de-
                                                                    velopment are facilitated by the key adults in their life. It is these primary caregivers
                                                                    or parents who create opportunities for development and learning, who through their
                                                                    responsive and supportive care and nurturance ensure that children are healthy and
                                                                    well cared for. The importance of parental involvement in ECD is well documented
                                                                    and the empirical evidence is strong.

                                                                         In all three main areas of ECD, -protection, health and learning-, Part 1 of this
                                                                    report indicated a series of problems where parental education can contribute to
                                                                    amelioration. For example:

                                                                     ■■ Under-5 mortality. The number of children that die before the age of five is un-
                                                                         acceptably high in Kosovo. Reducing it requires a palette of strategies. While
                                                                         some of these can be expensive, others such as healthy practices and hygiene
                                                                         at home, and breastfeeding require no other investment than that in education
                                                                         for parents, and are evidenced to be not only cost-effective, but also with a posi-
                                                                         tive sustained impact on child outcomes.
                                                                     ■■ 	Early learning. If parents learn a few relatively simple principles and techniques
                                                                         on how to interact with their children during the first years of their lives, they can
                                                                         have a big and positive impact on cognitive development, at much lower costs
                                                                         than that of enrolling them in kindergarten.
                                                                     ■■ 	Child labor. To some extent this can be reduced by poverty alleviation, but in
                                                                         Kosovo, it has an important cultural component. Changing parents’ knowledge,
                                                                         attitudes and behavior is key in combating child labor.


                                                                          Based on the situation and policy analysis, Kosovo does appear to be ready
                                                                    for developing and implementing a parenting program. There are some policy pro-
                                                                    visions that recognize family involvement. For example, according to the MEST
                                                                    education strategy, “…. every education institution should be aware that without a
                                                                    good cooperation with families there can never be a successful work in education
                                                                    process, so, one of the priorities of the work of each institution should be effort to a
                                                                    good cooperation….” This strategy underscores the importance of parents in rec-
                                                                    ommending that a close collaboration should be strengthened between schools and
                                                                    families. However, some of the other policies, though highlighting the importance
                                                                    of parenting, appear to show some inconsistencies and lack of clear direction. For
                                                                    example, the Law on Preschool Education clearly recognizes that parents have the
                                                                    right to select a preschool program for their children in public or private institution.
                                                                    However, it also states that the way of selecting the programs will be regulated with
                                                                    administrative instruction. These two statements either contradict each other or limit
                                                                    parental choice. Secondly, even though the Law for Preschool Education provisions
                                                                    for education within the home for disabled children who cannot attend school, it
                                                                    does not provide details on which entity is responsible for organizing this service for
                                                                    the family. Other contradictions and unclear areas include fees for programs and
                                                                    responsiveness of the preschools towards the families.

                                                                         The parenting program should have multiple goals and a broad vision, including
                                                                    improving parenting skills and the capacity of parents to take care of their children
                                                                    and feel empowered in that role. The program should strive to increase parental par-
70
ticipation in child rearing, and support their active role as such. The role of fathers
as parents needs to be considered and incorporated into any parenting program.
The program should also focus on improving the skills of professionals who provide


                                                                                           PART 3 RECOMMENDATIONS FOR ECD PROGRAMS AND POLICY IMPLEMENTATION
the parenting services directly to families and children. Parenting programs for vul-
nerable and disadvantaged families should place a special emphasis on intensive
and culturally appropriate curriculum that can be delivered through a home-based
program by well trained and supervised service providers. These programs should
focus on the issues facing the rural poor and ethnic minority families as to ensure that
the children achieve strong and healthy outcomes. While the vision of the program
does need to be developed further, one consideration is to include measurable as-
pects that can be achieved by 2015. These measurable outcomes could include: im-
provement in child health, nutrition, development and learning; increase in parents’
knowledge, practice and attitudes; increase in the number of trained and supervised
service providers; parenting materials based on ELDS; increase in access to the par-
enting program of vulnerable and disadvantaged groups.

      The parenting program should be universal serving all parents and children up
to 3 years of age. Targeted emphasis should be given to the rural, minority and eth-
nic groups. A two generation program model might also be considered. The two
generations, parents and children both receive services simultaneously. The focus
of the parent component is on stimulation, support and care giving of the child while
the focus on the child generation is on the development of children. The program
should be institutionalized over the next 3 years, which suggests that parents should
be more involved in the development of the programs. Research has shown that a
main feature of program sustainability depends on parenting involvement in the de-
velopment and ownership. Therefore as the scope and coverage of the program is
being determined, parental involvement in the development, in particular from rural
and ethnic minority groups needs to be considered.

       A key feature of the parenting program is the mode of delivery. There are sev-
eral models of parenting programs, some are home-based, others use groups and
still others operate out of community or clinic centers. The modality of the program
is important because it is linked with participation. Therefore determination of the
modality should be made based on what is culturally acceptable, meets the needs of
the parents and is resource-feasible (financial and capacity). It is recommended that
community-based approaches with home visiting programs will be a suitable modal-
ity for the parenting program. Over the 3-year age span the frequency of the home
visits can decrease, however the community based parent group meetings should
continue. For working parents these parent groups could be held at the work place
in lieu of the community. Father parent groups should also be stressed.

      The empirical literature also provides information on what elements make for
effective parenting programs. These elements should be considered in the devel-
opment of the Kosovo parenting program. For example, cultural sensitivity is a key
feature of successful programs. Therefore creating and implementing a program that
adapts to the community is important. The “dose” of the program is another feature
of effectiveness. This includes the frequency and intensity of program delivery. Pro-
grams need to be easily accessible. However, more importantly parents have to be
motivated to stay in the program. From a program development perspective, priori-
ties should be set up and ensured of a systematic plan for roll out and scale up. This
plan should certainly include a monitoring and evaluation component. The program
should be based on standards, which can be drawn from ELDS.

                                                                                                            71
The sustainability of the program is very important. While the financial sustain-
                                                                    ability is addressed later in this section through a preliminary and initial cost analysis,
                                                                    provided here are lists of resources that are currently available to implement the pro-
PART 3 RECOMMENDATIONS FOR ECD PROGRAMS AND POLICY IMPLEMENTATION


                                                                    gram. With respect to parenting materials and curriculum there are resources that
                                                                    could be used. The coordination group for parenting has produced leaflets, CDs etc.
                                                                    materials for parenting, which could be used for the parenting program. Secondly,
                                                                    every preschool program has a curriculum that links with parenting. Even though it is
                                                                    not a parenting program per se, it does offer the initial content to develop a parenting
                                                                    program. The ELDS could be used to develop parenting activities, as these stand-
                                                                    ards are already valid for Kosovo. There are technical resources, such as existing
                                                                    social and professional organizations that can contribute to the design and content
                                                                    of the programs. Finally, lead Ministry of Health and supportive ministries of Educa-
                                                                    tion and Social Welfare will have to be involved. As each ministry has knowledge of
                                                                    resources and materials that are available. There is legislation and there are stand-
                                                                    ards in place to support the development and content of the parenting programs

                                                                          Another feature of program sustainability is the location where services can
                                                                    be delivered, and availability of strong partners. In this area also there are currently
                                                                    available resources that can be built upon. For example, the School Parent Teacher
                                                                    Councils could serve as an implementing partner, given the high rates of primary
                                                                    school enrolment. Health institutions could serve as a viable site for the parenting
                                                                    group sessions. For example the Institute of Public Health is promoting parenting
                                                                    groups in schools for health promotion. These programs can be expanded to ECD.
                                                                    There are several NGOs also involved in providing parenting programs, Balkan Sun-
                                                                    flowers, Red Cross volunteers and Health Mediators, for example, have been ac-
                                                                    tive before in the more intensive modalities for parental education. There are other
                                                                    NGOs working with parents of disabled children through parenting groups. These
                                                                    NGOs could be an excellent resource and potential location for conducting parenting
                                                                    groups.

                                                                          In setting up the ECD parenting program, Kosovo will face a set of challenges.
                                                                    These are briefly described below with the intention of ensuring the long-term sus-
                                                                    tainability of the program. As was indicated by the participants during Phase 3 of the
                                                                    study, there appears to be a lack of commitment on the part of key decision makers
                                                                    in developing a parenting program. This issue will need to be addressed, as politi-
                                                                    cal will is necessary for the development of this program. It appears that in part the
                                                                    limited commitment is linked with limited awareness and knowledge of the impor-
                                                                    tance of parenting. Therefore key partners will have to work towards developing an
                                                                    advocacy and awareness strategy to educate key policy makers on the importance
                                                                    of parenting. Other types of challenges are also seen by other countries that have
                                                                    moved forward with a national ECD program. These include lack of financial capac-
                                                                    ity and technical resources. Furthermore it is indicated that in Kosovo there is limited
                                                                    literature on professional development. These are aspects of investment that will
                                                                    need to be considered in the development of the parenting program.

                                                                          In order to get the ECD parenting program initiated the following immediate
                                                                    next steps are recommended. First, a database of existing resources needs to be
                                                                    created. There appear to be some resources available for such a program. How-
                                                                    ever, information on these resources is unclear. Therefore, with the intention of build-
                                                                    ing on what currently exists, such a database will help provide information on gaps
                                                                    in resources and needs for moving forward. This database can be created by a pro-
                                                                    fessional organization documenting what programs exist, what their content is, what
                                                                    training models are available and what populations are being served. Secondly, a
72
parenting program working group should be convened with representation from min-
istries and agencies that are interested in moving the program forward. This working
group could be part of the early childhood education committee or a health promo-


                                                                                                                                                      PART 3 RECOMMENDATIONS FOR ECD PROGRAMS AND POLICY IMPLEMENTATION
tion committee. Thirdly, the group should consider conducting a feasibility study to
understand what would be required to implement an ECD parenting program. The
government could also partner with local organizations that have piloted programs,
shown to be promising among young children and mothers in Roma Ashkali and
Egyptian communities, as part of the feasibility study. Also to address the lack of
awareness of the importance of parenting, it would be important to launch an advo-
cacy campaign for policy makers and key decision makers.


Costing of Parenting Programs

      We now turn our attention to estimating costs for the suggested description
of the parenting program. As was noted earlier, given that there were no parenting
program models on which we could estimate costs, we have relied on program char-
acteristics based on international experience. The assumption for the costing takes
into consideration existing international parenting program models. The costing is
estimated for programs that serve families with children from birth to 3 years of age.

Parental support is best delivered through two modalities in parallel:

  ■■ 	 arental education in groups of 20 parents maximum;
     P
  ■■ 	 ome-visiting on an individual basis39.
     H

    The table below indicates the frequency of both the group sessions and the
home visits on a monthly basis. Note that this frequency differs by age.

   Table 6. Parental support

Parental support: number of groups sessions and home visits per month, by age
                              Parental education in groups Home visiting
Pregnancy (last six months)                 0                          1
Age 0                                       1                          2
Age 1                                       1                          1
Age 2                                       1                          1
Source: Yale University, The Edward Zigler Center of Child Development and Social Policy (2011).

      In addition to this service delivery scheme, there are a number of other assump-
tions that codetermine the costs.


Extra time

      Both the moderator who leads the group sessions and the professional that
visits the home need some extra time for preparation, consultation of colleagues,
interaction with others in the community, travel, et cetera. For the moderator this
extra time amounts to two hours (per session of two hours) and for the home visitor
it amounts to half an hour (for each visit of one hour).


 39	 In some cases, programs provide for individual counseling that takes place in a center (where the group sessions also take place) instead
     of in the home. This reduces the costs since the counselors need less time to travel, but creates a higher threshold for participation.
     Moreover, various aspects of parenting are best explained and/or trained in the home, while it is also important that the counselor visits the
     home at least some times in order to assess the environment in which the family lives and the child grows up.                                                     73
Salary and case load

                                                                          For the moderator we assume a normative salary of €300 per month and or
                                                                    the home visitor €200 per month. In practice, the salaries are likely to be lower since
PART 3 RECOMMENDATIONS FOR ECD PROGRAMS AND POLICY IMPLEMENTATION


                                                                    both the moderator and the home visitor may be part-timers, or combine this job with
                                                                    other work. Theoretically, the maximum caseload for the home visitor is about 10040.
                                                                    But with such a large number of families, it is impossible for the home visitor to get to
                                                                    know their clients well, familiarize with their home situation, and develop strong ties.
                                                                    On the other hand, with a caseload of only 10, the program becomes very inefficient
                                                                    as the costs of supervision and initial and refresher training (see below) become
                                                                    disproportional high. Therefore it is assumed that the average caseload of the home
                                                                    visitors is 40.


                                                                    Supervision of moderators

                                                                          Both the moderator and the home visitor will benefit greatly from supervision by
                                                                    an expert, e.g. from the Pedagogical Faculty. We assume a salary of €350 for this su-
                                                                    pervisor. The moderator, who is a well-qualified expert her/himself, would receive on-
                                                                    the-job supervision twice a month during a quarter of a day41. Theoretically (assum-
                                                                    ing a fulltime job) this results in a caseload for the supervisor of 40. Again, in practice
                                                                    it may be a part-time job for the supervisor who may combine this, for instance, with
                                                                    work at the Pedagogical Faculty, but in this case this does not affect costs.


                                                                    Supervision of home-visitors

                                                                         The home-visitors do not necessarily have the same level of initial education
                                                                    and training as the moderators, and need more intensive supervision. We assume
                                                                    one day per month on average, but divided over several shorter learning sessions,
                                                                    both on-the-job and off-the-job, perhaps partly in smaller groups. Thus, the supervi-
                                                                    sor of the home-visitors can attend 20 home-visitors on a monthly basis.


                                                                    Initial and refresher training

                                                                          We assume 10 days of initial and 10 days of refresher training per year for the
                                                                    moderator, and 25 days of initial and 25 days of refresher training per year for the
                                                                    home-visitor, again from a professional who earns €350 per month. Also, we assume
                                                                    2 extra days per 10 day training for preparation, as well as a group size of 20 mod-
                                                                    erators or home-visitors. Much higher than the costs of the trainer are the costs of
                                                                    forgone salary for the moderator and home-visitor; they should be paid during the
                                                                    training.


                                                                     40	 The calculation is as follows. The number of visits per family depends on age, but the average is (1 + 2 + 1 + 0.5) / 4 = 1.1 per
                                                                         month. As each visit takes 1 hour plus half an hour for preparation and travel, the total amount of time per family is 1.1 * 1.5 =
                                                                         1.65 per month. Since one month contains about 4 weeks of 40 hours each, the total amount of time available is 160 per month,
                                                                         which is about 100 times the time needed per family per month.
                                                                     41	 In remote areas where a lot of travel time is needed, this could be replaced by one supervision session per month during half a day.
74                                                                       This makes no difference to total costs.
Materials and space

      The group sessions are held in a central space, e.g. a community center, ECD
center, local health center, or school. This leads to assumptions regarding expendi-


                                                                                                                                              PART 3 RECOMMENDATIONS FOR ECD PROGRAMS AND POLICY IMPLEMENTATION
ture on rent or refurbishment, inventory, maintenance and materials.


Unit costs and overall outcomes

      The parameters above have been inserted in a cost simulation tool developed
for and available at UNICEF Kosovo. With the use of this tool, different models (with
different values for the parameters) can be entered. This can be a helpful exercise
in the further development of the parental support program. For now, we report the
final outcomes of this exercise based on the parameters that were presented above.
These outcomes are summarized in the table below.

  Table 7. Parental support – unit and total costs

From unit costs to total costs
Unit costs of parental education in groups: per parent per year                                             € 5,50
Unit costs of home visiting: per family per year                                                            € 28,80
Total unit costs per parent/family per year                                                                 € 34,30
Total unit costs per child42 per year                                                                       € 17,15
Number of beneficiary families: 32,000 * 3.7543                                                             120,000
Total costs of including all Kosovar families: €17,15 * 120,000                                             € 2,056,321


     It can be seen from the table that the total costs of parental support are in
the order of magnitude of € 2 million, which is much lower than the € 12.6 million
needed for the ECD centers (see recommendation 2). This illustrates the high cost-
effectiveness of parental support. Through a relatively small number of intense learn-
ing sessions and home-visits, it provides a quality impulse to the primary educators:
the parents. They are the ones who do the job of educating their children on a daily
basis. Investing in them is investing in their children.4243


 42	 If a family has more than one child, the parents do not have to go through the programme again and again. Once is enough. Hence,
     we divide the 120,000 by the number of children per family. This stood at 2.38 in 2008 according to the World Bank. Given the
     downward trend in fertility, we round off to 2. Fertility rates among certain minorities such as the Roma, Ashkali and Egyptian
     population are usually higher. This does not affect this calculation which is at macro-level, but it should be kept in mind during the
     concrete implementation of the parental support program.
 43	 The total number of newborns was estimated at 32,000 per year (see preceding section non ECD Centers). This figure must be
     multiplied by the number of age cohorts that are in the programme at any given time. This number is 3 (ages 0, 1 and 2) to which
     we must add three quarters of a year for pregnancy. This makes 3.75 age cohorts. Multiplication of 32,000 with 3.75 gives us the
     number of (born and unborn) children in the program (120,000).                                                                                            75
Figure 24. Costing simulation tool for parenting program

                                                                      KOSOVO SIMULATION TOOL
PART 3 RECOMMENDATIONS FOR ECD PROGRAMS AND POLICY IMPLEMENTATION


                                                                      PARENTAL EDUCATION IN GROUPS.                           HOME VISITING. From pregnancy to age 3
                                                                      From pregnancy to age 3
                                                                                                                            Visitor’s normative fulltime salary:
                                                                    Moderator’s normative fulltime salary:                  Salary / month	                   200
                                                                    Salary / month	       300                               Salary / year	                  2400
                                                                    Salary / year	      3600
                                                                                                                            Normative hours fulltime job:
                                                                    Normative hourse fulltime job:                          Hours / day 	                    8
                                                                    Hourse / day	            8                              Days / week 	                    5
                                                                    Days / week	             5                              Weeks / year	                   45
                                                                    Weeks / year	           45                              Hours / year	                 1800
                                                                    Hours / year	         1800
                                                                                                                            Salary costs per visit:
                                                                    Salary costs per se    ssion:                           Salary / hour	                       1.3
                                                                    Salary / hour	          2.0                             Hours / visit	                       1.0
                                                                    Hours / session	        2.0                             Extra time / visit	                  0.5
                                                                    Extra time / session	   2.0                             Salary cost / visit	                 2.0
                                                                    Salary cost / session	 8.0
                                                                                                                            Number of visits per month:
                                                                    Number of sessions per month:                           Pregnancy	1.0
                                                                    Pregnancy	0.0                                           Age 0	                      2.0
                                                                    Age 0	                0.0                               Age 1	                      1.0
                                                                    Age 1	                1.0                               Age 2	                      0.5
                                                                    Age 2	                1.0                               Visits / month av.	         0.6              Visitor’s salary
                                                                    Sessions / month av	 0.3    Moderator’s salary                                                     per family per year
                                                                                                     per parent per year                                                       14.6
                                                                                                                            Families per visit	                   1
                                                                    Group size	                20            1.4
                                                                                                                            Salary costs of supervisor:
                                                                    Salary costs of supervisor                              Salary / month	                    350
                                                                    Salary / month 	       350                              Salary / year 	                   4200     Supervision costs
                                                                                                     Supervision costs                                                 per family per year
                                                                    Salary / year	        4200        per parent per
                                                                                                                            Case load 	                         20
                                                                                                                                                                              5.3
                                                                    Case load	              40           year 1.1           Families / visitor	                 40
                                                                    Groups / facllitator	     8
                                                                                                                            Costs of initial/refresher training
                                                                    Costs of initial/refresher training                     Salary costs of trainer:
                                                                    Salary cost of trainer                                  Salary / month 	                   350
                                                                    Salary / month	          350                            Salary / day	                       18      Visitor’s training
                                                                    Salary / day	              18                           Training days / year	               10     per family per year
                                                                    Training days / year 	     10                           Extra days / training	              20              2.9
                                                                    Extra days / training	       2                          Visitors / training	                20
                                                                    Moderators / training	 20                               Costs trainer / visitor	            11
                                                                    Costs trainer / mod.	      11                           Visitor’s forgone time:
                                                                    Moderator’s forgone time:           Moderator’s         Train. hours / year	                80
                                                                    Train. hours / year	       80        training           Salary / hour 	                      1
                                                                    Salary / hour 	              2 per parent per year      Forgone salary	                    107
                                                                                                            1.1
                                                                    Forgone salary	          160
                                                                                                                                                                         Home visiting
                                                                                                                                                                       per family per year
                                                                    Materials / parent / yr	   1
                                                                                                                                                                              22.8

                                                                    Facility
                                                                    Rent of space per yr.	 1500
                                                                    Invenory	500                                                Parental education and home
                                                                    Life cycle (in years)	   15        Materials and            visiting per parent/family per
                                                                    Maintenance / year	 100                facility                         yr. 27.3
                                                                                                     per parent per year                                                   Beneficiaries
                                                                    Sessions / year	        600
                                                                                                             1.5                                                              60,000


                                                                                                      Parent education
                                                                                                       Per parent per
                                                                                                                                                      Total annual costs
                                                                                                          year 4.6
                                                                                                                                                            1638634
76
PART 3 RECOMMENDATIONS FOR ECD PROGRAMS AND POLICY IMPLEMENTATION
Recommendation b: Improving Early
Childhood Learning and Education
      An inalienable right for all children – is the right to education. An unequivocally
accepted premise is that the strongest foundation for building human capital is the
early years and early education. Kosovo has both ratified the CRC and is also in ur-
gent need to build its human capital resources, hence investing in early learning and
education appears to be a viable and important strategy for Kosovo. The recom-
mendation for improving early learning is rooted in the findings of the current study
and the empirical evidence in support of learning. Also presented are strategies to
improve and scale up early learning programs for children 3 to 6 years of age (see
figure 23).

       There are two sets of findings that are linked with this recommendation. The
first set is linked with enrolment in early learning programs and the second is linked
with school survival. With respect to early learning, findings are presented for the
public pre-primary year (5 to 6 years of age) and the preschool year (3 to 5 years of
age). For the pre-primary year, an estimated 70% of children are enrolled in these
programs. While the overall enrolment rates are acceptable, the study findings indi-
cate that poverty and exclusion of ethnic minorities in pre-primary learning are high.
As indicated in Part 1 of this report, children with an ethnic minority background
comprise only 2% of the early education population. Therefore the issues in pre-
primary enrolment are high inequity and marginalization of ethnic and rural poor chil-
dren. With respect to preschool enrolment (3 to 5 years of age) the overall enrolment
is very low. At best this can be estimated at 12%, but more realistic estimates put it
in single digit. Therefore the main issue related to preschool education, which is pro-
vided by public private, community and NGO programs, is an overall low enrolment.
The second set of findings that is important to consider is the low rate of secondary
school survival in Kosovo. It is estimated that about half of the children who walk in
through the school doors in 1st grade graduate from upper secondary school. This
statistic indicates that the school system is losing half its student body and that only
half of the children who enter school leave with a diploma. This statistic suggests
great educational inefficiency and an unacceptable number of children dropping out
of the education system. These findings provide compelling evidence for improving
the quality and access to early learning programs.

      Juxtaposed against this situation, we also provide findings from the policy anal-
ysis with respect to early learning programs. We first focus on the low rates of ethnic
minority enrolment and policy situation. The government of Kosovo, through the
Strategy for the Integration of Roma, Ashkali, and Egyptian Communities, presents
overarching objectives to prevent discrimination and promote education among eth-
nic minorities. Although it is beyond the scope of this report to evaluate the extent
of the implementation of the Strategy, it is clear that the provisions therein are lim-
ited in scope when it comes to young children. Specifically, four activities can be
identified that address preschool education: 1) a needs assessment for preschool
and pre-primary education; 2) qualified educators and their assistants are identified
from the ranks of Roma, Ashkali, and Egyptian communities and their inclusion as
service providers in the education system; 3) incentives and financial assistance is
offered to future educators for study, work and practice; and 4) accredited programs.
                                                                                                             77
If fulfilled, these activities are likely to increase early childhood education among
                                                                    Roma, Ashkali, and Egyptian children. However, a distinction needs to be made
                                                                    between long and short-term objectives for the provision integrated ECD services
PART 3 RECOMMENDATIONS FOR ECD PROGRAMS AND POLICY IMPLEMENTATION


                                                                    among these communities. There is urgency to promote equity in education among
                                                                    ethnic minorities. This urgency requires feasible short-term activities that start the
                                                                    process of integration and cultural customization of early childhood development
                                                                    programs immediately.

                                                                          Secondly, we look at overall enrolment rates in pre-primary and preschool and
                                                                    the policy analysis. In the KESP, the government of Kosovo has expressed the am-
                                                                    bition to expand coverage in pre-primary education from 70% in school year 2011-
                                                                    2012 to 90% in 2013-2014; universal access is foreseen by 2015-2016. For pre-
                                                                    school education, the targets are 15% for 2011-2012, 35% in 2013-2014, and 50%
                                                                    in 2015-2016. This strategy ranks in the top 10 dominating sub-sector targets and
                                                                    7th in the budget allocation within the priority areas. However, even though this
                                                                    expansion is stated, the sector efforts and budgets are dominated by school infra-
                                                                    structure for pre-university, which ranks highest by receiving almost half (40%) of
                                                                    the total budget. Furthermore, activities, tasks and responsibilities to achieve short,
                                                                    medium and long-term goals are specified but actors and responsible institutions
                                                                    are not. KESP outlined central agencies in education44 and some activity-specific
                                                                    stakeholders, but did not present systematic role/responsibility and accountability
                                                                    assignments. It is imperative that the government of Kosovo commits the resourc-
                                                                    es necessary for the expansion or pre-primary and preschool education and that it
                                                                    works jointly in the implementation of the expansion process with municipalities.

                                                                          The targets for pre-primary education seem appropriate. Universal access is
                                                                    highly urgent because at an enrolment rate of 70% in the preparatory year, an edu-
                                                                    cation system will increasingly adjust to the level of the enrolled majority, putting the
                                                                    excluded children at an even bigger distance. Compared to the high unit costs in
                                                                    full-day kindergarten, the costs per child in pre-primary education are low. At the
                                                                    same time, the economic and human benefits that accrue from the small investment
                                                                    in the children that are presently excluded from pre-primary education are much
                                                                    higher than the returns on the costly investment in the already privileged children in
                                                                    kindergarten. This justifies a policy of raising the fee in kindergarten in order to mo-
                                                                    bilize resources to support the expansion of pre-primary education to all children. It
                                                                    is also recommended to make the pre-primary year compulsory once enough places
                                                                    have been created to receive all children.

                                                                          For preschool education, the targets are less ambitious: 50% by 2011-2013.
                                                                    This seems understandable, given the high unit costs in kindergarten. Indeed, the
                                                                    assumption of the KESP is that most of the new places for children will be created
                                                                    in the private sector, necessitating a relatively small extra investment of €0.7 million
                                                                    of annual recurrent costs (apart from investment costs). However, the expectation
                                                                    that private kindergartens will expand rapidly is not realistic. The public kindergarten
                                                                    is so well-resourced yet inexpensive for the families, that there is no demand, and
                                                                    hence no market, for private kindergartens. The total capacity in private kinder-
                                                                    garten is very limited. None of these institutions have a valid license at present, no
                                                                    statistical data are kept, and there is no active policy to boost enrolment. The lack
                                                                    of regulation of the private sector in early childhood education raises red flags for the
                                                                    quality of the programs.

                                                                     44	 KESP outlines the central agencies in education, MEST, Kosovo Accreditation Agency, National Qualifications Authority, State Council
                                                                         for Teacher Licensing, National Council for Curricula and Textbooks, National Matura Council, Council for Vocational Education
                                                                         and Training for Kosovo (CVET), Kosovo Education Parents’ Council, State Council of Higher Education, National Research Council,
78                                                                       University of Prishtina, National Research Council Municipalities
Therefore, a strong effective and early learning program that supports increased
enrolment in preschool and pre-primary with the goal of improving school survival in
upper secondary, is required. The literature on school readiness suggests that chil-


                                                                                            PART 3 RECOMMENDATIONS FOR ECD PROGRAMS AND POLICY IMPLEMENTATION
dren who attend quality early learning programs are more likely to succeed in primary
school, not repeat grades and graduate from upper secondary school. School readi-
ness is comprised of 3 dimensions: children ready for school; families ready to send
their children to school and schools ready to receive children. In the previous rec-
ommendation we addressed parenting which feeds into the families ready for school
aspect of this definition. In this recommendation we tackle the aspects of ensuring
that children are ready for school and that schools are ready for children.

      As is clearly demonstrated by empirical evidence, attending high quality effec-
tive programs in the early years is linked with better school transitions, better primary
school grades and a great likelihood of upper secondary school graduation. The data
also indicate that children who are most disadvantaged benefit the most from early
learning ECD programs. Furthermore, sources state that enrolment of children in
playgroups by the age of three is essential for favorable development (Engle et al,
2007; the Consultative Group on Early Childhood care & Development, 2010). There-
fore implementing effective early learning programs appears to be a strong strategy
for overcoming low rates of ethnic minority enrolment in pre-primary, improving pre-
school attendance and reducing school drop out rates.

      The overall vision would be to ensure that all children in Kosovo between 3 to 6
years of age have access to quality effective early learning programs. This program
would strive for greater inclusion to ensure that ethnic and rural poor children have
access to services. The primary modality of this program could be community-based
centers that are financially sustainable and owned by communities. Effective early
learning programs have components of modality, curriculum, staff training, teacher-
child interaction, physical space, etc. that need to be addressed. We provide specific
recommendations for each of these components.

      It is recommended that the early learning program be implemented through
half-day programs in community ECD Centers. This is by far the most realistic op-
tion, to expand enrolment from age three onwards, especially for the children who
need it most and are likely to be found among the rural poor and ethnic minorities.
The experience in similar countries is that such programs are three to six times less
costly than full-day kindergarten (van Ravens, 2010). Often, such centers are called
“community-based’, suggesting that it is the community who bears all costs (i.e. the
municipality, the parents and possibly some local stakeholders). While this tends to
work in the less disadvantaged contexts, it fails in communities where poverty rates
are too high. Given the bleak statistics in Kosovo in this regard, many rural and ethnic
communities will require some degree of government support, even if the community
can still make some contribution as well, in money and/or in kind. An economic ben-
efit of ECD programs is women employment, not just in the centers but also mothers
are freed up to work, thereby stimulating local economies. This creates strong argu-
ments for a government to invest in community-based ECD: not just to enhance child
development, but also to stimulate rural development more directly.

      Because of the success that these centers have in some other countries in
the region, it is recommended to revitalize the movement of community based ECD
centers in Kosovo, but without repeating the mistake of the past: a small per capita
contribution from the government for every child in such a center may make all the
difference. Exactly how much that per child contribution from government must be
requires a more detailed costing study, even though initial and preliminary estimates                        79
are provided in this report. It may then appear that the contribution can vary: higher
                                                                    in areas that are poorer, more remote, more linguistically diverse, et cetera; and lower
                                                                    elsewhere. But even in the absence of such detailed costing, it is very likely that half
PART 3 RECOMMENDATIONS FOR ECD PROGRAMS AND POLICY IMPLEMENTATION


                                                                    a dozen or more children can attend half-day programs for the amount of money that
                                                                    the government now contributes to one single child in kindergarten.

                                                                          With respect to the quality and the content of the program there are several
                                                                    recommendations that address the primary language of instruction and the inclusion
                                                                    of ELDS as a quality improvement tool. As per the Law on Preschool Education, the
                                                                    language of instruction is Albanian. However, in areas of large ethnic minorities, local
                                                                    languages should be used. It also states that educational programs for preschool
                                                                    children should be based on general curriculum approved by MEST, Experts Council
                                                                    and School Textbooks but schools can develop their own curricula objectives based
                                                                    on this general guidance. In effect, preschools have quite a bit of freedom with re-
                                                                    spect to how they interpret and apply the general curriculum. This is a very good
                                                                    provision, as it will for example allow for cultural accommodations. However, what
                                                                    is missing is a stronger provision to ensure that there is equity in quality of programs,
                                                                    to have preschools adhere to a set of standards that are linked with the general cur-
                                                                    riculum, currently the law simply “suggests” that they should be. Therefore, a rec-
                                                                    ommendation for the ECD policy is to set a strong guidance on how the curriculum
                                                                    should be implemented so as to ensure equity in quality. A good example of how a
                                                                    community designed its program based on the Law for Preschool Education is the
                                                                    “EveryChild Project.” This model could be followed to strengthen the partnership
                                                                    between government and communities for curriculum design and implementation.

                                                                          The next set of recommendations are linked with effective implementation of
                                                                    the early learning program. Based on the review of laws and documents, it appears
                                                                    that the education sector has developed a very good tool for the implementation of
                                                                    a program, the MEST Administrative Instruction. This instruction is used in multi-
                                                                    ple different ways to ensure that the preschool programs are aligned with the Law
                                                                    on Preschool Education, such as giving instructions on how schools should create
                                                                    their annual work plans and conditions of defining costs of educational programs.
                                                                    However, these tools need to be strengthened for ECD program implementation. In
                                                                    particular, with the private sector beginning to play a role in early education service
                                                                    provision. Another dimension to improve quality of programs is to ensure that there
                                                                    is alignment between the community centers in accordance with the Law on Pre-
                                                                    school Education. The results of the review note that there is little alignment between
                                                                    the Community-based Center Strategy and the Preschool Law. It could be because
                                                                    the Community-based Center Strategy is from 2003 and the Preschool Law is from
                                                                    2006. Regardless, the standards in the preschool are much higher and the standards
                                                                    in the community-based center should be revised to make it aligned. For example,
                                                                    standard 1: staff qualifications for community-based centers are much lower than
                                                                    stipulated in the Preschool Law. The community-based centers state; “All adults
                                                                    providing day care, looking after children or having unsupervised access to them are
                                                                    suitable to do so.” However, the Law clearly states minimum education credentials
                                                                    for such a job. Secondly, the quality of care standards is low in the community-
                                                                    based centers. For example “The caregivers should meet children’s individual needs
                                                                    and promote their welfare. They plan and provide activities and play opportunities
                                                                    to develop children’s emotional, physical, social, and intellectual capabilities.” How-
                                                                    ever, the goals of the Preschool Law are much higher and comprehensive. With
                                                                    respect to quality, the community-based center’s guidance is well articulated. This
                                                                    set of standards, in particular standards for adult-child ratios, physical space, safety,
80                                                                  etc., would be very useful to align with the Ministry of Education’s Administrative tool
which is used for monitoring and supervision of preschool programs. Secondly, the
Early Learning and Development Standards provide a comprehensive set of expec-
tations for what children should know and be able to do. However, as has been stat-


                                                                                          PART 3 RECOMMENDATIONS FOR ECD PROGRAMS AND POLICY IMPLEMENTATION
ed, children do not develop in a vacuum, optimal contexts need to be created. The
community-based standards could be aligned with the ELDS to ensure that there is
a match between what the context is providing and what is expected of the children,
so that both set of standards can achieve the same goals.

      The curriculum is a vital component of an effective early learning program. The
curriculum seeds the content of learning and is the guide to the teachers for instruc-
tion and interaction with the children. Therefore the existing curriculum needs to
be revised by MEST, MOH, and MLSW. These main sectors, through a MoU would
need to decide on who would be responsible for the revision. It would be vital to
also involve NGOs and the private sector in the revision of the curriculum. The main
aspects of the revision should make sure to reflect the science on play based learn-
ing, the importance of teacher child interaction, attention to language of instruction
and culturally sensitive and appropriate methods.

      A series of next steps are suggested to move forward the design, development
and implementation of community-based early learning programs. First, munici-
palities, sector ministries, NGOs and the private sector would have to come together
in the early childhood education committee to adopt this recommendation. It is
important that the municipalities are represented during the adoption process as
community-based centers are supported by local levels of government. Secondly,
the committee would have to develop an action plan for implementing community-
based ECD centers. One of the primary tasks of the action plan is capacity building
and training of the teachers and the staff who support the early learning programs.
There will have to be provisions for pre-service and in-service training. Program ad-
ministrators and parents training would include lessons on budgeting and finance.
The plan of action also needs to determine how the early learning programs will link
to primary school to ensure a smooth transition for children from pre-primary to pri-
mary, as a predictor of school success.


Costing for Early Learning Centers
      Enrolment in formal kindergarten in Kosovo is very low, and the unit costs are
so high that it is unlikely that the formal kindergarten system can be increased sig-
nificantly. As in other countries in its region, Kosovo has experimented with smaller
ECD centers. In partnership with UNICEF Kosovo, we conducted a brief survey to
investigate the cost structure of these ECD centers. Questionnaires were sent to
and completed by the managers of eight centers providing information about the
financial aspects of their operations. Given the limited sample size (n=8) and limited
set of questions in the survey, the implications that can be drawn from the findings
are limited. However, given the commonalities between the 8 centers and our prior
experience in costing in other countries, including several in the region, it has been
possible to provide a good indication of the overall costs of scaling up these centers.

      Moreover, this costing exercise combined an empirical approach, i.e., –observ-
ing service delivery as it is with a normative approach, including components that
are linked with effective and quality programs. Therefore the estimates are relevant
and also help improve the quality of the existing programs. We present an example
of class size to explain this point and also demonstrate that the costing exercise is
based on a series of assumptions. The observed class size in some of the centers                           81
is 30 children per class. While this is the reality, this class size is considered too
                                                                    large for a good pedagogical process. Some international recommendations for
                                                                    ECD class size support 10 children per classroom. However, a class size of 10 is
PART 3 RECOMMENDATIONS FOR ECD PROGRAMS AND POLICY IMPLEMENTATION


                                                                    financially inefficient because the costs of the teacher, the space, and the inventory.
                                                                    Therefore, we base our assumptions on a class size of 20 children per class. This
                                                                    size, while being larger than some recommendations, is within a realistic reach of
                                                                    most centers and a size that can work for learning and playing in ECD settings.

                                                                          We first examine the recurrent costs of human resources, then those of mate-
                                                                    rial expenses. Finally there is a short section about how to mobilize the financial re-
                                                                    sources to cover the recurrent costs of the centers, followed by a section on upfront
                                                                    investment (space, refurbishment).


                                                                    Human resources
                                                                          Based on the survey results, it is noted that salaries of educators vary greatly:
                                                                    from less than €100 per month to more than €300. In part, this variation is linked with
                                                                    difference in hours of service. For instance, some centers receive children of three, four
                                                                    and five years old in one group from 09:00 to 12:00, five days per week (so that children
                                                                    attend 15 hours per week), in other cases it is 3 days per week (resulting in 9 hours per
                                                                    week for each child). In such cases, the teacher basically has a part-time job.

                                                                           However, this operational schedule is not very efficient, since the center (the
                                                                    space, the inventory, the equipment) is used during just a small part of the week. More
                                                                    efficient is the model (see table below) where the children of three years old attend from
                                                                    09:00 to 11:00, those of four years old from 11:00 to 13:00, and those of five years old
                                                                    from 14:00 to 16:00 (after the educator’s lunch break). This way, children receive an
                                                                    education that is well tuned to their specific age, during 10 hours per week45. The total
                                                                    material investment is used very efficiently: one equipped classroom is used by 3 * 20 =
                                                                    60 children. We round off to 50 children assuming that in sparsely populated areas it is
                                                                    not always possible to fill up the classes to their maximum capacity.

                                                                       Table 8. Operational Schedule of Early Learning Centers

                                                                    Current operational schedule
                                                                    Age            Age 3                                Age 4              Age 5            All ages   Rounded off
                                                                    Daily hours    09:00 – 11:00                        11:00 – 13:00      14:00 – 16:00
                                                                    Group size     20                                   20                 20               60         50
                                                                    Source: Yale University, The Edward Zigler Center of Child Development and Social Policy (2011).


                                                                          However, given the policy to universalize the pre-primary year for the five year
                                                                    olds, this operational schedule must be adapted to centers that eventually serve just
                                                                    the children of 3 to 4 years of age. By attending to the three year olds in the morning
                                                                    and the four year olds in the afternoon, it is possible to achieve two improvements
                                                                    at the same time:

                                                                      ■■ 	t is possible to expand instructional time, e.g. from two hours per class to two
                                                                         I
                                                                         and a half hours for the three year olds, and to three hours for the four year olds;
                                                                      ■■ 	 nd there would even be more time available for the teacher for other work such
                                                                         A
                                                                         as preparation of classes and activities with parents. This point is important be-

                                                                     45	 This model is also found in other countries, e.g. in Macedonia.

82
cause it is at this stage of development, when children are 3 years of age that the
      transition for families will occur from the parenting to the early learning program

   Table 9. Proposed Operational Schedule for Early Learning Centers


                                                                                                                 PART 3 RECOMMENDATIONS FOR ECD PROGRAMS AND POLICY IMPLEMENTATION
Proposed operational schedule
Age             Age 3                              Age 4                   All ages                Rounded off
Daily hours     09:00 – 11:30                      14:00 – 17:00
Group size      20                                 20                      40                      35
Source: Yale University, The Edward Zigler Center of Child Development and Social Policy (2011).


      For the educator, this schedule results in a working day of two groups of five
and a half hours in total. The remaining two and a half hours of the working day can
be spent preparing the classes and supporting parents. For such a demanding full-
time job, we propose a good salary of €300 per month, paid during all 12 months
of the year. This sits near the upper bound of what we found in the eight centers,
but we think educators deserve a salary that rewards them for hard and responsible
work, and gives them a sense of pride. Only in this manner will working in the centers
remain attractive. In practice, jobs like this can be shared of course. Two educators,
each earning €150 per month could share the job and replace one another during
illness or other forms of absence. A salary of €300 per month, paid 12 times per year
makes €3600 per year. Divided by 35 children, this is about €100 per child per year.

      Regarding the caseload of supervisors, we found ample variation in the eight
centers: from 2 to 20. Obviously, the roles of the supervisors differ accordingly. In
those cases where the supervisors have a relatively low caseload, they tend to func-
tion as managers rather than as supervisors in the sense of coaches that provide
professional support. By contrast, where the case load is relatively high, it usually
concerns supervisors who travel around between centers to visit educators, support
them, observe their work, provide feedback, et cetera. Striking once again a balance
between quality and efficiency, we assume that the centers operate in networks of
10 centers (attending a total of 500 children) and that the supervisor’s role is that
of a professional that provides pedagogical guidance and replaces the teachers in
case of illness, rather than that of a manager on a daily basis. With a caseload of 10
centers, the supervisor could visit each center once a week (one in the morning, one
in the afternoon). Assuming an annual salary of €5000 (about €400 per month), the
costs are about €15 per child per year.

      Refresher (in-service) training was found to cost €300-€400 per year per educa-
tor. Per 35 children this makes €10 per child per year.

    The total costs of human resources (teacher + supervisor + refresher training) is
€100 + €15 + €10 = €125 per child per year.

   Table 10. Recurrent Costs of Human Resources

Recurrent costs of human resources
Total salary costs for educator(s) per center                       €300 * 12 / 35 =               € 100
Supervisor for 10 centers                                           €400 * 12 / 350 =              € 15
Refresher training for educators                                    €350 / 35 =                    € 10
Total recurrent costs of human resources                                                           € 125
Source: Yale University, The Edward Zigler Center of Child Development and Social Policy (2011).


                                                                                                                                  83
PART 3 RECOMMENDATIONS FOR ECD PROGRAMS AND POLICY IMPLEMENTATION


                                                                    Material expenses
                                                                          The recurrent costs of material expenses concern: learning materials and inven-
                                                                    tory; the maintenance of the learning environment; and utilities and supplies. Here
                                                                    also we found some variation, but usually this could be attributed to the nature of the
                                                                    center. E.g. among the 8 centers there were two traditional kindergartens (a public
                                                                    and a private one) and their utility costs were very high due to the large space and
                                                                    the need to serve meals. Taking into account the life cycle of materials (some materi-
                                                                    als need regular replacement while others can be used for several years) we found
                                                                    that the recurrent material costs amount to €85 per child per year. Together with the
                                                                    €125 per child per year for human resources, this results in an overall recurrent unit
                                                                    cost of €210 per child per year. For comparison, the costs of traditional kindergarten
                                                                    are about €12546 per child per month (though this includes amortization of the capital
                                                                    investment).

                                                                       Table 11. Total Recurrent Unit Costs

                                                                    Total recurrent unit costs
                                                                    Human resources                                                             € 125
                                                                    Material expenses                                                           € 85
                                                                    Total recurrent unit costs                                                  € 210
                                                                    Source: Yale University, The Edward Zigler Center of Child Development and Social Policy (2011).


                                                                    Mobilizing the financial resources
                                                                          Although the €210 is only a part of the cost, attention must be given to the
                                                                    upfront investment (which we address next, as it is the most important part). If the
                                                                    government of Kosovo can somehow ensure that it will cover a cost of €210 per year
                                                                    for each child of age three or four, the program can be considered to be sustainable.
                                                                    In the first part of this report, it was found that the annual number of children born in
                                                                    Kosovo is likely to stabilize at 32,000. Thus, the total number of children of three and
                                                                    four years old would be in the order of 64,000. From this number, we can subtract
                                                                    about 4,000 children of ages three and four who are enrolled in traditional (public and
                                                                    private) kindergarten. The remaining 60,000 children would cost €12 million annu-
                                                                    ally, which is close to only 10% of the education budget. A fee of €5 per child per
                                                                    month (paid during 10 months per year) would reduce the unit cost by €50 to €150
                                                                    per child per year. Total costs for the government would then go down to € 9 million.
                                                                    For comparison: the public kindergartens, where only 5000 elite children are enrolled,
                                                                    cost the tax-payer € 6 million annually.

                                                                       Table 12. Overall Costs for ECD in Kosovo

                                                                    Overall costs
                                                                    Total number of children of ages 3 and 4 in Kosovo                            32,000 * 2 = 64,000
                                                                    Already enrolled in public & private KG                                                     4,000
                                                                    Excluded                                                                                   60,000
                                                                    Overall costs without fee                                                     €210 * 60,000 =       € 12.6 million
                                                                    Overall costs with a fee of €5 per month, times 10                            €160 * 60,000 =       € 9.6 million
                                                                    Source: Yale University, The Edward Zigler Center of Child Development and Social Policy (2011).


84                                                                   46	 The fee is €25 to €30 per child per month, and the government’s contribution is €75 to €125.
PART 3 RECOMMENDATIONS FOR ECD PROGRAMS AND POLICY IMPLEMENTATION
Upfront investment
      Thus far, we have just discussed the recurrent costs and their coverage. Now
we touch upon the upfront investment such as the purchasing of a building and/or
the costs of refurbishing and initial training of teachers. These costs can vary con-
siderably depending on the local situation. It is not unusual with ECD centers such as
these that the municipality makes a building or space available (e.g. in a community
center or a school) and that the community assists in making the space safe and us-
able. Sometimes parents make in kind contributions by donating carpets, paintings,
or helping to fix the roof and paint the walls. Given this diversity, we propose to leave
upfront investment out of the budget cycle and seek more incidental solutions, as
these are indeed incidental costs. Local and international donors, for instance, could
assist. While it is not wise to let recurrent costs depend on incidental inputs, it is de-
fensible to make an exception for upfront investment, as long as recurrent costs are
secured through the government budget and perhaps a small fee.


Note: To consider and cautionary

      It should be repeated that both the € 12.6 million for the ECD Centers and the €
2 million of the parental support are but rough estimations, based on recommenda-
tions by the authors of this report. Yet, these estimates do provide an indication of
the order of magnitude of the costs. Policy makers in Kosovo may eventually arrive at
other figures as they repeat the exercise, but these other figures are unlikely to differ
very substantially.


Area 2: Strengthening
Governance for ECD
       The ECD program, as is being recommended for Kosovo, has two major types
of programs that cut across the entire early childhood age range and need to be
lead, supported and coordinated by a range of actors (See figure 23). Creating sus-
tainable ECD programs requires infrastructure support to ensure that the programs
and services are cohesive, coordinated and implemented effectively. These vertical
interventions and comprehensive approaches to ECD service and planning and im-
plementation require a governance infrastructure that outlines the roles and respon-
sibilities of key members and stakeholders in the planning, coordination and imple-
mentation of services. The recommendation below is to provide such a governance
infrastructural support for the ECD Program.


                                                                                                              85
Recommendation a: Coordinating effective
                                                                    implementation of sustainable systems for ECD
PART 3 RECOMMENDATIONS FOR ECD PROGRAMS AND POLICY IMPLEMENTATION


                                                                          Among the sampled documents, we noted very little multi-sectoral and/or com-
                                                                    prehensive approaches in the framing of objectives, activities and implementation
                                                                    systems (figure 21). Kosovo’s provision of ECD services remains primarily secto-
                                                                    ral and cross-sectoral. Literature suggests several reasons why comprehensive ap-
                                                                    proaches are invaluable for helping build and sustain ECD programs (Vegas, 2010).
                                                                    First, comprehensive approaches promote the participation of multiple stakeholders
                                                                    who often are not included and do not influence the political debate (such as working
                                                                    mothers and their children). Multiple stakeholder participation may inform the policy
                                                                    process from perspectives that are critical to driving demand, supply, and implemen-
                                                                    tation of programs. Second, as noted throughout this report, ECD and ECD policies
                                                                    cut across sectoral boundaries by involving health, education, and social planning
                                                                    sectors. These sectoral boundaries can result in the isolation, fragmentation, and, in
                                                                    some cases, lack of cohesion of ECD programs. In the absence of a comprehen-
                                                                    sive approach, there can be a subsequent absence of institutional anchors for ECD
                                                                    programs and challenges in identifying “champions” for ECD among government
                                                                    institutions. Third, some ECD investments are characterized by the long time horizon
                                                                    required to achieve tangible results. This, together with the short-to-medium-term
                                                                    planning horizon of many political actors, makes it difficult for ECD investment to
                                                                    become a high priority. To increase ECD effectiveness integrating budgets, planning
                                                                    and implementation processes, within and across ministries (horizontal) is strongly
                                                                    encouraged.

                                                                           With the aim of ensuring a cohesive ECD program that is effective and coordi-
                                                                    nated across sectors, a recommendation for governance is being made through an
                                                                    ECD Coordinating Committee. Described below are the structure, roles and respon-
                                                                    sibilities for this coordinating committee.


                                                                    Structure of the ECD Coordinating Committee

                                                                          Given that the programs and services impacting young children and families are
                                                                    going to be lead and be supported by different sectors, there is a need to institute a
                                                                    coordinating body that can ensure effective implementation. This coordinating body
                                                                    therefore needs to be comprised of representation from the key sectors and partners
                                                                    who are involved in ECD programming (See figure 25). It is suggested that the 3 lead
                                                                    ministries: MEST, MOLSW and MOH are represented in the Coordinating Commit-
                                                                    tee. However, as is evident, there are several NGOs who are also centrally involved in
                                                                    ECD programming. Therefore, representation from these organizations needs to be
                                                                    included in the ECD Coordinating Committee. In addition, in Kosovo, international
                                                                    development agencies, such as UNICEF play a central role in programming and poli-
                                                                    cies for children and families. It is important that representation from these agencies
                                                                    is included. Finally, given that the municipalities, in particular for the early learning
                                                                    centers, will be very involved in the planning, it will be important to have representa-
                                                                    tion of the municipalities on this committee. It should be noted that for the NGOs and
                                                                    municipalities, there are further sub-groups indicated in figure 25. This sub-grouping
                                                                    denotes that for NGOs and municipalities there are further sub-levels of functioning
                                                                    that would need to be included in this committee, in particular with attention to rural
                                                                    areas and ethnic minority populations. A chairperson should be elected to lead the
                                                                    committee for a term-period and a full time committee secretary should be hired to
86                                                                  oversee and organize all activities.
Figure 25. Structure of ECD Coordinating Committee
                                                   Prime Minister’s
                                             Office of Good Governance


                                                                                                 PART 3 RECOMMENDATIONS FOR ECD PROGRAMS AND POLICY IMPLEMENTATION
                                               ECD Coordinating Body


              International Development Agencies                    MOLSW


                                                                                          MEST


            NGO’s


                                       MOH                               Municipalities


Roles and Responsibilities
     The main purpose of the ECD Coordinating Committee is to integrate strategies
and sectoral plans to ensure coordination in ECD services and programs. This com-
mittee, because of its representations across all key stakeholders and partners can
ensure that policies, plans and programs that directly address ECD, across sectors
are coordinated effectively. The coordinating committee can work towards creating
a shared vision for ECD across sectors and roadmap for effectively infusing ECD
standards into programs across health, education and protection sectors.

      In order to ensure that this committee is neutral and also has legislative and ex-
ecutive powers, it needs to be housed under the Office of Good Governance. In do-
ing so, this committee will function under the auspices of the Prime Minister’s office
and will be empowered to work across sectors without being subsumed into a sector
or ministry. Further, under the auspices of the Prime Minister’s office the neutrality of
this committee will be established.

The following roles are suggested for the ECD Coordinating Committee:

 ■■ To raise awareness on ECD within the Government. As has been cited previous-
    ly, one of the challenges in moving forward a coordinated ECD program is the
    lack of awareness among key policy makers on the importance of ECD. There-
    fore a primary role of the coordinating committee will be to raise awareness and
    knowledge of the importance of ECD with the highest level of legislative and
    executive bodies in Kosovo.
 ■■ 	 stablish an ECD Policy Steering Group. As indicated in Part 2 of this report,
    E
    while Kosovo has a plethora of strategies, policies and action plans that impact                              87
young children and families, the ECD provisions and directives are unclear. Fur-
                                                                        thermore, the sectoral plans are fragmented. Therefore a steering group that
                                                                        will ensure that all policies and plans that directly impact ECD are clear and
PART 3 RECOMMENDATIONS FOR ECD PROGRAMS AND POLICY IMPLEMENTATION


                                                                        coordinated, is required. The steering group should be comprised of technical
                                                                        experts who can review all policies to ensure that the principles of holistic ECD
                                                                        and CRC are upheld. When gaps are identified, the technical committee can
                                                                        make recommendations to revise the policy. For future policies and plans that
                                                                        will be developed, this group, under the auspices of the Prime Minister’s office
                                                                        can review them in advance and make recommendations to ensure that the
                                                                        principles of the ECD program are upheld.
                                                                     ■■ 	 o ensure that the standards of the ECD Program are maintained. The recom-
                                                                        T
                                                                        mended ECD program for Kosovo has 2 major components, a parenting pro-
                                                                        gram and an early learning program. The roll out and scale up of this program
                                                                        will require quite a bit of coordination. After the program is developed, the sus-
                                                                        tained implementation will also require coordination and oversight. Therefore,
                                                                        it is recommended that a key function of the ECD Coordinating Committee is
                                                                        the oversight of the ECD program. The committee should perform the role of
                                                                        a regulatory body to ensure that the quality of the program is keeping with set
                                                                        standards. The committee should make recommendations when the program
                                                                        adheres to standards and when it does not. The standards should ensure that
                                                                        young children’s survival, growth, development and protection are incorporated
                                                                        and implemented by the ECD program.

                                                                         The immediate next step for the ECD Coordinating Committee is to finalize its
                                                                    membership, elect a chairperson and hire a secretary. Once these roles are filled and
                                                                    the committee membership is determined then the Terms of Reference for the group
                                                                    need to be drafted. Also the committee needs to consider carefully setting up a plan
                                                                    of action which details out the activities, timelines and indicators of effectiveness of
                                                                    the proposed ECD program. Given that the ECD program is currently a recommen-
                                                                    dation, if adopted by the ECD Committee then the committee will need to develop an
                                                                    action plan to establish the phases of implementation of the program.


                                                                    Conclusion
                                                                          Kosovo is clear in its commitment to its youngest citizens. The vast array of
                                                                    policy and legal documents has made it clear that children are an important con-
                                                                    stituency. However, the situation for Kosovar young children does not appear to be
                                                                    supported by the policy claims, in that they appear to be bearing the greatest burden
                                                                    of poverty and inequity. In order to redress this situation, programmatic and policy
                                                                    actions are recommended. These two areas are synergistic and inform each other
                                                                    such that they lead to cumulative benefits. By helping families, the most proximal
                                                                    context for human development will be supported and enhanced, but addressing
                                                                    early learning, from a development perspective, the second greatest influence on
                                                                    young children is addressed and by providing recommendations for governance, a
                                                                    systematic approach to ECD is strengthened. Taken together, these two recommen-
                                                                    dations will serve to improve child outcomes and build a sustainable system for ECD.


88
Appendix I


                                                                                      Appendix
 Table 13. Matrix-Sampled documents and preliminary classification of content

                                                                  Economic
              Education           Health          Protection                  Other
                                                                  development
              Law on Pre-                         Family Law
              school Educa-                       of Kosovo
              tion (2006)                         (2004)
Law           Law on edu-
                                                  Law on So-
              cation in the
                                                  cial and Fam-
              municipalities
                                                  ily Services
              (2008)
Policy
Implementa-
tion Plan
                                                Strategy for
                                                Integration
              Strategy for
                                  Health Sec- of Roma,
              Health Promot-
                                  tor Strategy Ashkali, and
              ing Schools in
                                  (2010 – 2014) Egyptian
              Kosovo
                                                Communities
                                                in Kosovo
National
              Draft Education
Strategy
              Strategic Plan
              (2011-2016)
              Participatory
              strategy de-
              velopment for
              education for
              rural people
                                                  Disability
                                                  Action Plan
Action Plan
                                                  for Kosovo
                                                  (2009-2011)
              Early Learning
              and Develop-
                                Breastfeed-
              ment Standards
                                ing
              For Children
National      ages 0-6 Years
Standards,    The Kosovo
Curricular    Curriculum
Frameworks    Framework draft
and Pro-      Criteria for Com-
grammatic     munity Based
Guidelines    Centres In
              Kosovo
              Community
              based ECD pro-
              ject Phase 3


                                                                                        89
Iodine Defi-
                                             ciency Dis-
                           Indicators and
                                             orders (IDD)/
                           Statistical Data                                                 Kosovo
                                             Universal Salt Human rights
Appendix


                           in Education                                                     (2010) Pro-
                                             Iodization     in Kosovo
                           (2004-05, 05-06,                                                 gress Report
                                             (USI) Social
                           06-07)
                                             Mobilization
                                             Campaign
                                                            Worried
                                                            Souls: Vulner-   Kosovo Un-
                           Preschool
                                                            able Children    der UNSCR      Country pro-
                           education - the
                                                            and Families     1244/99        file (World
                           current situation
                                                            in Mitrovica     (2009) Pro-    Bank)
                           (2010)
                                                            South, Ko-       gress Report
                                                            sovo
                                                                                            Design and
                                                                                            use of the
                                                                                            data base
           National
                                                                                            on social
           Data,
                       Better parenting                                                     services for
           Situational                                      UNICEF Birth
                       initiative evalua-                                                   families and
           Analyses                                         Registration
                       tion (2009)                                                          children:
           and Program
                                                                                            regulatory
           Evaluations
                                                                                            purposes
                                                                                            and case fol-
                                                                                            low up (ppt)
                           Method for esti-
                           mating the Ko-
                           sovo school age
                                                                                            Governance
                           population by
                                                                                            report Ko-
                           year of age AND
                                                                                            sovo (2009)
                           Kosovo school
                           age population
                           (2 xl files)
                           Monitoring and
                           Evaluation of                                                    Kosovo
                           Better Parenting                                                 profile
                           Initiative (BPI)
                           Quality Educa-
                                                                                            UNDP
                           tion for All in
                                                                                            Report
                           Kosovo
                           Balkan NGO
                           learning centers

                           Balkan NGO
           NGO Inter-      summer pro-
           ventions        gram
                           Save the Chil-
                           dren evaluation
                           of CB Centers
                                              Develop-
                                              ment of                                       Strengthen-
                                                                             Mid term
                                              Sector-Wide                                   ing human
           Social Pro-                                                       expenditure
                                              Approach                                      capital of
           grams, Hu-                                                        review
                                              in Kosovo                                     Kosovo
           man Capital,
                                              Health
           Macroecono-
                                                                                            Devolution
           mic Interven-
                                                                                            of social
           tions
                                                                                            services –
                                                                                            main report
90                                                                                          (2006)
Table 14. Identification of activities that may spill over into services concerning children 0-6 years of age

Sector                          Strategies


                                                                                                                 Appendix
                                By 2016, capacities are built for all for improved and effective
                                system management at the central and municipal levels, as well
                                as for an effective management of schools – including mecha-
                                nisms to involve more women in management
                                By 2016, legislation is fully harmonized and finalized for the en-
                                tire sub-sector of pre-university education
                                By 2014, full responsibilities for management of finances are
                                devolved from the central to municipality level and further from
                                municipality to school level
                                By 2016, quality assurance mechanisms are made fully func-
                                tional at the central, municipal and school level
                                By 2016, advisory and guidance services are coordinated at
                                the central level and supported at municipality and school lev-
                                els providing equitable access to professional and advisory and
                                guidance services
                                By 2016, curricula are developed, piloted and implemented for
                                all school levels of pre-university education, followed by re-
                                spective improvement in teaching and learning methodologies
Pre-University Education        and in student assessment and are gender screened
                                By 2014, the teacher licensing system is fully functional and
                                career development supported
                                By 2016, an effective system is built that allows for inclusion
                                of all students in compulsory education and training and is re-
                                sponsive to gender and the needs of vulnerable, poor and dis-
                                advantaged students
                                By 2016, an effective network of upper secondary schools is
                                set up that allows for inclusion of all children
                                By 2016, schools have created non-violent and child-friendly
                                environments that is supportive, caring and develops demo-
                                cratic values in children and offers role models for all groups
                                By 2016, at least one third of schools in Kosovo operate in a
                                single shift, whereas the others in not more than two shifts, of-
                                fering quality environment with an optimum number of students
                                in classrooms
                                By 2016, all schools in Kosovo are provided with standard pack-
                                ages on a needs basis with instruction materials and resources
                                adequate and fit for implementation of the new school curricula


                                                                                                                   91
Sector                     Strategies
                                  By 2016, all administrative instructions on TD are harmonized
                                  with the effective legislation and are being implemented
Appendix


                                  By 2016, at least 80 percent of MEST representatives (TTU and
                                  inspectors), MEDs and school principals are trained in accred-
                                  ited leadership and management programs and Gender Parity
                                  is improved
                                  By 2014, capacities have been built for needs assessment and
                                  evaluation of TPD
                                  By 2014, a Management Information System is in place for col-
                                  lection of training data
                                  By 2016, MEST accredits minimum 40 TPD programs based on
                                  teachers’ training needs
                                  By 2016, MEST in cooperation with the NQF certifies and li-
                                  censes trainers of TPD programs
                                  By 2016, 90 percent of teachers have renewed their licenses,
                                  whereas 5-10 percent have been promoted to a higher level
                                  ensuring equity and gender parity
           Teacher Education
                                  By 2016, school-based professional development has been
                                  established in all schools to ensure sustainability of training re-
                                  ceived
                                  By 2016, mechanisms are in place and functioning for monitor-
                                  ing and evaluation of training programs that is equitable and
                                  gender sensitive
                                  By 2016, at least 15 percent of education officers and teachers
                                  have participated in joint regional and international TPD pro-
                                  grams
                                  By 2014, prior learning in non-formal education and in-service
                                  training are recognized by teacher education faculties for pur-
                                  poses of teachers’ (re)qualification
                                  By 2016, all teacher education programs are fully harmonized
                                  with MEST policies, whereas 80 percent of their staff have been
                                  trained in TPD programs
                                  By 2016, there are increased research opportunities in teacher
                                  education faculties
                                  By 2011, an ICT Strategy is in place and operational
                                  By 2016, the provision of adequate infrastructure for ICT
           Information & Communi- By 2016, development of human resources
           cation Technology      capable of applying ICT
                                  By 2016, draft curricular is in place that integrates the use of
                                  ICT and e-Learning aligned with international standards


92
Table 15. Organizational Structure of MLSW until the moment of transfer of competencies in MDHSW
(taken from the 2010 Policy Statement on Social Services, Association of Kosovo Municipalities


                                                                                                                                     Appendix
                                   Ministry of Labour and Social Welfare


                                                 Permanent Secretary


 Department of ad-       Department of            Department               Department            Division of Central   War Victims
 ministration of Pen-    Social Welfare          of Labour and            of Institute for            Services           DFDIL
        sions                                     Employment              Social Policy


Budget Plan-
                   Division of                Division of
ning and As-                                                           Division of
                     Social                     Social
  sessment                                                             Institutions
                   Assistance                  Services
   of Poor


                                 Center for                 Shtimje/Stimlje           House of
                                  Social                    - Special Insti-          Holders-
                                   Work                         tution            Prishtinë/Pristina

                                        House for chil-         House of Children
                                                                Graçanicë/Graca-             Other Residential
                                         dren Shtime/
                                                                      nica                        House
                                            Stimlje


                                                                                                                                       93
Appendix II
Appendix


            Box-1 Overview of education system in Kosovo

           Strategy for Health Promoting Schools in Kosovo: A Description of Governance
           According to the Strategy for Health Promoting Schools in Kosovo, the Ministry of Educa-
           tion, Science and Technology is responsible for formulating, developing, and implementing
           policies and strategies in the field of education. The Kosovo Consolidated Budget within
           the Ministry of Economy and Finance provides funding for the different levels of education.
           MEST, by conducting the process of decentralization, has 7 Regional Education offices, led
           by regional education officials, and 30 units within municipalities, appointed as Directorate’s
           of Education, led by municipal directors of education. Municipal directorates report to the
           municipal assemblies, respectively local authorities, whilst Regional offices report to the
           Ministry.


            Table 16. Overview of projected costs for the education sector until 2016 and beyond (taken from KESP)

                                      2011-2016           2011-2016                                 Annual
                                                                                2011-2016
           Sub-sector               development            recurrent                        recurrent costs
                                                                                 total cost
                                           cost               costs                            beyond 2016
           1. Pre-University
                                      237 037 324       130 156 480           367 193 804           30 279 150
           (PreU)
           2. Preschool (PSE)           3 217 050        17 742 085            20 959 135             3 620 920
           3. Vocational Train-
                                       23 140 950        18 146 760            41 287 710             4 310 350
           ing (VET)
           4. Teacher Prof Dev
                                        2 913 310          7 770 900           10 684 210             1 501 410
           (TE)
           5. Higher Education
                                       40 611 300        72 826 200           113 437 500           21 249 860
           (HE)
           6. Adult Education
                                          538 800          2 795 940             3 970 440            1 388 260
           (AET)
           7. Information and
           Communication               34 325 700        26 261 800            60 587 500             5 976 800
           Technology (ICT)
           Total                      341 784 434       275 700 165           618 120 299           68 326 750


94
Appendix III


                                                                                                      Appendix
    List of figures (Parts 1-3)

No.      Title                                                                                 Page

1        Demographic profile of Kosovo, 2011                                                     14

2        Number of births in Kosovo, 1981-2007                                                   15

3        Ethnic composition of Kosovo, 2010                                                      16

4        Live births by ethnicity, 2009                                                          16

5        Children 0-18 in Pre-University education in Kosovo, 2010                               17

6        GDP growth in Kosovo, 2002-2011                                                         19

7        Sectoral breakdown of government spending, 2005-2007                                    21

8        Health expenditure as a percentage of GDP in selected countries, 2005-2008              21

9        Education expenditure as a percentage of GDP in selected countries, 2005-2008           22

10       Spending on Social Protection in Kosovo and Selected Countries, 2008                    23

11       Per capita GDP in Kosovo in €, 2003-2012                                                24

12       Under-coverage and leakage in the social assistance scheme, 2003-2006                   27

13       Life expectancy at birth in selected countries, 2008                                    29

14       Infant and Under Five Mortality (per 1,000 births) nearby countries, 2005-2009          30

15       Moderate and severe stunting in selected countries, 2007-2009                           32

16       Health Spending as Share of GDP and of Total Government Spending, 2004-2009             33

17       Number of health professionals per 1,000 inhabitants, selected countries, 2001-2006     33

18       Numbers of enrolled children in three early childhood programs, 2004-2009               37

19       Preschool enrolment by per capita GDP in the wider region, 2008                         40

20       Unit costs as % of per capita GDP in kindergarten in six countries, 2007-2010           41

         Sectoral involvement in Strategies and Plans & analysis of overarching and
21                                                                                               50
         ECD-specific objectives

         Strategic Objective-1 from the Health Sector Strategy: Reduce morbidity and
22                                                                                               59
         mortality of the overall population

23       Overview of Recommendations for ECD Programs and Policy Implementation                  63

24       Costing simulation tool for parenting program                                           72

25       Structure of ECD Coordinating Committee                                                 83
                                                                                                        95
List of tables (Parts 1-3)

           No.      Title                                                                         Page
Appendix


           1        List of agencies and data sources                                               11

           2        Trend in poverty by location in Kosovo, 2002-2006                               18

           3        Municipalities’ budgets for health, social welfare and education, 2009-2012     20

           4        Poverty rates in Kosovo according to various definitions, 2006-2007             25

           5        Core indicators for Kosovo’s education system, school-year 2008-2009            34


               List of boxes (Part 1)

           No.      Title                                                                         Page

                    Insights from the team’s visit to a rural Community
           1                                                                                        43
                    Based ECE Center in Shkabaj


96
SELECTED REFERENCES
AAlderman, H., & King, E. (2006). Investing in Early Childhood Development.
Washington, DC: World Bank Publication.

Arnold, C. (2004). ‘Positioning ECCD in the 21st Century’, Coordinators’ Note-
book, no. 28, Consultative Group on Early Childhood Care and Development, pp.
1-34.

Balkan Sunflower. (2010). Learning Centers Network Newsletter, Autumn 2010.
Pristine, Balkan Sunflower.

Bartlett, S. (2005). Water, sanitation and urban children: The need to go beyond
“improved” provision. Children, Youth & Environments, 15, 115-37.

Black, R.E., Morris, S.S., & Bryce, J. (2003). Where and why are 10 million children
dying every year? Lancet, 361, 2226-34.

Bornstein, M.H. (2006). Parenting science and practice. In W. Damon (Series Ed.)
and K.A. Renninger and I.E. Sigel (Vol. Eds.) Handbook of child psychology; Vol.
4. Child psychology in practice (6th ed., pp 893-949). New York: Wiley.

Bowman, B., Donovan, M.S., & Burns, M.S. (2001). Eager to learn: Educating our
preschoolers. Washington, DC: National Research Council.

Britto, P.R. (2002). Children’s Rights. In N. Salkind, (Ed.) Macmillan Psychology
Reference Series, Vol. 1: Child Development. p. 84. New York: Macmillan Refer-
ence USA.

Britto, P.R. (2010). School Readiness and Child National and International Devel-
opment. New York: UNICEF.

Britto, P.R. Cerezo, A., & Ogbunugafor, C.B. (2008). How evidence can be used to
inform policy: A case study of early childhood evidence-bawse4d policy develop-
ment. International Journal of Early Childhood, 40, 2, 101-18.

Britto, P.R., Engle, P., & Alderman, H. (2007). ‘Early Intervention and Caregiving:
Evidence from the Uganda Nutrition and Child Development Program’, Child
Health Education, vol. 1, no. 2, pp. 112-33.

Britto, P.R., Fuligni, A.S., & Brooks-Gunn, J. (2006). Reading Ahead? A Review
of Early Literacy Intervention Programs for Young Children from Low Socioeco-
nomic Families. In. D. Dickinson & S. Neuman (Eds.), Handbook of Early Literacy
(pp.311-332). New York: Guilford Press.

Britto, P.R., & Kagan, S.L. (2010). Global Status of Early Learning and Develop-
ment Standards. In P. Peterson, E. Baker, & B. McGraw, (Eds), International Ency-
clopedia of Education. Vol. 2, pp. 138-143. Oxford: Elsevier.

Britto, P.R., Ulkuer, N., & Meyers, C. (2009). Impact of the economic crises on early
childhood development: An examination of mediating pathways with implications
for national policy. Paper presented, ODI/UNICEF Conference. London, England.
                                                                                        97
Bronfenbrenner, U. (1979). The Ecology of Human Development: Experiments.

     Brooks-Gunn, J., Britto, P.R. and Brady, C. (1999). ‘Struggling to Make Ends Meet:
     Poverty and child development’, Chapter 14 in Parenting and Child Development
     in “Non-traditional” Families , edited by Michael E. Lamb, Laurence Erlbaum As-
     sociates, Mahwah, NJ, pp. 279-304.

     Cheung, Y.B., Yip P.S.F., & Karlberg, J. (2001). Fetal growth, early postnatal growth,
     and motor development in Pakistani infants. International Journal of Epidemiol-
     ogy, 30, 66-72.

     Commission of the European Communities. (2002). Communication from the
     Commission – European benchmarks in education and training: follow-up to the
     Lisbon Council. Brussels, Commission of the European Communities.

     Commission of the European Communities. (2008). Joint report on Social Protec-
     tion and Social Inclusion. Brussels, Commission of the European Communities.

     Commission of the European Communities. (2009). Kosovo under UNSCR 1244/99
     2009 Progress Report. Brussels, Commission of the European Communities.

     Connell, C.M., & Prinz, R.J. (2002). Impact of children and parent-child interaction
     on school readiness and social skills development for low-income African-Ameri-
     can children. Journal of School Psychology, 40, 177-93.

     Consultative Group on Early Childhood care and Development. (2010). 4 Corner-
     stones to secure a strong foundation for young children. http://www.ecdgroup.
     com/pdfs/2008-FLYR-E-CLR-SEP08.pdf.

     Davidson, R.J., Lewis, D.A., Alloy, L.B., Amaral, D.G., Bush, G., Cohen, J.D.,
     Drevets, W.C., Farah, M.J., Kagan, J., McClelland, J.L., Nolen-Hoeksema, S., &
     Peterson, B.S. (2002). Neural and behavioral substrates of mood and mood regu-
     lation. Biol Psychiatry. Sep 15;52(6):478-502.

     Engle, P., Black, M., Behrman, J., Cabral de Mello, M., Gertler, P., Kapiriri, L.,
     Martorell, R., & Young, M. (2007). Strategies to avoid the loss of developmental
     potential in more than 200 million children in the developing world. In: The Lancet,
     369 (9557, 20 January, pp. 229-42.

     Garbarino, J., Dubrow, N.,Kostelny, K., & Padro, C. (Eds.) (1992). Children in dan-
     ger: Coping with the consequences of community violence. San Francisco, CA:
     Jossey Bass.

     Gassman, F., & K. Roelen. (2009). The Impact of the Social Assistance Cash Ben-
     efit Scheme on Children in Kosovo. Maastricht, Universiteit van Maastricht.

     Government of Kosovo. (2009). Midterm Expenditures Framework 2010-2012.
     Pristine, Government of Kosovo.

     Gueoruieva, A. (2008). Good Program, Good Investment. Policy Note on the Ko-
     sovo Social Assistance Program. Washington DC, World Bank.

     Hart, J. (2008). Business as usual? The global political economy of childhood
     poverty. Young Lives Technical Note, 13.

     Heckman, J.J., & Krueger, A.B. (Eds.) (2003). Inequality in America: What role for
     human capital policies? Cambridge, MA: MIT Press.
98
HMO solutions. (2007). Budget and legal analysis of early childhood education in
Kosovo. Pristine, Save the Children Alliance.

Hormann, E. (1999). Report on breastfeeding consultancy in Kosovo. WHO.

Jaramillo, A., & Tietjen, K. (2001). Early childhood development in Africa: can we
do more or less? A look at the impact and implications of preschools in Cape
Verde and Guinea. World Bank, Washington, D.C.

Kagitcibasi, C., Sunar, D., & Bekman, S. (2001). Long-term effects of early inter-
vention: Turkish low-income mothers and children. Journal of Applied Develop-
mental Psychology, 22, 333-61.

Lopez, A.D. (2000).Reducing child mortality. Bulletin of the World Health Organi-
zation, 78, 1173.

Hart, B., & Risley, T.R. (1995). Meaningful differences in the everyday experience
of young American children. Baltimore, MD: Paul H. Brookes Publishing Co.

Hodgkin, R., & Newell, P. (2007). Implementation handbook for the Convention on
the Rights of the Child. Geneva, Switzerland: UNICEF.

Kariger, P.K., Stoltzfus, R.J., Olney, D., et. al. (2005). Iron deficiency and physical
growth predict attainment of walking but not crawling in poorly nourished Zanzi-
bari infants. Journal of Nutrition, 135, 814-19.

Kuklina, E.V., Ramakrishnan, U., Stein, A.D., Barnhart, H.H., & Martorell, R. (2004).
Growth and diet quality are associated with the attainment of walking in rural Gua-
temalan infants. J Nutr. Dec;134(12):3296-300.

Lopez, A.D. (2000). Reducing child mortality. Bulletin of the World Health Organi-
zation, 78, 1173.

Mankiw, N.G., Romer, D. & Weil, D.N. (1992). A Contribution to the Empirics of
Economic Growth’, Quarterly Journal of Economics, vol. 107, pp. 407-37.

McCartney, K., & Phillips, D.A. (Eds.) (2006). Handbook of Early Childhood Devel-
opment. Oxford: Blackwell Publishing.

Ministry of Education, Science and Technology. (2008). Draft Education Strategic
Plan 2011-2016. Pristine, Ministry of Education, Science and Technology.

Ministry of Education Science and Technology. (2008/2009). Kosovo Education in
Figures 2008/09. Pristine, Ministry of Education, Science and Technology.

Ministry of Education, Science and Technology. (2010a). Second draft of the Cur-
riculum Framework for pre-school, primary, secondary and post-secondary edu-
cation. Pristine Ministry of Education, Science and Technology.

Ministry of Education, Science and Technology. (2010b). Kosovo Education Stra-
tegic Plan 2011-2016. Pristine Ministry of Education, Science and Technology.

Ministry of Health at al,. (2010). Perinatal Situation in Kosovo for 2000-2009. Pris-
tine Ministry of Health.

Mitrovica/e Institute for Health. (2008). An early draft of the HDR referred to this
study.

Montie, J.E., Xiang, Z., & Schweinhart, L.J. (2006). Preschool experience in 10
                                                                                          99
countries: Cognitive and language performance at age 7. Early Childhood Re-
        search Quarterly, 21, 313-31.

        Murphy, D.A. & Burns, C.E. (2002). Development of a comprehensive community
        assessment of school readiness. Early Childhood Research and Practice, 4, 1-5.

         Osofsky, J.D. (Ed.) (1997). Children in a violent society. New York: Guilford Press.

        Pianta, R.C. & McCoy S.J. (1997). The first day of school: The predictive validity
        of early school screening. Journal of Applied Development Psychology, 18, 1-22.

        Richter, L. (2004). The importance of caregiver-child interactions for the survival
        and healthy development of young children: A review. Geneva: World Health Or-
        ganization.

        Rodier, P.M. (2004). Environmental causes of central nervous system maldevelop-
        ment. Pediatrics. Apr;113(4 Suppl):1076-83.

        Rouse, C., Brooks-Gunn, J., & McLanahan, S. (2005). Introducing the issue,
        ‘School readiness: Closing racial and ethnic gaps’. The Future of Children, 15(1),
        5-14.

        Shala, M., & L. Luzha. (2010). Pre-school Education – the current situation. Pris-
        tine.

        Shonkoff, J.P., & Phillips, D.A. (2000). From neurons to neighborhoods: The sci-
        ence of early childhood development. Washington, D.C: National Academy Press.

        Statistical Office of Kosovo. (2008a). Demographic changes of the Kosovo popu-
        lation, 1948-2006. Pristine, Statistical Office of Kosovo.

        Statistical Office of Kosovo. (2008b). Analysis of the Vital Statistics for the Newest
        Period of Time. Pristine, Statistical Office of Kosovo.

        Statistical Office of Kosovo. (2009). Social Welfare Statistics 2009. Pristine, Sta-
        tistical Office of Kosovo.

        Statistical Office of Kosovo. (2010a). Statistics of Births in Kosovo 2009. Pristine,
        Statistical Office of Kosovo.

        Statistical Office of Kosovo. (2010b). Education Statistics 2008-2009. Pristine,
        Statistical Office of Kosovo.

        Szczurek, A. (2005). Community Based Early Childhood Education Project Phase
        3. External evaluation report. Pristine. EveryChild Kosova Organization.

        UNDP, forthcoming47. Human Development Report of Kosovo. Pristine, United
        Nations development Program.

        UNESCO. (2004). Education for All Global Monitoring Report. The Quality Impera-
        tive. Paris, UNESCO.

        UNICEF. (2002a). Facts for life. New York: UNICEF, WHO, UNESCO, UNFPA,
        UNDP, UNAIDS, WFP, and the World Bank.

        UNICEF (2005). Convention on the Rights of the Child. Retrieved January 19,
        2010 from http://www.unicef.org/crc/.

      47	 The authors have received draft versions of various chapters of the Human Development Report. It may be the case that the
100       content and pagenumbers of the final version differ from that draft version.
UNICEF Kosovo. (2010). Child Poverty in Kosovo. Policy Options Paper and Syn-
thesis Report. Pristine, UNICEF Kosovo.

United Nations Kosovo Team. (2008). Strengthening the Human Capital of Koso-
vo. Paper prepared for the International Donor Conference for Kosovo, Brussels,
11 July 2008.

UNMIK. (2003). The Kosovo Greenbook. A Strategy for Sustainable Agricultural
and Rural Development in Kosovo. Pristine, UNMIK.

Vegas, E. (2010). Promising models for early childhood development in Latin
America. Meeting of the National Forum for Early Childhood Programs and Poli-
cies, Chicago, IL, May.

Van Ravens, J., 2010. Fair Play. A financially feasible plan for equal access to
Early Childhood Programs in the Republic of Macedonia. Skopje, UNICEF.

Vogler, P., Crivello, G. and Woodhead, M. (2008). Early Childhood Transitions Re-
search: A review of concepts, theory, and practice. Working Paper 48, Bernard
van Leer Foundation, The Hague, 2008.

Vygotsky, L. (1998). The Collected Works of L.S. Vygotsky. NY: Plenum Press.

WHO. (1999). The critical link: Interventions for physical growth and psychological
development.Geneva, Switzerland: WHO.

World Bank. (2006).Global Monitoring Report 2006. Washington, DC: World Bank.
World Development Indicators (14 September 2007). World Bank: Indicators Da-
tabase.

World Bank. (2007). Kosovo Poverty Assessment. Volume 1: Accelerating Inclu-
sive Growth to Reduce Widespread Poverty. Washington DC, World Bank.

World Bank. (2009). Pre-employment Skills Development Strategies in the OECD.
Washington DC, World Bank.

Zigler, E.F., Gilliam, W.S., W.S., & Jones, S.M. (2006). A vision for universal pre-
school education. New York: Cambridge University Press.


                                                                                       101
The findings, interpretations and conclusions set out by the authors in this report do
not necessarily reflect the official position of UNICEF.

Unicef, the United Nations’ Children’s Fund, is charged by the UN General Assembly
with the protection of children’s rights worldwide, so that every child may enjoy a good
upbringing and personal development commensurate with their abilities.

Further information:
UNICEF
Ali Pashe Tepelena, No. 1
10000, Pristina, Kosovo
Tel. +381 38 249 230
Fax +381 38 249 234
prishtina@unicef.org
www.unicef.org/kosovo
Design: www.xhad.net
United Nations Children’s
Fund – UNICEF
Ali Pashë Tepelena, No. 1
10000, Pristina, Kosovo
Tel. +381 38 249 230
Fax +381 38 249 234
prishtina@unicef.org
www.unicef.org/kosovo

Joined hands - Better childhood

  • 1.
    Joined Hands BetterChildhood unite for children
  • 2.
    Joined Hands Better Childhood Pia Rebello Britto, Ph.D. Jan van Ravens, Drs. Liliana Angelica Ponguta, MPH, Ph.D. Yale University The Edward Zigler Center of Child Development and Social Policy August 31, 2011
  • 3.
    ACKNOWLEDGMENTS We would like to thank the UNICEF Kosovo office for its support during the completion of this report. In particular, we thank Mr. Johannes Wedenig, Mr. Luciano Calestini, Ms. Aferdita Spahiu, Ms. Kozeta Imami, Ms. Ivana Milosavljevic, Dr. Agron Gashi, Ms. Laura Fragiacomo, and Ms. Beate Dastel, Ms. Arijeta Gjikolli and Mr. Gë- zim Hasani. Furthermore, we appreciate contributions and information provided by government officials, in particular Mr. Agim Berdyna and Mr. Alush Istogu, Mr. Haki Sfishta, Ms. Laberi Luzha and Ms. Merita Shala, Mr. Remzi Salihu, Ms. Merita Vuthaj, Mr. Ilir Begolli, and Ms. Nazmije Krasniqi. The authors also would like to express their gratitude to Save the Children Kosovo, the Kosovo Education Center, and Balkan Sunflowers (especially Joanna Brucker) for their valuable information and discus- sions. We also thank William Hodges for editorial work and Adrian Cerezo and Nancy Shemrah Fallon for support with illustrations. Funding for this report was granted by UNICEF. 2
  • 4.
    Table of Contents EXECUTIVE SUMMARY....................................................................................... 4 INTRODUCTION................................................................................................... 7 STUDY OVERVIEW............................................................................................. 10 PART 1: SITUATION ANALYSIS......................................................................... 13 Introduction..................................................................................................... 14 ­­­­­­Chapter 1: The People.................................................................................... 15 Chapter 2: Economy and State Finance......................................................... 21 Chapter 3: Poverty and Social Protection....................................................... 26 Chapter 4: Health Status and Healthcare....................................................... 32 Chapter 5: Early Learning and Education....................................................... 38 PART 2: POLICY ARCHITECTURE ANALYSIS AND ASSESSMENT OF ECD PROVISION........................................................ 47 Introduction..................................................................................................... 48 Chapter 1: Legislative Framework.................................................................. 49 Chapter 2: Strategies and Plans..................................................................... 53 PART 3: RECOMMENDATIONS FOR ECD PROGRAMS AND POLICY IMPLEMENTATION..................................................................... 65 Area 1: Achieving Equity in ECD: A Program for Kosovo............................... 66 Area 2: Strengthening Governance for ECD................................................... 85 Appendix I....................................................................................................... 89 Appendix II...................................................................................................... 94 Appendix III..................................................................................................... 95 SELECTED REFERENCES................................................................................. 97 3
  • 5.
    EXECUTIVE SUMMARY Kosovo is moving forward with a keen interest in early childhood. This report presents the findings of an analytical study of the programs and policies in Kosovo that directly or indirectly impact the lives of young children and families. The purpose of this report is to suggest a set of Early Childhood Development (ECD) program and policy recommendations for Kosovo. Early Childhood Development is a multifaceted concept that covers the early childhood period from prenatal to 6 years of age and encompasses a set of coordi- nated services for young children and families. From a Rights perspective, within the framework of the Convention on the Rights of a Child (CRC), ECD takes into consid- eration the fulfillment of children’s rights to survival, development, participation, and protection. For ECD in Kosovo, this approach translates into ensuring that programs and policies accommodate for the right of all children to survive and be healthy, to develop to their fullest potential in a holistic way across all domains of development, to be able to participate in their environment as agents-of-change, and be protected from abuse, neglect, and forms of disadvantage and vulnerabilities. However, these rights are not being fulfilled. The aim of the study was to understand how best to improve the health, development, protection, learning and participation of all young children through programmatic and policy initiatives. The study was conducted in three phases: Phase 1 consisted of a systematic analysis of documents pertaining to ECD programs and policies. The aim of the review and analysis was to ascertain the de- gree to which they address ECD and in particular the attention accorded to holistic development. The sampled documents included laws, strategies, regulations, pro- gram evaluations, and situation analyses from the key sectors of education, health, and protection. Phase 2 of the study involved collection of interview data with key in- formants and observations of early childhood settings. The aim of the interviews and observations was to fill in the gaps in information that could not be obtained through the document review, and to generate recommendations for feasible and sustain- able ECD programs. Key informants included relevant partners and key stakehold- ers who are involved in ECD program and service provision and policy planning and implementation. Observations were conducted at public kindergartens in Zvecan and Prishtina, a community-based ECE center in rural Shkanaj, and Prishtina City Hospital, Labor and Delivery. Phase 3 of the study focused on sharing the results of phases 1 and 2 with key stakeholders, NGO leaders and partners to obtain their feedback on the results and support for recommendations. A series of presentations and a day-long workshop were held over three days with representatives from the leading government sectors, international agencies, NGOs and private sector. The results of those deliberations were used to finalize this report. The results of the study are presented in three parts: ■■ art 1: Situation analysis of ECD in Kosovo P In Part 1 of the report, the population and demographic profile highlights the relatively young population in Kosovo, with almost 30% below 15 years of age. With 4 respect to ethnic composition, the birth rate is roughly the same for the majority of the population and ethnic minority groups. Over 60% of the population resides in
  • 6.
    rural areas, andis also disproportionately of low income and economically disadvan- taged; 81% of the poor in Kosovo live in rural areas. Overall, close to 40% of all Ko- sovar people live on less than 2.50 US$ per day, defined by the World Bank as living in poverty. With respect to early nutrition, breastfeeding and infant feeding practices are problematic in that, as the data suggest, only 1 in 8 infants are exclusively breast- fed for the first 4 months of life, and more than one third of mothers have stopped breastfeeding completely by six months. With respect to child outcomes, close to 20% of children are stunted (moderately or severely). These health outcomes could be linked with low percentage of government spending on health (<10%) and limited access to health centers. While the enrolment rate for pre-primary education is approximately 70%, the proportion of children from ethnic minorities is less than 10%, thereby indicating a disparity in enrolment into early educational opportunities. One of the largest areas of need with respect to ECD is the gap in services for parents of young children. It was noted that parenting and caregiving programs, an evidence-based strategy for improving child outcomes, were poorly addressed by the health, education and pro- tection sectors despite their potential to impact ECD significantly. ■■ art 2: Content analysis of Laws, Sectoral Strategies, Strategic/Action P Plans, curricula, and regulations that address ther service provision for the youngest chidren in Kosovo Part 2 of the report focuses on the policy review and analysis. Due to the ab- sence of an ECD policy or policies in Kosovo, the documents analyzed provide the planning frameworks through which priorities, objectives, targets, and/or activities are set. The vast landscape of policy documents, frameworks, strategies and laws pertaining directly and indirectly to ECD suggest that Kosovo is committed to its children. The results of the review indicate that the education sector appears to have a comprehensive set of guidelines for ECD. Cumulatively, these documents cover important aspects linked to young children’s learning and education. The content analysis of Kosovo’s strategic documents suggests a limited alignment or cross- ref- erence among sectoral plans, strategies, and provisions. Each set of policy docu- ment appears to be directly linked with its own sector with little to no mention of allied programs and services, or even policy monitoring, that could be occurring under the aegis of other sectors. Finally, the legal framework for alleviation of social problems appears to be a distinctive characteristic of the Kosovo strategy. It was noted that there are a range of laws that have been endorsed with respect to social problems facing young children and families and that this legal approach is one that is consistently adopted by Kosovo. ■■ art 3: Recommendations for ECD programs and policies P Part 3 of the report identifies the gaps between the situation facing young chil- dren (Part 1) and the policy response (Part 2). Given that the aim of this report is to seed the development of a comprehensive programmatic response to ECD, by examining situations that are currently unanswered and with potential negative rami- fications for ECD, this section of the report provides recommendations for two broad areas of action. Recommendations for two broad areas of action provided in Part 3: ■■ Area 1: Achieving equity in ECD: A Program for Kosovo Recommendation a: ECD Parenting Program (birth to 3 years of age). The re- sults of the study indicate that the greatest area of inequity for children living in pov- erty is early education, in particular linked with rural populations and ethnic minority 5
  • 7.
    groups. A strongrecommendation is made to improve parental involvement for child health, education and protection. For example, for children’s education the MEST Education Strategy can be expanded to include parental involvement. Research in multiple other contexts has demonstrated that children’s success in education is largely linked with parental involvement, therefore there needs to be an emphasis on supporting parents and caregivers. It is recommended, however, that all sectors and relevant ministries join forces in ascertaining if their existing programs and activities can be boosted in the area of parental education, and agree upon a strong policy that transcends the borders of the disciplines such as protection, health and education. Recommendation b: Improving early learning programs (3 to 6 years of age). Only focusing on expansion and access to ECD can lead to limited success because providing more access to ECD services is not always accompanied by improvement in quality of services. Research shows that the quality of programs is the key ingredi- ent linked to improved child learning and development. In this recommendation, we present the situation for early learning and the limited policy response as a rationale for expanding the access and quality of early learning. This represents a vibrant and bold strategy to fulfill early child outcomes as a right and a predictor to later success. ■■ rea 2: Strengthening Governance for ECD A Recommendation a: Coordinating effective implementation of sustainable systems for ECD. Creating sustainable systems for ECD requires infrastructure sup- ports to ensure that the programs and services are coordinated when necessary and implemented effectively. Vertical interventions and comprehensive approaches to ECD service planning and implementation require a governance infrastructure that outlines the roles and responsibilities of key members and stakeholders. Kosovo’s provision of ECD services remains primarily sectoral. The literature suggests several reasons why comprehensive approaches are invaluable for helping to build and sus- tain ECD programs. To increase ECD effectiveness by integrating budgets, planning and implementation processes, within and across ministries is strongly encouraged through an ECD Coordinating Committee. This recommendation provides guidance for creating such a committee, its roles and responsibilities, so that cohesive service delivery can be strengthened under the guidance of such a group. Kosovo is well poised to take on this program of activities to improve outcomes for its youngest children. Moreover, based on initial and preliminary cost estimates, the economic investment is not great while the returns are manifold both for young children and the development of Kosovo. It is hoped that the results of this report will inform the creation of a strong ECD program for Kosovo and one that can be financially sustained and scaled up to serve the most vulnerable and disadvantaged populations. 6
  • 8.
    INTRODUCTION “Every child should have…a nurturing, caring, and safe environment – to survive, be physically healthy, mentally alert, emotionally secure, socially competent, and able to learn.” United Nations, A World Fit for Children Goal, 2002 The goal of development, be it human, societal, or economic, is progression towards potential (Hart, 2008). The interrelatedness of human, social, and economic capital has been established and the role of human capital, in this inter-relatedness, cannot be underestimated. A key input in building human capital is early childhood development (ECD). What is ECD and why is it important? ECD is making a strong appearance on the global stage because the national economic and social development paradigm is shifting from purely economic progress to human well-being (Alderman & King, 2006). For low, middle, and high-income countries alike, investment in human capi- tal formation has become a pivotal part of national development strategies (Mankiw, Romer, & Weil, 1992). Concurrently, three fields of knowledge – neuroscience, eco- nomics, and program evaluation science have independently established that invest- ing in the early years pays the greatest dividend to human capital formation. These three fields converge on one conclusion – early human development is indispensable to development in general (Heckman & Kruger, 2003; McCartney & Phillips, 2006; Shonkoff & Phillips, 2000). ECD is a multifaceted concept that covers the early childhood period from pre- natal to 8 or 9 years of age, or until the transition to school is complete (UNICEF, 2002a; UNESCO, 2005) and consists of a set of coordinated services for young chil- dren and families. Children’s development – as a result of good health, nutrition, ed- ucation, early stimulation, positive social and emotional interactions with significant adults/caregivers, play, learning opportunities, and protection from violence – gets its best start during this important period (Britto, Ulkuer & Meyers, 2009). Within this age period, children make rapid strides in all aspects of develop- ment through interaction with their environment (Richter, 2010). Seminal work in the Developed World “From Neurons to Neighborhoods” (Shonkoff & Phillips, 2000), commissioned by the United States Institute of Medicine, and more globally by the World Health Organization, “Early Child Development: A Powerful Equalizer” (Irwin, Siddiqui, & Hertzman, 2007), cogently culled and coalesced research from the neu- robiological, social, economic, and behavioral sciences to demonstrate that early childhood is also considered the key period for ensuring child survival and develop- ment. The achievement of holistic development is due to mutual influences of early experience and gene expression. The multidimensional aspects of ECD are comprised of several domains of growth, learning, and development, including physical health, motor skills, cogni- tive skills, social, ethical, spiritual and emotional development, competencies in lan- guage and literacy, and sense of national identity, to name a few (Britto & Kagan, 2010). The scientific research and evidence on ECD specifies three main age periods 7
  • 9.
    during which developmentoccurs with differing risks and opportunities (McCartney & Phillips, 2006). Conception to age 3 is the period of most rapid growth of mental and socio-emotional capacities, as well as the key period for ensuring survival and adequate growth (Shonkoff & Phillips, 2000). Brain architecture is built in a “bottom up” sequence, thereby necessitating the appropriate development of early capaci- ties. The development of the brain incorporates experience, positive or negative, that shapes the brain’s capacities through a complex connection of neural circuits in different parts of the functioning brain (Davidson, 2002). For example, the impact of poverty on early development can be noted prenatal where the odds of a poor infant to be born with low birth weight are nearly twice that of a non-poor infant (Brooks- Gunn, Britto, & Brady, 1999). Through the early years, an increase in malnutrition, stunting, and often delayed gross and fine motor development is also noted (Chueng, Yip, & Karlberg, 2001; Ka- riger, Stoltzfus, Olney, et. al., 2005; Kuklina, Ramakrishnan, Stein, Barnhart, & Mar- torell, 2004). Poor nutrition and infection cause stunting, which has been linked with delayed cognitive and verbal development (McGregor, et. al., 2007). Interventions during this period tend to be made through health and nutrition services and systems of support to families and communities (WHO, 1999). It should be noted that most infant and young child deaths are preventable with adequate nutrition and protection against disease, for example exclusive breastfeeding, clean drinking water, hygienic sanitation, and oral re-hydration during illness (e.g., diarrhea) (Bartlett, 2005; Black, Morris, & Bryce, 2003; Lopez, 2000). In addition to the risks of poor health and nutrition, children need to be protect- ed from the risks of exposure to violence and stress (Garbarino, Dubrow, Kostelny, & Pardo, 1992; Osofsky, 1997). Young children benefit from positive and responsive interactions with at least one consistent caregiver, including exposure to language and opportunities for exploration and learning (Britto, Fuligni, & Brooks-Gunn, 2006; Richter, 2004). For example, verbal engagement between parents and young chil- dren is one of the strongest influences on subsequent language development (Hart & Risely, 1995), which occur primarily in homes and communities (Britto, Engle & Alderman, 2007). In the period from 3-5 years, in addition to continuing support for strong physi- cal health, disease prevention, cognitive and learning stimulation, and emotional and social responsiveness, children need protection from violence, abuse, and neglect within their homes. The issue of protection is particularly relevant as very young children who suffer violence in their homes lack the capacity to report it, while those who are able to report incidents of violence against them are afraid to report for fear of the consequences (Pinheiro, 2007). Protection of children is required to ensure their safety and security; in particular, recent efforts aimed at reducing the risk of disaster note an increase in childhood deaths due to accidents and lack of safety. Beyond protection and safety, children also need exposure to educational oppor- tunities in formal and non-formal group settings, pre-primary and preschool, family and community-based programs (Bowman, Donovan, & Burns, 2001; Zigler, Gilliam, & Jones, 2006) as increased participation of the family and wider community facili- tates early childhood development. Participation in such quality early learning and development programs has been linked with improved child development outcomes (Murphy & Burns, 2002). The period from 6 to 8 or 9 years is normally the transition to school, a time when group learning and socialization opportunities are likely to be highly effective 8 (Montie, Xiang, & Schweinhart, 2006; Vogler, Crivello, & Woodhead, 2008). Research
  • 10.
    has indicated thatdevelopment during this phase, sometimes termed as school readiness, is linked to learning, school completion, later skill development, and ac- quisition of academic competencies and non-academic success (Arnold, 2004; Ja- ramillo & Tietjen, 2001; Coordinators’ Notebook 2008; Kagitcibasi, Sunar, & Bekman 2001; Pianta & McCoy, 1997; Reynolds, 2000; Rouse, Brooks-Gunn, & Mclanahan, 2005). Human capital is created through a strong foundational start. Children who enter school ‘ready to learn’ are more likely to succeed at school, stay in school, and achieve life-long learning and productivity in later adulthood. In addition to families and communities, schools play a major role (Connell & Prinz, 2002), as the three pil- lars of school readiness are; ready children, ready families and communities, and ready schools (Britto, 2010). The crucial role of schools as the fundamental context for learning and devel- opment is widely recognized. However, this development is especially vulnerable to adversity and risk during this critical window of time, such as exposure to disease and toxins in the environment as well as accidents and injuries (Morgan, Garavan, Smith, Driscoll, Levitsky, & Strupp, 2001; Rodier, 2004). Environments can potential- ly pervert development, often inalterably. Based on this scientific evidence of ECD, initiatives attempting to improve young child well-being should provide opportunities in environments in which all children, in the target population, are able to develop to their fullest potential. Early child development does not take place in a vacuum; the context is an important determinant of children’s development and achievement of developmental potential. Several conceptual models posit factors and influences on early human development. While each has merit in its own right, we present an amalgamation of these models, given the purpose of developing a holistic approach to ECD. From the rights-based socio-ecological perspective, children require supportive, nurtur- ing, and stimulating environments, contexts and conditions in order to promote and foster development (McCartney & Phillips, 2006). The support and promotion of ECD occurs in the context of viable systems, with respect to provision of education, health, protection, and social services (Britto, Cerezo, & Ogbunugafor, 2008). From a Rights perspective, within the framework of the Convention on the Rights of a Child (CRC), a focus on ECD should take into consideration the fulfillment of chil- dren’s rights to survival, development, participation, and protection (Britto, 2002). For the ECD approach in Kosovo this translates into ensuring that policies accommodate for the right of all children to survive and be healthy, to develop to their fullest poten- tial in a holistic way across all domains of development, to be able to participate in their environment as agents-of-change, and be protected from abuse, neglect, and forms of disadvantage and vulnerabilities. In addition, this literature establishes links to other policy alternatives to create an “enabling environment” for the duty bearers to accomplish their tasks towards young children (World Bank, 2006). The condi- tions of optimal development are created by the adult population. The most proximal adults are the key caregivers and families who create environments conducive for optimal development (Bornstein, 2006; Vygotsky, 1998). At more distal levels are the members of the community who provide support through programs and services to create these environments conducive for development. Situated at the most distal levels are policy makers who create the policy and legislative structure that indirectly impact environments for children (Hodgkin & Newell, 2007). Therefore, all levels of duty bearers are important in creating an integrated and enabling environment for ECD to ensure the survival, development and well-being of all young children. 9
  • 11.
    STUDY OVERVIEW The aim of the study was to analyze programs and policies in Kosovo to under- stand how to improve outcomes for young children in keeping with their Rights and to their full potential. The findings of the study are used to generate program and policy recommendations for ECD in Kosovo. In this section, we describe the meth- ods and the structure of this report. Methodology To ensure the sustainability and implementability of policy and program recom- mendations, it is important that they are based on the analysis of relevant services, programs, policy frameworks and indicators. Therefore the study methodology was designed to ensure a systematic review and comprehensive analysis of currently existing programs and policies. Data Collection The main types of data collected consisted of the following: documents, mul- tiple statistical sources (including international sources), and in-person interviews. Documents that address ECD, through direct and/or indirect provisions, were reviewed. These documents included laws, strategies, regulations, program evalua- tions, and situation analyses. The documents addressed the key sectors that work with young children and families in Kosovo – namely education, health, and protec- tion (Appendix I, Matrix 1). Documents were made available through UNICEF Ko- sovo. In-person interviews were conducted with the following relevant partners and stakeholders: UNICEF Kosovo: Mr. Johannes Wedenig (Head of Office), Mr. Luciano Calestini (Deputy Head of Office), Ms. Aferdita Spahiu (Education Specialist), Ms. Kozeta Ima- mi (Education Project Officer, Education Unit), Ms. Arijeta Gjikolli (Program Assistant), Ms. Ivana Milosavljevic (Education Field Office, Zvecan), Dr. Agron Gashi (Health and Nutrition Specialist), Ms. Laura Fragiacomo (Child Protection Specialist), Ms. Beate Dastel (Monitoring and Evaluation Officer) MEST: Mr. Berdyna (MEST Head of development of the Pre –University Educa- tion) and Mr. Istogu (Head of Administration of the Pre-University Education), Mr. Hki Sfisha (MEST Director of Finance) Ms. Laberi Luzha and Ms. Merita Shala (MEST/ Preschool sector), Remzi Salihu (Municipal Education Directorate, Director of Munici- pal Education) MoH: Ms. Merita Vuthaj (MoH /Mother, Child and Reproductive Health Officer) and Mr. Ilir Begolli (representative of Institute of Public Health) MLSW: Ms. Nazmije Krasniqi (MLSW/Human Rights Coordinator) 10
  • 12.
    Organizations, institutes andNGOs: Save the Children, Kosovo Education Center/KEC-Step By Step, Balkan Sunflowers. Visits and interviews were conducted on the following sites: Public Kin- dergartens in Zvecan and Prishtina (Director and Educators), a Community-Based ECE Center in rural Shkanaj (Educators), Prishtina City Hospital, Labor and Delivery (Hospital Director and neonatal nurses) Table 1. List of agencies and data sources Agency/data source Action Against Hunger Balkan Sunflower European Commission Liaison Office to Kosovo (ECLO) Global Finance (gfmag.com) Government of Kosovo HMO-solutions Kosovo Institute of Public Health Ministry of Science, Education and Technology (MEST) Statistical Office of Kosovo TransMonee Database UN Interim Administration Mission in Kosovo (UNMIK) UNDP UNDP Kosovo UNESCO Institute for Statistics UNICEF UNICEF Kosovo United Nations Kosovo Team World Bank World Health Organization World Health Statistics Data Analysis The goal of the study is to understand the situation of ECD programs and poli- cies in Kosovo and to generate policy and program recommendations in this report. In order to achieve that goal, the set of selected documents, data sources and inter- view data were analyzed jointly. 1. Situation analysis of national socio-economic profile, programs and state of young children. As previously stated, the development of children takes place within concrete contexts. Therefore, the first set of analyses examined the multiple layers of the social and economic contexts in Kosovo. Furthermore, it is im- portant to understand programs and services as components of the context. There- fore, the analysis focused partly on access to programs and services. The final type of situation analysis was the examination of multiple indicators of child, family, and population well-being. Cumulatively, these analyses provide evidence for areas of need and priorities for child health, development, protection and participation, and they also describe the context in which these needs can be fulfilled. 2. Policy architecture analysis. The second set of analyses were undertaken to understand the major statements and actors in policy making and provision for 11
  • 13.
    ECD in Kosovo.This analysis involved a mapping of the main documents, name- ly laws, strategies, regulations, and statements. Content analytic techniques were used to extract information on purpose, goals, governance, finance, and implemen- tation dimensions of these documents. The content analytic techniques allow for an examination of inter-relationships between documents and overlaps, and gaps in areas essential for holistic ECD. Reporting of Results and Structure of the Report The report is presented in 3 parts with the 1st two parts presenting the results of the study. Part 1 presents the results on the situation of children with respect to the social, economic, political, and cultural context. Particular attention is given to child health, education, and protection outcomes as dimensions of ECD. The emphasis in Part 1 of the report is to build a case for ECD by presenting the situation of children, families, and services in Kosovo. Part 2 of the report presents the results of the analysis of the social policy landscape. The strongest and most meaningful actions to address social problems in a country are through policies and legal frameworks. Therefore, Part 2 of this report presents the results of the review of this landscape in Kosovo to understand how the policies are addressing the ECD situation. Part 3 of the report, based on the findings of parts 1 and 2, provides recommendations to ad- dress the gap between the situation of children and the policy response. The aim of Part 3 is to highlight and prioritize policy and programmatic actions that Kosovo can undertake to improve the situation of young children within the existing context. The sets of recommendations, in addition to drawing on the situation analyses presented in Parts 1 and 2, also draws upon the general scientific literature and programmatic and policy evidence on ECD. Also presented in Part 3 are very initial and preliminary cost estimates of the programmatic ECD recommendations. These estimates pro- vide a preliminary indication of the costs involved in scaling up the ECD centers and introducing parenting programs. 12
  • 14.
  • 15.
    Introduction PART 1 SITUATIONANALYSIS Part 1 of the document focuses on the circumstances in which Kosovar chil- dren grow up today. The aim of this report is to make recommendations to enhance the way children in Kosovo develop during the early years. For this purpose, it is important to have a comprehensive understanding of the current state of the social, economic and demographic context and of the state of the children. In principle, children’s living conditions can be divided into three main catego- ries. The first category consists of socio-geographic conditions that are linked with inequity in child outcomes and can be improved by policies. Included in this cat- egory is Kosovo’s ethno-cultural and geographic background. The second category consists of contextual factors that are influenced by government policies. However, policies are typically not viewed as part of an ECD policy framework. For example, pollution or poor air quality has a negative impact on children’s health, but it is through environmental policy rather than through ECD policy that a government addresses it. The third and last category focuses on contextual characteristics, most directly associated with ECD policy in that they directly affect young children’s growth, learn- ing, and development. Part 1 of the report is broadly structured along the lines of the three categories above. Chapter 1 presents an analysis of the people in Kosovo, their demographic profile, composition, migration, and the geopolitical background. Chapter 2 provides an overview of the economic development and financial situation, thereby, also ex- ploring the scope for enhanced investment in ECD. Chapter 3 addresses poverty, with a particular focus on the nature and distribution of poverty and the social protec- tion instruments aimed at alleviating it. Chapter 4 focuses on the health status of the Kosovar people and children in particular, as well as the quality of and the access to health services. Chapter 5 examines the contexts and conditions for early learning and education. We preface Part 1 of the report with two notes. First, it is assumed that the read- ership of this report is comprised primarily of Kosovar citizens. Therefore, the report does not go into detail about topics that are well known to people living in Kosovo. Second, as the monitoring and statistical system is weak in Kosovo (Commission of the European Communities, 2009:22), data were limited and the available data are not always uncontested. Despite these limitations, the authors decided to use the available data to compile this situation analysis, as it is expected that the margins of uncertainty are not sufficiently significant to invalidate the analyses. 14
  • 16.
    ­­­­­­Chapter 1: ThePeople PART 1 SITUATION ANALYSIS The demographic profile of Kosovo, with respect to age composition and the expected number of annual newborns, is examined, followed by a focus on ethnic communities1 and the rural population (United Nations Kosovo Team, 2008:8). The rationale for the age examination is inherent to the nature of this report, i.e., ECD, which is a focus on age of human development. The focus on ethnic and rural com- munities is important from an exclusion and equity perspective, as those populations are the most disadvantaged. The latest estimation of the population of Kosovo is 1,733,872. It is a relatively young population with almost 30% below age 15 and less than 7% above age 65 (figure 1). Males (boys and men) are graphed on the left and females (girls and wom- en) on the right. Each bar represents five age cohorts (0-5, 5-10, et cetera) with the youngest, most relevant to this report, at the bottom. Figure 1. Demographic profile of Kosovo for 2011 Gender Male Female 100+ 6.5% 7.3% 100+ 95-99 95-99 90-94 90-94 85-89 85-89 80-84 80-84 75-79 75-79 70-74 70-74 65-69 65-69 Age Groups Age Groups 60-64 60-64 55-59 55-59 65.4% 50-54 50-54 64.4% 45-49 45-49 40-44 40-44 35-39 35-39 30-34 30-34 25-29 25-29 20-24 20-24 15-19 15-19 10-14 10-14 5-9 5-9 0-4 29.9% 27.2% 0-4 1,200 1,000 800 600 400 200 200 400 600 800 1,000 1,200 Count Source: Demographic, Social, and Reproductive Health Survey in Kosovo, November 2009 1 The term “ethnic communities” is the official terminology for ethnic minorities such as the Roma, the Ashkali and the Egyptians. Using this terminology, this report is in keeping with the Kosovo Constitution and the Law on the Protection and Promotion of the Rights of Communities and their Members in Kosovo (March 2008). 15
  • 17.
    Figure 1 showsthat, before the transition years, Kosovo’s demographic profile had the traditional shape of a pyramid with relatively high birth rates, i.e., children born during the transition years are young adults now. The present generation of PART 1 SITUATION ANALYSIS 20-25 years old is the largest and is entering the labor market during a time period when the demand for labor is insufficient to absorb the large labor force supply, thereby creating a glut. However, it should also be noted that given the relatively smaller number of children entering the school system, compared to the previous decades, the Kosovar education system may now have financial resources freed up to invest in the quality of education. This provides a window of opportunity to close the enrolment gap in preschool education because presently fewer children need to be educated (we return to this point later in the report). The annual number of births is an important indicator because it predicts the demand for ECD services in the coming years. This indicator is likely to rise in the near future because most births take place when parents are between 25 and 30 years of age (Statistical Office of Kosovo, 2008a: 16), which is Kosovo’s largest age bracket. However, beyond this small birth-wave, it is hypothesized that there will be a decrease in the number of newborns from 2015 onwards, as the number of citizens in the most fertile age range will drop sharply. Figure 2 shows the development of the annual number of births throughout the last three decades, as evidence for the hypothesized size of the future ECD age cohort. Figure 2. Number of births in Kosovo, 1981-2007 60000 50000 40000 30000 20000 10000 0 1981 1982 1983 1984 1985 1986 1987 1988 1989 1990 1991 1992 1993 1994 1995 1996 1997 1998 1999 2000 2001 2002 2003 2004 2005 2006 2007 2008 2009 Source: Statistical Office of Kosovo (2008b), except the figure for 2009 which was found in the Statistical Office of Kosovo (2010a:16) The overall trend in figure 2 is downward, but the indicator could be considered potentially unstable, adding a dimension of uncertainty to hypothesized population projections. The two major events in the recent past – the transition years and the war – have left their mark on the development of the number of births, which dropped sharply between 1990 and 1991, recovered slightly until 1996, and showed a steady decline until 2003. The emigration rate peaked in 1998 and 1999 at 15.0% and 9.6%, respectively, after a long period of very moderate emigration and even a few years of net immigration (1992-1994). Since 2004, emigration has been in the order of 0.7% to 0.8%. On the assumption that no major disruptive events will take place 16
  • 18.
    in the comingdecade, and taking into account that beyond 2015, the number of young families will be lower than it is today (see figure 1). Based on these demo- graphic trends, it is hypothesized that the annual number of live births will eventually PART 1 SITUATION ANALYSIS stabilize at a level slightly lower than the present one, e.g. at 32,000. The ethnic composition of the population of Kosovo is provided in figure 3, using two sources of data. The blue bars represent data from the Statistical Office while the red bars represent data from the Ministry of Education, Science and Tech- nology (MEST). Figure 3. Ethnic composition of Kosovo, 2010 100 90 80 70 60 50 40 30 20 10 0 Albanian Serb Other Source: Statistical Office of Kosovo (homepage of website, January 2011) and MEST (2010:15) The category “other” comprises a number of small minorities, of which some are known to be significantly disadvantaged. A further breakdown of this category was found for the number of live births in 2009. This indicator is relevant for the purpose of this report because the number of births predicts the demand for ECD services more precisely than the number of citizens of any age (which is the indicator of figure 3). Figure 4 shows this ethnic distribution of live births. The data must be treated with caution, as many births are not registered, especially among the Roma, Ashkali and Egyptian, and Serb communities. 17
  • 19.
    Figure 4. Livebirths by ethnicity, 2009 100 PART 1 SITUATION ANALYSIS 90 80 70 60 50 40 30 20 10 0 Albanian Serb Turk Bosnian RAE Other Source: Statistical Office of Kosovo (2010a:20) At 0.1% the number of births in Serb communities is inexplicably low according to these data. The Roma, Ashkali and Egyptian group (0.7%) is also smaller than expected. Given that reliability of these estimates is to be established, an alternative approach to the estimated ethnic composition was completed by MEST (2010:16) in which enrolment figures in pre-university education were broken down by ethnicity (figure 5). This alternative method validates the estimates presented in figure 3 for the Albanian and Serb school population. However, it should be noted that the indicator estimates in figure 5 are also slightly problematic as the enrolment rates to education are not universal. As is demonstrated later in the report, the lack of universal enrol- ment is linked with some children missing preschool and primary school, and others dropping out before the age of 18. Additionally, these patterns of non-enrolment and dropout are not equally divided across the eight groups in figure 5. Taking into consideration these patterns, it can be estimated that Roma, Ashkali and Egyptian comprise 2%2 of the school age population. 2 More precisely: their shares are 0.3%, 1.1%, and 0.4%, respectively, which adds up to 1.8%, but it is widely known that educational exclusion at all levels is more common in this group than among the majority population. Hence, we round off to 2%. To test this estimation, it has been compared with older data from the Statistical Office of Kosovo (2008b:8). These data show that after a very steady increase between 1961 and 1991, the Roma population halved from 46,000 to 23,000 between 1991 and 2006, while the overall population continued to grow (ibidem, page 6). Within a total population of 2.2 million, the 23,000 Roma would represent a share of slightly less than 1%. This largely exceeds the 0.3% share of the school population in figure 5, and the difference can perhaps not fully be accounted for by the educational exclusion that biases that figure. However, the discrepancy may well be because older data of the Statistical Office do not report separate data for Ashkali and Egyptian, and that these have 18 possibly been included in the category Roma.
  • 20.
    Figure 5. Children0-18 in Pre-University education in Kosovo, 2010 100 PART 1 SITUATION ANALYSIS 90 80 70 60 50 40 30 20 10 0 Albanian Serb Bosnian Ashkali Roma Turkish Egyptian Gorani Source: MEST (2010:16) Finally, it is important to note that since 2001, the share of the Roma popula- tion in the total number of births - according to a publication by the Statistical Office (2010:14) - has by and large been equal to their share in the total population (ibidem 8). In other words, the birth rate is roughly the same as for the majority population, which suggests that the share of Roma (and Ashkali and Egyptian) children of school age is not likely to increase or decrease significantly in the near future. Together, the trends suggest that the size of the severely excluded ethnic groups in Kosovo is relatively small. This implies that achieving equity requires more specific, intense and very targeted interventions that can be made possible through political will and improving parents’ knowledge and attitude towards schooling. Achieving equity does not require the mobilization of substantial financial resources or over- coming major technical barriers. Furthermore, great inequity is noted between rural and urban populations in Ko- sovo. Unfortunately, official figures on the percentage of the population living in rural areas could not be found3. The Statistical Office does publish breakdowns by munici- pality and, although some of the municipalities are predominantly rural, some of their inhabitants live in small towns. Vice versa, some predominantly urban municipalities may be home to people in rural settings. Therefore, the breakdown by municipal- ity cannot be the basis for a good estimation of the rural share of the population. Despite the limitation on available disaggregated data, certain conclusions can be drawn. In 2003, the UNMIK (2003:183) reported enormous uncontrolled migration from rural to urban areas due to unemployment and lack of economic perspective. The same source estimated the share of the rural population at 60% (page 8) or 60- 65% (page 166). More recent sources report the same 60%4, so it can be concluded that the massive rural to urban migration has slowed down or even ended. Further- more, the average number of children per family does not vary dramatically across the municipalities (Statistical Office of Kosovo, 2008a:52), which is another reason to 3 A new Census, to be conducted in 2011, is likely to provide more clarity. 4 See for example, UNDP Kosovo homepage, accessed in January 2011. 19
  • 21.
    assume that therural share of the total population may continue to be around 60% in the future5. What has not remained stable, however, is the share of rural people in poverty nationwide. Table 2 shows that in 2005/2006, no less than 81% of poor PART 1 SITUATION ANALYSIS people in Kosovo lived in rural areas, against 58% only three years earlier. Table 2. Trend in poverty by location in Kosovo, 2002-2006 2002/03 2003/04 2004/05 2005/06 Rural 57.8 66.1 69.5 70.9 Urban 42.2 33.9 30.5 29.1 Total 100 100 100 100 Source: Copied from World Bank (2007:45) Table 2 suggests that poverty is experienced by a significantly large percentage of rural compared to urban families, almost in a 2:1 ratio. It should be noted that even though geographic location appears to drive the poverty status, poverty, rural geographic location, and ethnic identity are confounded. Therefore, all three dimen- sions are accorded attention in this report. 5 It could be the case that two trends have more or less neutralized one another in the past decade: some degree of rural-to-urban migration versus somewhat higher fertility levels in the rural areas. Another possibility is that internal re-migration, from towns and cities back to rural areas, is picking up as a result of the financial crisis. E,g., in Kyrgyzstan, increasing numbers of people manage better to survive unemployed in rural areas – where family and informal networks back them up - than unemployed in urban areas (van Ravens, 2010). This trend does, however, contribute to rural poverty and could (partly) explain the increase in rural poverty shown in table 2. In any case, the fact that the figure of 60% (the rural share of the Kosovar population) seems rather stable, may conceal various trends that partly compensate one another. This makes it difficult to predict the demand for (financial support to) 20 ECD services.
  • 22.
    Chapter 2: Economyand PART 1 SITUATION ANALYSIS State Finance The guiding question for this chapter is, “will Kosovo be able to finance a sub- stantial expansion and improvement of child services?” For a general assessment of the financial possibilities of the state and citizens of Kosovo, economic growth is examined. The annual increase, or decrease, of the Gross Domestic Product (GDP) largely determines the income of citizens and it forms the basis from which the gov- ernment can draw resources for public expenditure through taxation. Figure 6 shows the development of GDP growth over the past decade. Figure 6. GDP growth in Kosovo, 2002-2011 7 6 5 4 3 2 1 0 -1 2002 2003 2004 2005 2006 2007 2008 2009 2010 2011 Sources: World Bank (2007:2) for 2002-2006, and Global Finance website (www.gfmag.com) for 2007-2011. Note: The figure for 2010 is an estimate and the figure for 2011, a projection. In the first years of the decade growth was negative on average (figure 6). This was a sharp fallback after very high growth figures (of over 20%) in 2000 and 2001, re- sulting from massive donor investment. The positive trend over 2006-2011 is mainly due to another external factor: remittances sent by Kosovar people working abroad in other European countries and regions of the world. The industrial and agricultural sectors used to be the growth engines of Kosovo, but 10 years after the war, their contribution to GDP growth has still not risen to previous levels (World Bank, 2007). Instead, human labor is the main export product of Kosovo and this is likely to be a dominant contributor to the economy and society of Kosovo for years to come. It is hypothesized that for the growing generation of young children, this trend may make it difficult to identify with a nation where wealth seems to come mainly from outside, and where absent people (e.g., the “uncle in Germany”) serve as role models. For the purposes of this report, and based on the trend in GDP over the past decade, an average growth rate of 5% is estimated. This estimate is in keeping with the level of growth over the last five years shown in figure 6, and it is slightly more conservative than the official forecast used in the Midterm Expenditures Framework 21
  • 23.
    2010-2012 (Government ofKosovo, 2009:30). More volatile than growth, however, is inflation. High in 2008, negative in 2009 and moderate in 2010 (www.gfmag.com, accessed January 2011), the inflation rate makes it difficult to predict the purchasing PART 1 SITUATION ANALYSIS power of citizens and state of Kosovo. The next question is: what share of the GDP will be available for public expendi- ture? The answer to this question lies in the scope and commitment for enhanced in- vestment in child services. In 2006 and 2007, the Government’s revenues exceeded expenditures substantially, while Kosovo broke even in 2008 (UNDP, forthcoming, chapter 2). But for 2009 and 2010, a budget deficit is estimated in the order of 10% (Government of Kosovo, 2009:13), due to increased public expenditure both in sala- ries and capital investment. The Midterm Expenditures Framework expects a return to a balance in 2011 and 2012, which could, in principle, open up possibilities for financing child services. In order to test that hypothesis, we examine specific budg- ets. As a result of Kosovo’s decentralization process, a large share of the budgets relevant to ECD – health, social welfare, education – is channeled from the Central Bank of Kosovo directly to municipalities. For example, all of the pre-university edu- cation – which includes early childhood education – is financed via the municipalities through the so-called specific grant for education. Similar specific grants exist for health and social welfare; a general grant for public administration. Table 3 shows the development of these grants over recent years and the near future. Table 3. Municipalities’ budgets for health, social welfare, and education, 2009-2012 Grants and Municipal Own Source Revenues Year 2009 Year 2010 Year 2011 Year 2012 for three years ( E mill.) General Grant 85.0 94.3 99.3 104.4 Specific Health Grant 24.3 24.8 25.4 26.1 Specific Social welfare grant 1.80 1.8 1.8 Specific Education Grant 103.6 108.5 114.0 114.0 Total Grants financing 212.9 227.6 238.8 246.3 Own Source Revenues 37.2 50.4 50.9 51.4 Total Municipal Financig fron Grants and OSR 250.1 280.4 289.8 297.7 Source: Copied from Government of Kosovo (2009:35) The data indicates that the budgets for health, social welfare, and education did not grow substantially (table 3). However, this growth is in accordance with the growth in total government spending. In fact, expressed as a percentage of total government spending, the budget for education grew more sharply between 2005 and 2007 (figure 7). Given the fact that the large age cohorts born 20-25 years ago are moving out of the education system, this could imply that spending per student increased. 22
  • 24.
    Figure 7. Sectoralbreakdown of government spending, 2005-2007 % 2005 2006 2007 30 PART 1 SITUATION ANALYSIS 24 25 20 19.6 19.4 19.3 18.8 18.6 17.7 17.9 15.7 15.5 16 16.7 15 12.3 11.3 10.410.3 10 9.4 10.3 5 2.9 2.7 2.2 2 1.5 2.2 0.9 0.8 1.3 0.1 0.2 0.3 0 General Defence Public order Economic Environ- Housing and Health Recreation Education Social public and safety Afairs mental community culture and protection services protection amenities religion Source: Copied from Government of Kosovo (2010:25) However, for reliable interpretation of government spending, it is important to compare Kosovo to other similar countries. The TransMONEE-database contains data on expenditure for countries in Central and Eastern Europe and the Common- wealth of Independent States. For a selection of these countries, figure 8 shows total health expenditure as a percentage of GDP. It should be noted that the analyses and interpretation do take into account that Kosovo has experienced more recent and greater conflict compared to some of the comparison countries, which implies that it takes a country longer to recover to stability than non-conflict countries. Notwith- standing the recent history of Kosovo, these comparisons are useful to make estima- tions and projections for future investments. Figure 8. Health expenditure as a percentage of GDP in selected countries, 2005-2008 7 2005 2006 2007 2008 6 5 4 3 2 1 0 Kosovo Albania Bosnia Croatia Montenegro Serbia TFYR Herzegovina Macedonia Sources: TransMONEE Database (www.transmonee.org) except for Kosovo: UNDP (forthcoming). Note: The indicator in figure 8 differs from that in figure 7 in that the former expresses health expenditure as a share of GDP, and the latter as a share of total government expenditure. 23
  • 25.
    Figure 8 indicatesthat compared to the other countries, Kosovo’s investment in healthcare is relatively low. All other countries, except Albania, have much higher values with health expenditure as a percentage of GDP touching upon the threshold PART 1 SITUATION ANALYSIS of 6%. West European countries, for reference, typically invest around 10% of GDP in healthcare. The fact that Kosovo is among the poorer countries in this group may not be a valid reason for the low levels of investment, as the numbers reflected in fig- ure 8 express investment as share of income, as opposed to an absolute amount. A low income would be an argument for a low absolute level of investment (expressed in euro per head of the population), but not for a low relative level. Figure 9 contains a similar comparison for the field of education. The selection of countries differs from that of figure 8 because of some missing data in the Trans- MONEE database. Figure 9. Education expenditure as a percentage of GDP in selected countries, 2005-2008 6 2005 2006 2007 2008 5 4 3 2 1 0 Kosovo Albania Serbia TFYR Slovenia Bulgaria Romania Macedonia Sources: TransMONEE Database (www.transmonee.org) and, for Kosovo, Government of Kosovo (2010:25). Note: The indicator in figure 9 differs from that in figure 7 in that the former expresses health expenditure as a share of GDP, and the latter as a share of total government expenditure. As Kosovo does not appear as such in the TransMONEE database, its values in figure 7 have been used instead. These have been converted to match those of the other countries. Investment in education (figure 9) appears to be higher than investment in health (figure 8) for Kosovo compared to other countries. In particular, compared to border- ing countries, Kosovo performs well and shows a modest increase. A bigger gap exists between Slovenia, Bulgaria, and Romania, each of which are close to or above the OECD average of 5.3% (2006). The better performance in education compared to health can be explained by differences in age composition. With its relatively young population, Kosovo is bound to spend more on education than countries with aging populations; the latter are more likely to spend more on health. For social protection, the TransMONEE database does not provide for suitable comparative investment data. Therefore, figure 10 is drawn from a recent UNICEF report on Child Poverty (UNICEF Kosovo, 2010:9). 24
  • 26.
    Figure 10. Spendingon Social Protection in Kosovo and Selected Countries, 2008 20 A. Spending on Social Protection PART 1 SITUATION ANALYSIS 18 17.2 17.5 16 15.0 14 13.2 12 10 9.7 8.3 8 7.1 6.2 6 4 2 0 0.4 0.9 1.3 1.4 0.3 0.1 1.7 2.5 Albania BiH Kosovo Macedonia Montenegro Serbia ECA OECD evarage average Social Assistance Program Other Social Protection Source: Copied from UNICEF Kosovo (2010:9). Original source: Gueoruieva. A. (2008). Note: The indicator in figure 10 differs from that in figure 7 in that the former expresses health expenditure as a share of GDP, and the latter as a share of total government expenditure. Kosovo has the lowest level of spending on social protection of these countries (figure 10). At the same time, the share of social assistance within total spending on social protection is the highest, which most probably reflects the high incidence of poverty on the one hand, and the low spending on more structural forms of social assistance on the other hand (e.g. Kosovo has no child benefit system). In the next chapters, social protection, health and education are discussed in greater detail. 25
  • 27.
    Chapter 3: Povertyand PART 1 SITUATION ANALYSIS Social Protection One of the fundamental questions regarding mitigating the negative impact of poverty is the poverty reduction approach. Reactive policies, while attempting to reduce poverty, tend to spend funds on alleviating the negative impacts of poverty. However, more proactive approaches also concerned with reducing toxic poverty im- pact focus more on investments that reap dividends over the long term. The European Commission (Commission of the European Communities, 2008) clearly states that Member States, which spend higher proportions of their GDP on social protection (ex- cluding pensions), tend to have the lowest child poverty rates. The Commission also notes (i) that social assistance benefits that are specially targeted at children – rather than at families or adult family members – have the strongest impact on child poverty, and (ii) affordable childcare makes a big difference in granting parents access to labor markets (and thus tackling in part the causes of poverty). Based on the principle that higher spending is associated with lower poverty levels, and the results reported in figure 10, this chapter explores poverty and social protection in the Kosovo context. In an international comparison on poverty, the World Bank (2010) found that close to 40% of all Kosovar people live on less than 2.50 US$ per day6. In Albania this number is about 15%, Macedonia and Montenegro 10%, Serbia 2%, and Bosnia and Herzegovina 3%. These estimates suggest that attention to the issue of poverty and change in the strategies to address it is urgently needed. A recent study com- missioned by UNICEF (Child Poverty in Kosovo, 2010) has developed comprehensive policy options to expand and improve Kosovo’s system of social protection. This chapter builds on the UNICEF study, a poverty assessment conducted by the World Bank, and other accessible documents. However, prior to presenting an analysis of the situation, the chapter begins with a mapping of poverty in Kosovo. Normally, the key driving force to poverty alleviation is economic growth. Further- more, the development of the average income of the citizens, or per capita GDP, is a strong indicator of growth. Figure 11 shows per capita GDP in Kosovo over the past decade, including projections for 2011 and 2012. Figure 11. Per capita GDP in Kosovo in €, 2003-2012 2500 2000 1500 1000 500 0 2003-2005 2006 2007 2008 2009 2010 2011 2012 Sources. The figures for 2003-2010 are from UNDP (forthcoming). Those for 2011-2012 are projections by the IMF (http://www.imf.org/external/np/ms/2009/062409.htm) 26 6 Different poverty rates for Kosovo (and other countries) can be found in different studies. This is due to different definitions and thresholds that are in use for “poverty” and “extreme poverty”.
  • 28.
    Kosovo’s per capitaGDP is low compared to other countries: that of Albania is twice as high and that of Macedonia almost thrice as high, while the gap with other countries in the region is even larger7. However, a very steady upward trend in per PART 1 SITUATION ANALYSIS capita GDP can be observed (figure 11). This increase is predicted to be associated with a steady reduction in poverty levels. In order to test this prediction, the con- struction of a trend-line for poverty in Kosovo was attempted. However, because data for multiple years came from different sources, the generation of a trend line was not possible. An alternative approach to assessing poverty trends is the World Bank’s poverty assessment (2007), which uses data from household surveys held in 2003/2004 and in 2005/2006. These data show a small but clear increase in poverty in the intermediate period of two years, even more so for extreme poverty compared to more moderate poverty (World Bank, 2007:10). This small increase, however, conceals an area of concern: rural poverty had risen sharply by 5 percent points from 44.2% to 49.2% in the two-year interval be- tween the two surveys, while urban poverty had dropped by almost the same 5 percent points, from 42.1% to 37.4% (World Bank, 2007:21). This result could be explained by the fact that the rural population is higher than the urban population; the two opposite trends result on balance in a moderate upward trend at the central level. Another finding that is contrary to predictions in trends is that poverty, for those who are employed, has slightly risen while the number of poor people among the unemployed slightly dropped (though it remained higher than that of the employed; World Bank, 2007: iii). This counterintuitive finding suggests that the working poor are facing decreasing salaries (taking inflation into account) and/or decreasing profits from enterprises and farming, while many of the unemployed may have benefited from increasing remittances and/or social benefits. Despite the possible explana- tions, the case remains that the relationship between poverty in Kosovo and eco- nomic efforts is complex in that growth of per capita GDP does not spill over to all citizens, as expected. The unique combination of a rising average income and rising poverty levels in rural areas can only be addressed through income policy. This area of policy is usu- ally not seen as part of ECD policy, and it certainly is beyond the scope of this report. Yet, an equitable distribution of income is critical in attacking child poverty, which is urgently needed as table 4 shows. The table distinguishes three poverty lines8: ■■ The food or extreme poverty line. This is the most severe criterion. People un- der this threshold live on €0.93 per day or less. ■■ The absolute poverty line. In this larger group, people spend €1.42 per day or less. ■■ The international comparison rate. Spending up to $2.15 per day (about €1.58), this is the largest group. 7 Kosovo is not always included in international datasets. Therefore, comparisons with other countries - based on similarly defined indicators and similarly collected data – are scarce. The findings reported in the text are from the so-called CIA-factbook, which does allow such a comparison. These data were found on: http://en.wikipedia.org/wiki/List_of_sovereign_states_in_Europe_by_ GDP_(nominal)_per_capita. 8 Even more definitions of poverty exist, which explains why very different poverty rates can be found for Kosovo at the same moment in time. 27
  • 29.
    Table 4. Povertyrates in Kosovo according to various definitions, 2006-2007 Childless Households General Population Children Households with Children PART 1 SITUATION ANALYSIS Food/Extreme 17.5% 18.9% 18.0% 17.3% poverty line Absolute 46.2% 48.6% 38.3% 45.3% Poverty Line 2.15 a day 62.3% 65.4% 49.4% 60.8% Poverty Line Source: Copied from UNICEF (2010:21) Judging by the absolute poverty line – the most current – almost half of the population of Kosovo is poor, and within this group, 17.5% live in extreme poverty. Table 4 also shows that the figures for children are worse than for the general popu- lation, in that households with children are poorer than those without (except for the extreme poverty line where the two are nearly equal). It should be noted that pov- erty amongst Roma Ashkali and Egyptian communities is substantially higher than the average, while the Turkish, Bosnian and especially the Serb communities, fare better than the average (UNDP, forthcoming). Compared to neighboring countries, Kosovo’s poverty rates are by and large twice as high (UNDP, forthcoming). The association between poverty and child well-being, however, is also com- plex. Access to potable water and sanitation is very important to children’s health. Many families in Kosovo are deprived from these essential utility services, with the difference between rich and poor being small: 42% of the poorer families and 36% of the richer families9 lack these services (UNDP, forthcoming). This small difference suggests that income policy and social protection alone are not enough to enhance child well-being, and that Kosovo is in need of more policy interventions aimed at expanding the coverage of utility services, especially in rural areas where coverage is referred to as “substantially lower” by the UNDP (forthcoming). These results lead to the next set of questions aimed at understanding the in- struments that Kosovo needs, in order to address poverty and exclusion from goods and services. The palette is incomplete: a child benefit scheme and unemployment benefits are lacking, while paid maternity leave was recently implemented in the pub- lic sector but has not yet reached the private sector. In place are a social assistance scheme, a pension scheme, and several more specific schemes for people affected by war and disability. The social assistance scheme has a category 1 for poor fami- lies with no access to the labor market, and a category 2 for such families also having a child below the age of five or an orphan below fifteen (UNICEF, 2010:8). Since a raise in 2009, the monthly rates are €40 for a single adult, €55 for a couple, and €5 extra for every child (with a ceiling of €80) (UNICEF, 2010:8). By comparison, the sal- ary of a nurse is €180 per month on average. The World Bank found that the rates tend to insufficiently follow changes in price levels (2007:28). An important innova- tion is the specific assistance of €100 per month for families with disabled children (0-18), introduced in 2009. Some allowances come with additional benefits such as free healthcare10, reduced electricity prices, and compensation for fees paid for 9 In this case, the criterion for being rich or poor is; having/lacking “basic goods and services” as defined in the Kosovo Mosaic Survey of UNDP. 10 Essentially, healthcare is free in Kosovo, but small payments must be made for each visit (see next chapter). These are waived for people on social assistance. In addition, there are hardly any medicines available at the healthcare facilities, thus in most cases, 28 the patients need to secure all the medicines and other medical supplies by themselves.
  • 30.
    higher education. Feecompensation for preschool is not among these benefits, but it would be a feasible option. A problem of the social assistance scheme is that it fails to reach many poor PART 1 SITUATION ANALYSIS people, whereas it does reach some richer people who are not entitled to it. Figure 12 shows the under-coverage of the social assistance scheme, which consists of the number of people who should receive it but do not. In 2005/2006, this stands at 77% of the poor people. In other words, only 23% really receive the benefit. Of the extremely poor, 65.7% are not covered and only 34.2% receive the benefit. Be- tween 2003/2004 and 2005/2006, the degree of under-coverage decreased slightly, but what increased was leakage: the transfer of benefits to those who do not need it. 29
  • 31.
    Figure 12. Under-coverageand leakage in the social assistance scheme, 2003-2006 80 79.3 PART 1 SITUATION ANALYSIS 77.0 66.9 65.9 60 Leakage to the non-poor 40 20 21.8 19.5 0 Poor Extreme Poor Non-poor 2003/04 2005/06 Source: Copied from World Bank, 2007:31 The combined effect of low coverage and low rates leads to a very small impact of the social assistance scheme. The World Bank estimates that the current social assistance instruments reduce poverty by only 2%; even the pension scheme has a higher impact, at 4% (World Bank, 2007:30). Several proposals have recently been developed to enhance the impact of social assistance, e.g. by Gassman and Roelen (2009) and in the Child Poverty report of UNICEF (2010). Linked with poverty, but an issue of its own merit and consideration, is the problem of abandonment, abuse, and neglect of children11. Both in 2008 and 2009, the total number of abandoned, abused and neglected children in Kosovo was 66 (Statistical Office of Kosovo, 2009:23). Though this figure is difficult to benchmark internationally, it does not seem to be exceptionally high. Kosovo’s infrastructure for abandoned, abused and/or neglected children appears adequate with at least one Center for Social Welfare in (almost) every municipality. Children are referred within 24 hours, based on the established criteria. The interview data, however, suggest the following bottleneck: children who are recently abandoned find their first shelter in a hospital, and their stay there tends to be longer than desirable. Beyond this stage, Kosovo has a network of 40 families who are well prepared to foster children. In exchange, these families receive a fee of €150 per child per month. There is broad consensus that such a network is much better than the in- stitutionalization of children which used to be the dominant modality in countries in Eastern Europe. Social Protection, in general, is decentralized to the municipal level, which receives funding through a dedicated “specific grant”. The role of the Ministry of Labor and Social Welfare is to develop policy, to set and maintain standards, and to monitor. Within each Center for Social Welfare there is a Child Protection Unit. These are not yet formalized, but a foreseen revision of the Family Law in 2012 may alter this. Other innovations are (i) the implementation of the Case Management System in 2005, where children are supported by one dedicated case manager who takes care of contacts and consultation with the more specialized professionals, and (ii) 30 11 Unless indicated otherwise, the information in the following paragraphs stem from interviews, hence the scarcity of references.
  • 32.
    the development ofseveral manuals and protocols. However, formalization of these schemes has yet to take place. The case management approach for abandoned children was adopted and PART 1 SITUATION ANALYSIS adapted from Kosovo’s juvenile justice system, where it was introduced by Terre des Hommes, a Swiss-based international NGO. In this area, too, there is the intention to mainstream the innovations after review and evaluation. Both for abandoned children and for juvenile justice, the case management ap- proach has the potential to enhance inter-sectoral collaboration. Until now, effective interaction between the fields of social protection, health, education, and justice is lacking according to all those who were interviewed on this issue for this report. The respondents noted that the system is not conducive for inter-sectoral collaboration. For the case management approach to become fruitful boundaries must be broken down and mentalities changed. A second major missing link is prevention. While a lot of attention is rightfully accorded to children who are already abandoned, abused, neglected, or at risk of becoming criminal, little is done by way of addressing the causes of these outcomes. “The system is about victims, not prevention”, as one interviewee expressed it. It should be noted that the analysis is limited at this point due to lack of data. However, in the section addressing policy frameworks, this issue is elaborated upon further. In closing, this chapter also addresses child labor. Due to poor statistical data on child labor, a thorough analysis of this child protection indicator was not possible. However, there is broad consensus that child labor is widespread in Kosovo, and that it can often be categorized as “Worst Form” and “Hazardous” (United Nations Ko- sovo Team, 2008:11). This is due partly because of economic hardship (ibidem), and to that extent it can be combated by poverty reduction strategies. Furthermore, there is a cultural component that explains the persistence of child labor (ibidem). This implies, once again, that the knowledge and attitudes of parents may be important targets to trigger change in practices. Given the lack of objective information, this report can only make the urgent recommendation to map and analyze this problem with a view to develop powerful policies to strengthen ECD practices in the society. May it be understood that the brevity of this paragraph on child labor does no justice to the gravity of the problem, further research is needed. 31
  • 33.
    Chapter 4: HealthStatus PART 1 SITUATION ANALYSIS and Healthcare The health status of children in Kosovo is an area of concern, as indicated by the data presented. Some of the causes of poor child health can be referred to as “contextual” from the perspective of the situational analysis. Environmental deg- radation12, poor waste management, rampant and irresponsible construction, and neglect of natural resources need to be urgently addressed (UNDP, forthcoming), but are typically not seen as part of ECD policy, rightly or wrongly. Likewise, limited cov- erage of safe drinking water and sanitation threatens children’s health, as noted in the preceding chapter. This is due to their limited policy association with ECD, which is not addressed comprehensively. The focus of this chapter is on the health care system as a policy intervention and the most proximal environment influencing early childhood development, namely, caregiving and parenting practices that are linked with poor child health, in particular breastfeeding practices. Causes of the problematic child health status are directly linked to the capacity of the health system. Several interviewees emphasized that funding is insufficient for proper execution of essential tasks (see also figure 8 of this report). The forthcoming Human Development Report (UNDP) adds that, the resources that are available are often not efficiently managed, thereby leading to waste. Furthermore, as explained during the interviews, while nurses earn a salary that is low by international standards (but can still compete with that of people who work at similar levels in other sectors in Kosovo), specialists have an income far below that of others with a university degree. Overburdened and under-funded, they no longer have access to international oppor- tunities for continuing their education and training through conferences and need to rely on increasingly outdated knowledge. Patients who can afford to pay fees opt out of the public health system and at- tend private institutions, in various medical disciplines and sometimes abroad (World Bank, 2008:ii). Those who opt out are rich, and probably well-educated. Their out- of-pocket spending - equaling 40% of total health spending in Kosovo (World Bank, 2008:ii) – is directed at private providers and fails to support the public health sys- tem, which is in need of committed stakeholders. The people who remain dependent on the public health system tend to be less economically and educationally advantaged, and poorly organized; interviewees see no beginning of a civil movement for better services. Ironically, the “symbolic” fees that people need to pay in the public system are too low to make a big difference for the funding of the system, but high enough to keep the poorest away from healthcare (World Bank, 2008:ii). “Unofficial payments” also limit access (World Bank, 2008:46). These financial thresholds result in low utilization rates in public primary health care centers and hospitals (World Bank, 2008:ii). Figures 13-17 underscore the situation described above. The first set of indica- tors concern the state of the children, the second the provision of healthcare. Life 32 12 Some children have more lead in their blood than instruments can measure (Mitrovica/e Institute for Health, 2008).
  • 34.
    expectancy, in figure13, is usually seen as the grand general indicator of the quality of life in a country. It should be kept in mind that it depends not only on healthcare, but also on contextual factors, healthy lifestyle and, more in particular for Kosovo, PART 1 SITUATION ANALYSIS tobacco consumption. Figure 13. Life expectancy at birth in selected countries, 2008 85 All Female Male 80 75 70 65 60 Kosovo Albania B and H Croatia Montenegro Serbia Slovenia Macedonia Eu-15 Source: World Health Statistics, 2006 except for Kosovo: Statistical Office of Kosovo, Vital Statistics Reports. Note 1: B and H stands for Bosnia and Herzegovina. Note 2: The vertical axis has been cut off at age 60. At 69 years, the life expectancy in Kosovo clearly lags behind that of nearby countries and the gap with the EU-1513 average is eleven years. Yet, there is a clear upward trend, from 67 in 2005 (UNDP, forthcoming). The UNDP notes that this is not only to be ascribed to better healthcare, but also to a more general improvement of living conditions since the War. It should be noted that Kosovo is recovering from a conflict situation and therefore, this factor should be taken into consideration when assessing the indicators in this chapter. Unfortunately, trend data are scarce for Ko- sovo, which makes it difficult to assess development over time. Child mortality is considered high and among the highest in the region. The perinatal mortality rate for 2010 is estimated to be 19.1 perinatal deaths (stillbirths plus deaths during the first week of life) per 1,000 births. Based on the reported early neonatal deaths for 2000 in Kosovo early neonatal mortality rate was 14.8 per 1000, while for 2010 it is 7.8 per 1000. According to Perinatal Situation in Kosovo 2010, perinatal mortality rate has not declined in comparison with 2009 and the perinatal mortality rate in Kosovo is still high. Infant and under-5 mortality is largely preventable with adequate nutrition and protection against disease, for example through exclusive breastfeeding, (e.g., Bart- lett, 2005; Black, Morris, & Bryce, 2003; Lopez, 2000). In Kosovo, the rate of exclu- sive breastfeeding is 16% during the first 4 months of life, and 12% over the first 6 months (Micronutrient Status Survey). Given that reduction in infant and U5 mortality is a key goal for Kosovo, for ECD, an understanding of the situation of breastfeed- ing practices is relevant. According to a study conducted by Action Against Hunger (1999) with a sample of 900 women, up to one fourth of mothers do not breastfeed 13 Note that in the data-set used here, the EU had fifteen member states, mainly in West-Europe. This was before the wave of accessions of Eastern European countries. 33
  • 35.
    in the first24 hours after birth and more than 1 in 10 mothers never14. While local health care professionals do not agree with the exact results and statistics of this study, they do support the main implication of the results, that breastfeeding and PART 1 SITUATION ANALYSIS infant feeding practices are a problem in Kosovo. Another source of information in breastfeeding suggests that only 1 in 8 infants are exclusively breastfed for the first 4 months of life and that more than a third of mothers have stopped breastfeeding completely by 6 months (UNICEF, 1997). Paradoxically, Kosovo’s cultural traditions support breastfeeding. However, the practices neither reflect the tradition nor inter- national standards of exclusive breastfeeding (Hormann, 1999). In 2009, the number of mothers who did not survive childbirth was 12. Based on population data from chapter 1, this has been converted to a value of 43.3 per 100,00015 births, so that it can be compared with values of other countries. But given the narrow statistical basis, this figure must be treated with utmost caution; such a small figure can easily halve or double within a year. Figure 14. Maternal mortality per 100,000 live births, 2005-2009 50 45 40 35 30 25 20 15 10 5 0 Kosovo Albania Croatia Serbia Slovenia Source: World Health Organization Database (data for 2000-2009), except Kosovo. Source for Kosovo: Perinatal Situation in Kosovo for 2000-2009 (2010). The figure for Kosovo is for 2009. When it comes to stunting, the numbers in Kosovo are comparable to those in Albania, but again much higher than in other nearby countries, as figure 15 shows. It can be added that even East Asia and Latin America – regions where food afford- ability is a big issue – fare better than Kosovo and Albania, with 16% of the children suffering from reduced growth. 14 While newer data might be available documenting the breastfeeding rates, these data were not accessible for the study analysis and report. 15 The absolute number of maternal deaths in 2009 was 12. Given the number of births of that year, we estimate that this equals 34 43.3 per 100,000 births.
  • 36.
    Figure 15. Moderateand severe stunting in selected countries, 2007-2009 25 PART 1 SITUATION ANALYSIS 20 15 10 5 0 Kosovo Albania B and H Croatia Montenegro Serbia Macedonia Source: UNESCO Institute for Statistics, 2007, except for Kosovo: UNICEF, Nutritional Survey Report 2010. Note: B and H stands for Bosnia and Herzegovina. These data raise the question: what can Kosovo do to improve the health status of mothers and children? Evidence suggests that increased investment in ECD, in- cluding parenting programs, might offer a solution. With respect to increased invest- ment and health spending, as was indicated by figure 8 (Chapter 2), Kosovo spends about half of the amount that other nearby countries spend on health. Figure 16 shows the development of health spending as a percentage of GDP (blue bars) and as a percentage of total government spending (red bars), over 2004-2009. Figure 16. Health spending as share of GDP and of total government spending, 2004-2009 12 As % of GDP As % of Govt. Spending 10 8 6 4 2 0 2004 2005 2006 2007 2008 2009 Source: UNDP, forthcoming Figure 16 shows that health spending is stagnant. Expressed as a percentage of GDP as well as government spending, it is even on a slightly downward trend since 2007. Although the geographical density of health facilities is still good, with most people living on a reasonable distance from a primary health center (UNDP, forthcoming), the number of personnel lags once again, far behind that of nearby countries as figure 17 shows (Sweden has been added as a reference point). Den- tists are particularly scarce. 35
  • 37.
    Figure 17. Numberof health professionals per 1000 inhabitants, selected countries, 2001-2006 12 Doctors Dentists Nurses PART 1 SITUATION ANALYSIS 10 8 6 4 2 0 Kosovo Albania B and H S and M Croatia Slovenia Sweden Source: World Health Statistics, 2006 except for Kosovo: National Institute of Public Health. Note1: The data for Kosovo are for 2006. Those for the other countries are mostly from 2002-2004. Note 2: B and H stands for Bosnia and Herzegovina. S and M stands for Serbia and Montenegro. Note 3: The red bars (dentists) of Kosovo and Albania are hardly visible; the values are 0.06 and 0.03 respectively. The last issue to be addressed in this chapter is parental education: learning and counseling activities for parents aimed at enhancing their parenting skills. Vari- ous modalities exist and can be combined: group sessions, home-visits (on a one- to-one basis), counseling of parents while in health facilities (e.g. for immunization or on other occasions), mass-media, and advocacy. Ideally, parental education cuts across the boundaries of social protection, health and education. In fact, this will be a key issue for this report’s policy analysis, gap analysis, and recommendations. Parental education can be essential for the prevention of child abuse, abandonment and neglect, which is the missing link in the field of social protection as the previous chapter emphasized. Likewise, parental education is critical for early learning and stimulation, the basis for further learning in the education system and throughout life. But empirically, parental education in Kosovo, as in many other countries in the region, is strongly health oriented. For that reason only, it is presented in the health chapter. In the previous socialist health system, the specific home-visiting scheme was implemented by the health facilities. With the introduction of the Family Medicine Concept as the health reform resulting from the Health Policy for Kosovo in 2001 the practice of home-visiting was set aside. The Family Medicine Concept, as explained by the respondents, due to many issues was never fully implemented and it will take time. The interview data suggest that on average, one doctor and two nurses cover a catchment area of 2,000 inhabitants, with the doctor as the primary contact point for patients, executing preventive as well as curative tasks. Respondents also noted that by concentrating all services in buildings, the prevention dimension to the ap- proach disappeared. The paradox of prevention is that it enhances awareness in people who may have a low initial level of awareness, but don’t realize that they need the service. They first need to be sensitized to the issues to become knowledgeable about the problems and possible services to alleviate the conditions. Thus, reach- ing out to these people requires the proximity that comes with home-visiting, and the time and familiarity that comes with field workers who are in a better position to offer services than the doctor in the Family Medicine Center. Another advantage of 36
  • 38.
    home-visiting (and othermodalities for parental education) is that it offers better op- portunities for a more integrated approach, including elements of early learning and social protection. PART 1 SITUATION ANALYSIS The main form of parental education has been through leaflets via health facili- ties, outreach activities, health workers in Family Medicine Centers, and the broad- casting of video clips. The leaflets and video clips aim to change behavior in areas such as child care and development, early child education, infectious disease, hy- giene, sanitation, nutrition, early stimulation, special needs, safe motherhood, et ce- tera. An evaluation in 2009 showed good results. The Human Development Report (UNDP, 2010) also notes that better public health information has led to improved outcomes in recent years, e.g. with regards to iodine in pregnant women and chil- dren. However, both the Human Development Report and several interviewees note that there is a case for further enhancement of public health information. Potential allies are the Red Cross as well as the health mediators, a role developed by the Soros Foundation. Expanding the range of modalities, from leaflets to mass-media, group-sessions, and home-visiting is important in order to reach those who need the service most: the ethnic minorities and the rural poor, among whom we still find many illiterate mothers unable to read the leaflets16. A legal framework and structural funding from the Ministry of Health seems imperative. And as mentioned before, broadening the content to include protection and learning would be very synergetic. 16 In rural areas, 9.5% of females aged 16-19 were found to be illiterate, and another 16.3% were weakly literate (United Nations Kosovo Team, 2008:8). 37
  • 39.
    Chapter 5: EarlyLearning PART 1 SITUATION ANALYSIS and Education The focus of this chapter is on all forms of learning during early childhood. Therefore, it addresses all activities and services that enhance holistic development, ranging from the earliest stimulation within the family (including forms of parental ed- ucation that support this) to the more formalized learning settings, such as daycare, preschool, and pre-primary education. Following the format of the social protection and health chapter, first a situation analysis of the state of the children is presented followed by evidence on the quality and coverage of the relevant services. A problem in the assessment of the state of the children when it comes to learning is that Kosovo has not yet participated in international surveys of learning achievement. The data available pertains to educational attainment with respect to diplomas, certificates, and degrees that Kosovo’s youth obtain. This is not an entirely reliable indicator because education systems differ in terms of selectivity; e.g. attaining a diploma from higher secondary education can require more learning achievement in one country than in another. Taking into consideration this difference, selected core indicators of the education system of Kosovo are presented in table 5. This table does not include preschool and preprimary education; this will be dis- cussed in-depth, hereafter. Table 5. Core indicators for Kosovo’s education system, school-year 2008-2009 Number of Gross Enrolment Survival Rate in Education Phase Compulsory Years Ratio Last Grade Primary 5 Yes 103.9 - Lower Secondary 4 Yes 114.7 91.0% Upper Secondary 3 No 81.8 53.4% Tertiary Varied No ±17 - Source: Ministry of Education Science and Technology (2008/2009:33-41) Note: The Gross Enrolment Rate for tertiary education is lacking in the above-mentioned source. The 17% is an estimate of the authors, based on the fact that 33,984 students were enrolled in 2008-2009, whereas the total population in the relevant age range is about 200,000 (see figure 1 of this report). It is a rough estimation, merely serving as a broad indication. Since a major reform in 2000/2001, Kosovo’s education system consists of a primary cycle of 5 years, a lower secondary cycle of 4 years - together adding up to 9 years of compulsory education17 – as well as an upper secondary cycle of 3 years and higher education courses of varying length. Remarkably, the Gross Enrolment Ratio is above 100 for primary education and well above 100 for lower secondary education18. This ratio can exceed the value of 100 when many children enter before 17 The team was informed that there are plans to abolish the 9th grade of compulsory education. This would be a step in the wrong direction. 18 These enrolment ratios must be treated with caution since population data are unreliable. We know how many children are in 38 school in absolute numbers (the numerator), but we don’t know the population (the denominator).
  • 40.
    or after theofficial entry age. It is even possible that some children never attend, and that this is (over-) compensated by over- and under-aged children. ECD has the potential to enhance timely entry in primary education, especially when combined PART 1 SITUATION ANALYSIS with close interaction with parents (Engle et al, 2007). While survival rates in the first three grades of lower secondary education are high, it drops to 91% at the end. Furthermore, 83.4% of the students make the step from lower to upper secondary (Ministry of Education Science and Technol- ogy (2008/2009:42), where the Gross Enrolment ratio stands at 81.8%. The survival rate in upper secondary is very low at 53.4%. Internationally, completion of upper secondary education is seen as a condition for successful entry in the labor market (World Bank, 2009:7). In fact, reducing the number of youth who fail to complete up- per secondary education is one of six key benchmarks of the European Union (Com- mission of the European Communities, 2002). Yet, many students in Kosovo drop out before attaining this level. As previously said, high Gross Enrolment Ratios can conceal pockets of exclu- sion. The NGO Balkan Sunflower (2010:2) – quoting EU sources – reports that less than half of the Roma, Ashkali and Egyptian children attend primary education; that less than 20% are in school beyond age 12; that 4.5% complete secondary school; and that a mere 40 young people from a Roma, Ashkali or Egyptian background are studying in higher education19. Unless action is taken urgently, there is a serious risk that educational exclusion is passed on to younger generations, sustaining the cycle of poverty and marginalization. ECD can play a key role, as the activities of Balkan Sunflower illustrate. In the age range between birth and entry in primary school, Kosovo has five types of programs: ■■ Pre-primary education; ■■ ublic preschool education, usually referred to as the kindergarten; P ■■ rivate preschool education; P ■■ ommunity-based ECD centers operated by the NGO EveryChild; C ■■ nformal day-care/babysitting centers20. I Figure 18 shows the development of the absolute numbers of children attend- ing these programs, with the exception of the community-based centers and the in- formal centers, as these centers do not appear in official statistics. In 2005, Szczurek reported that between 1999 and 2005, a total of 600 children between the ages of 3 and 6 had benefited from the program (Szczurek 2005:5). However, this data does not provide information about the structural capacity of this program on an annual basis, but it does suggest that this program is of a smaller order of magnitude than the other ones. For private preschool, the only figure available is for 2008, showing its order of magnitude, but not its development over time. 19 Since the total number of RAE people in Kosovo is rather small, their low degree of educational participation has little effect on the total figure. 20 These centers are comparable to the private provision, but they differ from these in that they form a cheaper option for many struggling young couples. However, they meet no official standards and are not monitored by the government. Hence they can be dangerous and lack sanitation and other essential facilities. 39
  • 41.
    Figure 18. Numbersof enrolled children in three early childhood programs, 2004-2009 25000 PART 1 SITUATION ANALYSIS 20000 15000 Public Pre-School Private Pre-School 10000 Pre- Primary 5000 0 2004 2005 2006 2007 2008 2009 Source: Shala & Luzha (2010:6) It is important to note that figure 18 presents absolute numbers of children and not enrolment rates. As indicated in figure 2 at the beginning of this chapter, the an- nual number of newborns has been about 35,000 on average in the relevant years, but it has somewhat fluctuated. This suggests that the enrolment ratios may have been more volatile than the blue and green bars suggest. It remains a fact, however, that the capacity – the number of “child-places” – in public preschool has hardly changed since 2005 (blue bars in figure 20), and that the capacity for pre-primary education actually decreased since 2006 (green bars). Each of the four early learning programs mentioned above are discussed next. Pre-primary education – referred to as Grade 0 in the KESP21 - is a one-year trajectory before entry in primary education, which ideally takes place at age 6. Thus, in pre-primary one will find 5 or 6 year-old children, depending on the date of birth. The preparation year can be offered in various institutional settings: primary schools, preschools or kindergartens, and community centers. In some cases, teachers from one preschool, travel to more remote communities to deliver the programs on site in other preschools. Whatever the setting, the program complies with established quality standards and remains an official program under the aegis and legal framework of the government. There appears to be a broad consensus that the preparatory year is critical for successful entry in primary education and that, by implication, it needs to be part of the compulsory cycle. Indeed, the second draft of the Curriculum Framework for pre- school, primary, secondary, and post-secondary education (Ministry of Education, Sci- ence and Technology, 2010a: 17) proposes a new structure for the education system in which this would be realized by 2012. This contradicts the Kosovo Education Strategic Plan that aims at universalizing the pre-primary year by 2016 (Ministry of Education, Sci- ence and Technology, 2010b: 43). This issue needs to be revisited, as the documents appear contradictory, i.e., make compulsory in 2012 what does not become available until 2016. The current coverage of the pre-primary year, expressed as a ratio, was 70.1% in the 2008-2009 school year (Ministry of Education, Science & Technology, 2008:34). In that same year, the number of children from ethnic minorities was 593, mainly Bosniak, Ashkali and Egyptian (Shala & Luzha, 2010:15). These 593 children represent 3% of 40 21 KESP stands for Kosovo Education Strategic Plan (Ministry of Education, Science and Technology, 2010b:20).
  • 42.
    the total numberof children in pre-primary (ibidem), while the share of these particular groups among the total population is about 1% (see figure 4 of this report). Clear data could be found on disparities between urban and rural children within pre-primary enrol- PART 1 SITUATION ANALYSIS ment. The (absolute) number of children with special needs in pre-primary is estimated to be a mere 17 (ibidem). Although it is not possible to convert this into a ratio, this fig- ure is alarmingly low and warrants further investigation. On the positive side, it must be added that promising initiatives for inclusive education have been taken by a number of preschool institutions (Pëllumbat e Paqes in Gjilan; Gëzimi ynë in Pristine; and others) and SOS Kinderdorf (ibidem). Finally, there are about 5% more boys than girls enrolled in pre-primary education (Ministry of Education, Science & Technology, 2010b:44). This is remarkable as gender gaps in early childhood education are rare even in many low- income countries. The costs of universalizing pre-primary education are relatively low. The excluded proportion of 30% represents 8,432 children22. Assuming a teacher-pupil ratio of 1:20, and taking into account that it concerns a half-day program, it is estimated that 211 teachers – or fulltime equivalents – are needed, against an annual salary of €2400 (Shala & Luzha, 2010:18). The total annual salary costs would be €505,903. With an additional 20% for utilities and replacement of materials and inventory, the total recurrent costs would be in the order of magnitude of €600,00023. For reference, the total education budget is €130,861,859. The cost requirement of €600,000 is 0.46% of the education budget. This small proportion can be found by, for instance, creaming off a very small frac- tion from the higher education budget, which is disproportionally high (United Nations Kosovo Team, 2008:8). Another potential source is a reduction of the government’s subsidy to the elite that have access to full-day kindergarten (see next paragraphs). Finally, it is important to note that even if the education budget does not grow as a pro- portion of GDP, it will still grow as a result of GDP growth, which is assumed to stand at 5% (see chapter 2 of this report). This would imply an increase of the education budget with €6,543,093, which is more than ten times the resource requirement of €600,000. Note that the 5% increase is cumulative – every year, another €6.5 million will be added to the budget – while the resource requirement is structural. After a few years of moder- ate economic growth, the budget increase will have dwarfed the resource requirement. Universalizing the pre-primary year has become extremely urgent. This has to do with the exclusion paradox. When only a few children have access to a prepara- tory year, the excluded child is not alone; it belongs to a large majority. The education system – the curriculum, the expectations of the teacher – will be tuned to the needs of the vast majority that is unprepared. But at an enrolment ratio of 70%, the education system will slowly adjust itself to the ones who are prepared, consciously or subcon- sciously. Teachers will adjust their teaching strategies to the prepared children. The unprepared children will be in an even more difficult situation than ever before. True, a 70% enrolment rate is better than 10%, but the last 30% deserve to be attended to as soon as possible. Closing the gap is urgent and of relative low cost. The fact that the total capacity for pre-primary education has remained stagnant ever since 2005 (see figure 18) is alarming. Delivered in 43 mainly urban kindergartens, public preschool education is divided in childcare for children 1-3 years old and education groups for those 3-6 years old 22 This is found by multiplying the current number of 19674 by 30 and dividing the outcome by 70. 23 Investment costs can remain limited since existing space if often used for pre-primary education. In any case, the investment costs occur only once, they are not structural. 41
  • 43.
    (Ministry of Education,Science and Technology, 2010b:41). Two sources report that the enrolment ratio stands at 10% (e.g. United Nations Kosovo Team, 2008:8; Shala and Luzha, 2010:3), while another source reports 12% (UNDP, forthcoming). A fourth PART 1 SITUATION ANALYSIS source mentions a rate of 4% (HMO-solutions, 2009:6)24. Neither of these figures could be reproduced exactly. If we divide the 5,000 children enrolled in preschool (see figure 18) by six times the 35,000 children in each age cohort (0 to 5, including 5), the result would be a ratio of about 2.5%. The aforementioned authors may have included the 1,440 children in private kindergartens to the 5,000 in public institutions, but this does not bring us much closer to the other estimates. Another possibility is that the other es- timates are based on a narrower age range, for instance the children of 3, 4 and 5 years old (i.e. just the education group, not the daycare group). In this case, the numerator drops by 1,133 (Statistical Office of Kosovo, 2010b: 10) from 5,000 to about 3,850, while the denominator drops to 3 times 35,000. This time, the result is a ratio of 3.7%, which is fairly close to the 4% estimated by HMO-solutions, and still significantly different from the estimations of 10% and 12%. Adopting the estimation of 3.7%, we compare this enrolment ratio in figure 19 with that of other countries in Central and Eastern Europe and the Commonwealth of Inde- pendent States. All of these countries have similar preschool systems. The enrolment ratios of these countries are plotted against their per capita GDP, for reasons explained in the figure below. Figure 19. Preschool enrolment by per capita GDP in the wider region, 2008 100,0 90,0 NetEnrolm. Ratio Preprimary, ages 3,4 and 5 80,0 70,0 60,0 50,0 40,0 30,0 20,0 10,0 0,0 0 1.000 2.000 3.000 4.000 5.000 6.000 7.000 8.000 GDP per capita (constant US$ year 2000) Sources: Transmonee database, except for Kosovo. Per capita GDP for Kosovo is from UNDP (forthcoming) and preschool enrolment is calculated by the authors of this report. Note: Included in the figure are all countries in the region Central and Eastern Europe and the Commonwealth of Inde- pendent States, except Slovakia, Georgia, Turkmenistan, Uzbekistan (no data for preschool) and Slovenia (outlier with comparatively high per capita GDP). The red dot represents Kosovo, the green dots are Moldova, Ukraine and Belarus. 42 24 The figure reported by HMO solutions concerns the year 2006. But this cannot explain the difference with the other figures, since back in 2006 neither the number of children in kindergarten nor the total age group was very different from today.
  • 44.
    Figure 19 suggestssome important implications. Kosovo is the red dot in the lower left corner of the grid. It has the lowest preschool enrolment but it does not have the lowest income. Although at first sight the regression line suggests that PART 1 SITUATION ANALYSIS there is a positive correlation between wealth and enrolment – the richer the coun- try, the more children in preschool – the line’s position is strongly determined by the group of seven countries in the upper right corner of the grid. These countries are Croatia, Czech Republic, Estonia, Hungary, Latvia, Lithuania, and Poland. Most are EU members, some are OECD members, and all are generally more developed and form a separate group. If we would delete these countries from the grid, there would hardly be any correlation left between wealth and preschool enrolment. Within the remaining countries, Kosovo has a middle position in terms of income. The green dots in the upper left corner are (left to right) Moldova, Ukraine, and Belarus. The first two have much higher enrolment levels than Kosovo despite a clearly lower per capita income. Only slightly richer than Kosovo, Belarus has the highest enrolment of all countries, inluding the seven rich ones. The reason why a country’s wealth does not determine preschool enrolment is that a kindergarten is a home-grown service. Nothing in it comes from abroad. So if the average income in country A is twice as high as in country B, teacher salaries will also be twice as high. Similarly, the construction workers who build the facility and the salaries of those who produce the construction materials follow the same trend. Therefore, while the citizens of country B are twice as poor, the preschool service is twice as cheap and therefore equally affordable as in country A. However, the rationale above still does not explain Kosovo’s exceptionally low position on the grid. An important factor is the high unit cost. Figure 20 provides a first indication; further elaboration of this point follows after the figure. Figure 20. Unit costs as % of per capita GDP in kindergarten in six countries, 2007-2010 80 70 60 50 40 30 20 10 0 Armenia Kosovo Kyrgyzstan Macedonia Moldova Poland Romania Sources: van Ravens (2010:46-47 and 2011:27), except for Kosovo. The unit costs of full-day kindergarten in Kosovo was estimated, based on information from various sources about the fee that parents pay (varying from €25 to €30, ignoring very high fees charged in public kindergartens in Pristine) and about the state contribution (varying from €75 to €120). The fee and the state contribution have been added up and were divided by per capita GDP. Note: Although the data in figure 20 stem from different years (2007-2010), the unit cost for each country was always divided by the per capita income of the same year in which that unit cost was observed. In Romania, about 75% of all enrolees in kindergarten are in a half-day program, which explains the low unit cost. 43
  • 45.
    The six countriesin figure 20 have very similar preschool systems, with very similarly equipped and programmed kindergartens. They provide opportunities for play and learning, meals, dormitories, and are staffed with caregivers, teachers, PART 1 SITUATION ANALYSIS cooks, cleaners, and administrators. Few countries in Western Europe can afford to provide this expensive service on a heavily subsidized basis, and the countries in figure 20 only provide it for a small and privileged elite, mainly consisting of double income families. But even in this group of countries, Kosovo is exceptional in that its unit cost – expressed as a percentage of average income – towers above that of the other countries, at almost thrice the average of the other countries. This trend points to a considerable inefficiency and over-resourcing. There seems to exist no pressure or incentive towards cost efficiency despite the fact that a large percentage of children in Kosovo are growing up in poverty. For a good understanding of figure 20 and its implications, it is important to note that the per capita income of a country is an abstraction: it is the total income of a coun- try divided by all its inhabitants, including the economically inactive such as children, youth, and elderly. Few people earn exactly the average income; most earn several times the average income. Teachers, for instance, earn typically 2 to 3 times the per capita GDP (UNESCO, 2004:165) so that they can sustain a family of, for instance, two adults and two children on one income. In Kosovo, this is not the case. Teachers and nurses earn hardly more than once the average income, which points at a very inequita- ble distribution of wealth. This hypothesis is supported by the finding (in chapter 2 of this report) that a rising average income goes hand in hand with rising unemployment lev- els. Some people in Kosovo must be accumulating wealth from mainly external sources (remittances, aid) and this wealth does not spill over sufficiently to the unemployed and to the working poor in the countryside. It is in this context that the government contrib- utes about €4 per day25 to just the care of a privileged child, while half of the children in Kosovo have less than €1.42 per day (table 4 of this report) to cover all of their needs: food, clothes, housing, et cetera. Another way of expressing this paradox is by stating the fact that more taxpayers’ money goes to one child in kindergarten than to the social assistance of a family with six children. This section on public kindergarten concludes with data on disparities. Of the 5,091 children enrolled in 2008-2009, 316 were from ethnic minorities, in this case mostly Roma, Turkish, and Bosniak (Shala and Luzha, 2010:14). This represents 1.77% of all enrolled children. While this is only a small proportion both of total enrolment and of the number of children within these ethnic groups, it does correspond broadly with the share of these groups within the total population. The presence of these children is most prob- ably the outcome of a policy to reduce or waive the fee for a maximum of 10% percent of all child-places in the kindergartens. In 2008-2009, 47 disabled children were enrolled in the kindergartens (ibidem), a little more than one per institution. Official figures on the urban-rural divide were not found, but as kindergartens hardly exist in rural areas, the enrolment of rural children is bound to be very low. Very little is known about the private preschool institutions. Shala and Luzha (2010:15) estimate that 35 of such kindergartens exist, enrolling 1,440 children in 2008. They also note that some of these institutions used to have a license, but these have expired. Other private kindergartens never had a license so presently none of the private kindergartens operate under any legal framework. No data are available on essential aspects such as teacher qualifications, program, and methodology. The fee is estimated at €80 which is thrice the fee in the public kindergarten, but since there is no state contribution, the fee equals the unit cost. Therefore the unit cost is 44 25 The government’s share in the unit cost is in the order of at least €80 per month, during five days per week. This makes €4 per day.
  • 46.
    much lower thanin the public system. This division of roles between public and pri- vate is unusual. Normally, countries have a public system for the masses, while rich elites can opt out and choose higher quality services and pay the cost price. We see PART 1 SITUATION ANALYSIS this in healthcare, education, transport, et cetera. But in Kosovo’s preschool system, it is the public system that functions as the luxury option. And since it is heavily sub- sidized, there is no strong market push for private provision26. The fourth and last service for early learning in Kosovo concerns the Communi- ty-based ECD Centers. These Centers are based on a well-tested and cost-effective approach to early learning that is successful in many countries around the world, rich and poor. Moldova and Kyrgyzstan are good examples of countries that are comparable to Kosovo and where these Centers have proven to reach out to remote and disadvantaged communities and tailor their programs to local needs. In Kosovo, there were 27 such Centers in 2005, operated by several NGOs of which Every- Child was the largest. At the time, EveryChild ran 16 Centers with the assistance of UNICEF (Szczurek, 2005:4-5). Unlike the regular kindergartens, their primary function is not to care for children so that parents can work. Instead they are entirely focused on child development, providing pedagogical activities that are well tuned to children’s age and stage of development. The Centers target children of 3, 4 and 5 years old in their catchment areas. The children are attended to in short daily sessions, which explains the low costs. Spaces in existing schools and community buildings are normally used. In fact, in an economical sense, the real costs are minimal. In its Human De- velopment Report for Kosovo, UNDP (forthcoming) stresses the need to develop rural areas by creating employment opportunities in the so-called non-farm sector, especially for women. The organization sees this as a critical strategy to enable the rural population to lift itself beyond subsistence living. By appointing 40 rural women as teachers/caregivers (Szczurek, 2005:5), EveryChild created opportunities in areas where hardly any salaried employment existed. Through the so-called multiplier ef- fects, these women’s salaries will create an impulse in the local economies. This cre- ates strong arguments for government to invest in community-based ECD: not just to enhance child development, but also to stimulate rural development more directly. However, the government in Kosovo has not supported the momentum towards community-based ECD, and most municipalities lack the resources and/or the vision to make things happen. While it is one of the hallmarks of this approach that parents and communities contribute financially to some extent – this enhances local owner- ship and shared responsibility – it is not the case that they should sustain the Centers entirely. Structural co-financing from the state is critical for the Centers’ sustainabil- ity. Indeed, many of the original 27 Centers had to close down in recent years. At this moment, only 5 Centers are said to be sustainable, while Save the Children – an international NGO that runs large numbers of community-based ECD Centers all around the world – has withdrawn from this activity in Kosovo. Given the government’s ambition to expand preschool education – this will be elaborated in Part 2 of this report – it is interesting to note that the unit costs per child per month in community-based ECD are low27. This is broadly consistent with the finding in several other countries that full-day kindergarten is about 4 to 6 times more expensive than half-day programs in Centers (van Ravens, 2010:48 & 2010:63). 26 For an elaborate discussion of such policy dilemmas, see chapter 5 of “Fair Play”, a report on preschool education in Macedonia, also available in Albanian and English (http://www.unicef.org/tfyrmacedonia/). 27 For a similar but slightly more complex program, Balkan Sunflower spends €35 per child per month. 45
  • 47.
    Box 1: Insightsfrom the team’s visit to a rural Community Based ECE Center in Shkabaj Fifteen children and two teachers welcome us mid-day into their classroom. The children engage in free-play in a small room with a broken window and an PART 1 SITUATION ANALYSIS exposed wood stove that releases heat, a sharp burning smell, and a thin fog. The community-based center sits on a hill neighboring a primary school. One of the teachers is uncertain about the future of the center. Dependant entirely on parental fees and facing infrastructural and adminis- trative challenges, the sustainability of the initiative is unpredictable. The same teacher, however, is optimistic about what the center represents for the children: it enables them to interact, socialize and engage in basic learning processes. The quality of the center (from the perspective of infrastructural safety, learn- ing materials, and adherence to curricular standards) is a stark contrast to the better supplied, financed and regulated public ECD centers we visited closer to Prishtina. Despite the availability of start-up costs, the Center lacks resources for its upkeep and quality daily operations. However, the Community-Based ECE Center is located strategically just outside Prishtina and has the unique potential to reach underserved young children in the area. With the support of the commu- nity, the Center presents an opportunity for government intervention and multiple stakeholder commitment to early childhood education. In conclusion, based on an analysis of the 4 early learning institutions – pre- primary grade, public and private kindergarten, and community-based centers – it appears that missing from the approach are services oriented towards parental education. Even if all children in Kosovo attend early learning programs from age 3 onwards, through currently existing programs, the critically important age range of 0-3 would still not be covered. Worldwide, parental education, in groups and/ or through home-visiting, is seen as a good strategy to fill this gap. The same was said in previous chapters regarding health and protection. So, the case for integrated content is strong. Part 3 of this report will further elaborate on this. 46
  • 48.
    PART 2 POLICY ARCHITECTUREANALYSIS AND ASSESSMENT OF ECD PROVISION
  • 49.
    Introduction PART 2 POLICYARCHITECTURE ANALYSIS AND ASSESSMENT OF ECD PROVISION Part 2 of the report presents the findings of the content analysis of Laws, Sec- toral Strategies, Strategic/Action Plans, curricula, and regulations that address the service provision for the youngest children in Kosovo. Since there is an absence of an ECD policy or policies in Kosovo, the documents analyzed herein provide the planning frameworks through which priorities, objectives, targets, and/or activities are set. The planning frameworks may be directed towards the entire population, a sub-set of the population (i.e. school-aged children, minorities, individuals with disabilities), or specifically towards children 0-6 years of age. Disaggregating the provisions within the policy and planning frameworks by age ranges (early or late childhood) allows for the following analytic process: 1. dentify the main priorities and strategies by the Government of Kosovo (as evi- I denced in the sampled documents) that set the service and programmatic stage for Kosovo; 2. dentify how the needs of the youngest children are addressed within the pro- I grammatic frameworks. Differentiating services that target a sub-population of all ages (i.e. minorities, individuals with disabilities, all school-aged children) is important because they may or may not reach children 0-6 via spillover effects; 3. dentify potential services and/or programs that are inclusive of and/or specifi- I cally targeted towards young children. This allows for planning coordination ef- forts and for a systematic understanding of the necessary policy interventions needed to achieve coordination of ECD services for all children; This part of the report addresses the legislative/strategic basis for ECD provi- sion and utilizes documents to lay a comprehensive map of the centrally-led efforts to address the health, education and protection of Kosovo’s youngest children. It is important to mention that the analysis presented herein does not inform how the downstream implementation processes are being conducted and/or fulfilled. To as- sess challenges in the implementation of services, programs and activities, a sys- tematic dissection of the systems, institutions and actors responsible for delivery is required. From the sampled documents we have extracted: 1. summary of the sponsoring sectors involved in the completion of the docu- A ment; 2. summary of frameworks relevant to the endorsement and development of the A document’s content; 3. description of the vision, indicators, and other key components within the A document; 4. n extraction of elements within that document (i.e. objectives, targets, activi- A ties) explicitly targeted towards Early Childhood. Based on sampled documents, the analyses herein assesses objectives and targets that have specific provisions/activities targeted torwards young children. The content analysis of the documents will be used to: 1) evaluate alignment between goals and needs of young children and; 2) build the policy and strategic recommen- dations in Part 3 of the report. 48
  • 50.
    Chapter 1: LegislativeFramework PART 2 POLICY ARCHITECTURE ANALYSIS AND ASSESSMENT OF ECD PROVISION An analysis of relevant laws is followed by an analysis of strategies and strate- gic plans. Law on Education in the Municipalities of Kosovo Sponsoring sectors and driving frameworks The purpose of this law, which was signed in 2008, is to regulate the organiza- tion of public educational institutions and the provision of public education at the pre-primary, primary, lower secondary, upper secondary and higher education levels in the municipalities of Kosovo. The sponsoring sectors are the Ministry of Educa- tion, Science and Technology of the Republic of Kosovo (MEST), and the municipali- ties in accordance with the Law on Local Self Government. MEST is responsible for ensuring that the educational system is in keeping with the education goals of Kosovo. The Ministry is responsible for the design, imple- mentation, coordination, and supervision of educational institutions (pre-primary to higher) in the municipalities. Municipalities shall have full power with respect to the implementation of education in the jurisdiction as it concerns local interests. How- ever, this must be aligned with standards and provisions with respect to pre-primary to higher education. For example, where required that municipalities should have the competency to create conditions for providing educational services in the Serbian language, which are in keeping with the guidelines and standards of MEST. For every aspect of the education system, the law provides for coordination and joint execution between MEST and municipalities for the effective functioning of the system. Goals, strategies and extraction of ECD-specific provisions With respect to ECD specific provisions, it is the pre-primary and primary schools that are most relevant. The law states that the municipalities support pre- primary and primary education in accordance with general guidelines, regulations and standards of MEST for construction of educational facilities, registration and admission of students, selection and employment of teachers, school personnel and director, training educators and other professional staff in accordance with guide- lines, principles and standards of MEST, supervision and inspection of the education process in accordance with guidelines established by MEST, and monitoring and reporting on students’ educational and social progress to parents should be fol- lowed. The municipalities have to provide educational administration services that are required for effective functioning of pre-primary and primary schools. Particular guidance is provided for the registration, public health and safety in- spection and licensing of pre-primary educational institutions. The law states (i) that reporting on pre-primary level education, budgetary and management operations to municipal governments and MEST should be in accordance with municipal and central legislation, and (ii) that determination of the parents’ participation fee for the admission of children to nurseries and kindergartens be in accordance with Kosovo’s laws. 49
  • 51.
    PART 2 POLICYARCHITECTURE ANALYSIS AND ASSESSMENT OF ECD PROVISION Law on Preschool Education (2006) Sponsoring sectors and driving frameworks The law on preschool education is promulgated by the Constitutional Frame- work for Provisional Self-government in Kosovo with the purpose of setting a legal base for the regulation, progress, and improvement of preschool education. The principles framing the law are equality, inclusion of children with disabilities, demo- cratic process of implementation, staff autonomy, professionalism and responsibility, equal capacities for children and parents, taking into consideration changes between children, the right to be different, and all-inclusive development of children’s person- ality. The main implementer of the law is MEST. Goals, strategies and extraction of ECD-specific provisions The goals of the law are stated with respect to early holistic development and include multiple domains of development, including; language, social development, appreciation of culture and society, artistic and creative appreciation knowledge of science, ability to learn, physical development and good hygiene, good mental health, and positive attitude towards life. The role of the preschool institutions is to support the parents in child care- taking and education; promote quality for children and family life; create conditions for development of individual potential of children, and its manifestation; and create conditions for the increase of capabilities of the children in fulfilling the tasks and obligations presented by the school. Ensuring preschool education is the responsi- bility of the community, particularly in situations where there is no public preschool institution. Communities are required to either organize a preschool or to request the municipal preschool education to extend the capacity of preschool institutions. Every preschool has to have an annual plan and program for one academic school year, which should be provided by the Steering Committee of the preschool institu- tion to MEST administration. With respect to the curriculum for the preschools, all educational programs should be based on general curriculum approved by MEST, Experts Council and School Textbooks. However, the preschools can develop their own curricula objec- tives based on this general guidance. Parents should be given the information on the curriculum in the language of instruction, which is in most cases is Albanian. But in areas with large ethnic minorities, local languages should be used. Education pro- gram providers for preschool education in public institutions, should be selected by the Municipal Assembly. Parents have the right to select a preschool program for their children in either a public or a private institution. However, the way of selecting the programs is regu- lated with administrative instruction. For children who cannot attend preschool insti- tutions because of their disability, formal preschool education in the family should be organized in compliance with the Law and the administrative instruction. As per the Law, preschool education programs can be financed by: the Kosovo budget, Founders, fees paid by families, donations, and other recourses. The Law states that the owners of the preschool institution are obliged to provide funds for 50
  • 52.
    its establishment andfunctioning. The difference between the cost price of the edu- cational program and the fees paid by parents should be provided by the municipal budget on financing personal incomes, goods, employees’ tariff in institution and PART 2 POLICY ARCHITECTURE ANALYSIS AND ASSESSMENT OF ECD PROVISION expenses for materials in compliance with standards. MEST and other competent bodies are responsible for monitoring and super- vision. Monitoring information should be collected, stored, and shared in order to provide preschool education, monitor activities and use statistics to project needs. The way of collecting data should be regulated by administrative instructions. The supervision of implementation of this law and the provisions issued from this law are the responsibility of MEST. Family Law of Kosovo Sponsoring sectors and driving frameworks The Family Law of Kosovo was signed in 2004 to uphold the value of the family, which is seen as a vital community of parents and their children and other members of the kin. Protection of rights is the driving framework for this law as it pertains to social protection and the protection of the family and the children. As per the law, the family is recognized as the natural and fundamental nucleus of society and needs to be protected. The legislative provisions for social assistance and protection of the family come into play only when required. With respect to children, this law recog- nizes the protection of children’s rights and the responsibility of both parents for the growth and education of the children until they are 18 years of age. The law also recognizes the social protection needs of children with no parents and those who are vulnerable due to disabilities and who are unable to take care of themselves. In addition, the law provides specific guidance on financial arrangements in the family, property arbitration, financial responsibilities, and procedures to appeal when basic rights are violated. Goals, strategies and extraction of ECD-specific provisions With respect to ECD, the law offers several types of protection for young chil- dren. Paternity and maternity of children are recognized and protected. Child pro- tection provisions in this law are strong with respect to the child’s right to life, to grow up in a family with parents, to receive special service if they have a disability, to be eligible for free of charge primary school, and to be protected from abuse, child traf- ficking, labor, and use of drugs. The law states that both parents are obliged to take care of, educate and feed their children, even in situations of separation, divorce and marriage annulment. Parents are primarily responsible for their children, including ensuing that the emotional, social and material welfare of their children is ensured. With respect to adoption, custody and foster care of vulnerable young children, the law provides protection against abuse and neglect, while ensuring that the young children receive the protection of public institutions. Law on Social and Family Services Sponsoring sectors and driving frameworks As per the Constitutional Framework for Provisional Self-Government in Koso- vo, in 2005, the law on Social and Family Services was established for the regulation and advancement of social and family services for persons in need and families in 51
  • 53.
    circumstances where thereis no family support or where the welfare of an individual cannot be ensured. The Law is based on the Kosovo Legislation and the Interna- tional Human Rights Conventions. PART 2 POLICY ARCHITECTURE ANALYSIS AND ASSESSMENT OF ECD PROVISION The Ministry of Labor and Social Welfare is responsible for the governance of services that fall under this law including, direct social care, counseling, and mate- rial assistance. The Ministry is responsible for the development of policies and the preparation of strategic plans for the provision of Social and Family Services in a manner that ensures equal access to Services without any discrimination, such as race, ethnicity, gender, etc. The Ministry is responsible for ensuring that these poli- cies and strategic plans are implemented according to the standards of regulations by municipalities and other organizations, that international and government agen- cies, non-government organizations and the private sector coordinate their efforts in providing and supporting services, and to encourage community participation and the development of community initiatives related to social welfare. However, the final decision regarding where, how and by whom these services will be delivered, includ- ing the right to provide these services, rests directly with the Ministry. The Institute for Social Policy, a Department within the Ministry of Labor and Social Welfare, is directly responsible for the implementation of this law. The Institute is also responsible for the development and promotion of professional knowledge, skills and standards in the area of Social and Family Services through research, train- ing, and consultations with service provision systems. However, it is the General Social and Family Services Council who is responsible for the maintenance of pro- fessional standards for professionals working in the field and who is the licensing and registration authority for Social and Family Services. Each Municipality, through its relevant Directorate, is responsible for ensuring the provision of Social and Family Services within its territory to a standard specified by the Ministry of Labor and Social Welfare. Municipalities establish and maintain a Centre for Social Work that is responsible for implementing this law. Goals, strategies and extraction of ECD-specific provisions There are no ECD-specific provisions in this Law. However, the Law does ad- dress children in general and many of the conditions that impact child well-being and are addressed in this Law are also experienced by young children. Therefore, the goals, strategies and provisions in this Law that could be considered important for ECD have been extracted below. As per the Law, the state, through the governance bodies described above, has the responsibility to take care of children who have been orphaned of both parents, placed for adoption, abandoned, whose parents are unknown, or who have been placed by their parents in the care of the Centre for Social Work. A Ministry ap- pointed Child Placements Panel has the responsibility to approve of and allocate fos- ter or adoptive parents. These decisions are made based on specific set of guides provided in the Law that pertain to the child’s age, background, and abilities of the foster or adoptive parents. In other words, the best match between the child and the new family context is considered when making such a decision. 52
  • 54.
    Chapter 2: Strategiesand Plans PART 2 POLICY ARCHITECTURE ANALYSIS AND ASSESSMENT OF ECD PROVISION Six key strategies, relevant to the health, education and protection of children are analyzed below. Figure 21 illustrates the sectors involved in the development and implementation of the strategy/plan, and overarching and ECD-specific objec- tives/targets. Figure 21. Sectoral involvement in strategies and plans & analysis of overarching and ECD-specific objectives objectives Overarching Objectives/Targets ECD Objectives/Targets Strategy/Plan 2-Improve management of existing resources and quality of services 1-To decrease 3-The function, reorganization and the completion of the existing infrastructure of morbidity and the healthcare system and the procurement of medical equipment in accordance mortality of the Strategy Health Sector with European standards overall population 4-Continuing implementation and development of Health Information System (inclusive of but 5-To establish e sustainable funding system of the health sector not specific to National ECD) Sector 1-Healthy and supportive environment 2-Appropriate physical and healthy environment HEALTH Promoting Schools 3-Sufficient human and material resources Health 4-Continuous and qualitative care for pupil’s health 5-Low level of violence within schools 6-Level of health and environmental culture of the pupils 3-Quality Improvement/Training 4-Curricula and Standards 1-Inclusion in pre-primary education 5-Management and professional capacity 2-Inclusion in pre-school education KESP 6-Developing pre-school expertise (Explicit to ECD) 7-Awareness raising activities EDUCATION 2-Prevention of discrimination and segregation in the system of education 1-To improve school-commu- 3-Meaningful and efficient cooperation between relevant institutions and nity cooperation and increase Integration organization serving for improved education of RAE communities community responsibility for 4-Increasing awareness among involved parties on the need to support education in rural areas (in of RAE the education of members of RAE communities order to develop an active partnership in school manag- ment) - (Inclusive of but not 1-Health specific to ECD) 2-Eudcation PROTECTION 3-Employment 4-Social protection Action Plan 5-Accessibility Disability National 6-Statistical Data 1-To improve school-community cooperation and increase community responsi- bility for education in rural areas 3-To provide education adapted to the learning needs of children in rural areas 2-To increase participa- 4-To increase participation of rural people in relevant non-formal education and tion and retention of rural Integration training programmes (adult education), especially linked to income generation children, especially girls 5-To improve the physical and material resources of rural schools and ensure at of rural people and minority groups, in ba- least a minimum level of resources necessary for the teaching process sic education (pre-school 6-To establish a reliable and accessible education information system (not only and primary school) and related to rural schools) develop oppurtunities for 7-To develop the management capacity and organizational structure of rural their enrolment into post- schools compulsory educaiton 8-To develop the human resources of education in rural areas by improving the (Explicit to ECD) recruitment, training and retention of teachers in rural schools 53
  • 55.
    PART 2 POLICYARCHITECTURE ANALYSIS AND ASSESSMENT OF ECD PROVISION The Strategy for Health Promoting Schools in Kosovo Sponsoring sectors and driving frameworks The Strategy for Health Promoting Schools in Kosovo was released in 2008 and represents the basic framework through which the education, health, environ- ment, youth, and business sectors, along with other stakeholders, were provisioned a program to increase the quality of education in a healthy school environment. The Committee on Health Promoting Schools began to function in 2003 and in 2005 a coordinator was appointed. The coordinator operated within MEST and reported to MEST, MoH and MESP. Other Ministries (i.e. MCYS) also contributed to the Com- mittee’s operations. The overall mission of the Strategy is to “Provide a healthy and friendly school environment, secure through health education, promoting of environ- ment protection and strengthening partnership within schools, parents and commu- nities”. The Strategy was drafted in response to assessments and evaluations that determined that schools and education in Kosovo inherited a fragmented system that placed little emphasis on strong quality and infrastructure28. The Strategy con- tains a Situational Analysis concerning the education system in Kosovo (Appendix I, Box-1). According to the Strategy, in financial terms, MEST is responsible for issues re- lated to curricula and training of educational personnel, and municipal departments to ensure maintenance of school infrastructure. After 2002, there was a gradual shift of the burden of investment in infrastructure from different donors to the local institutions. Despite efforts to transfer financing roles from donor to local sources, until 2002 investments in education were made only in accordance with community requirements and evaluations based on various donor organizations. The lack of a centralized and systematic approach to address the problem of school infrastructure led to a fragmented investment processes. A database by the International Man- agement Group in 1999, was one attempt to centralize the available data. However, according to findings of the current study, fragmentation of data to track institutional infrastructures in Kosovo, is still prolific29. The scope of the Strategy is largely based on the WHO’s principles of healthy school promotion30. The process of health promoting schools delineates mecha- nisms to ensure that “schools take care about the social welfare to the environment where physical and mental health, and safety of all participants in the educational process is supported in the form of partnership with family, community, and partici- pation of government and non-governmental bodies within the community”. 28 Based on a research conducted in July 1999, 132 schools were completely damaged. From 596 schools, 42 did not posses any toilets and 380 of them had toilets outside of the school building, and about 132 schools had no water at all. From those schools that had water supply, more than half of them had a water supply system outside the school building. Based on the evaluation of the education system organized immediately after the war, it was recommended to conduct a research on the water quality and as a result, IKSHP supported by UNICEF in 2002, organized similar research in 40 schools in rural areas in Kosovo, which were not connected with the water supply system. The research concluded that 75% of the water resources in the tested schools were bacterially contaminated and more than 50% were chemically contaminated. About 80% of the tested schools had no potable water. 29 Our interviews with multiple stakeholders revealed that lack of a cohesive data collection system in Kosovo is currently a challenge. 30 Promoting health in school is defined as: programs leading to improvement; advancement and preservation of health; but also timely identification and treatment of diseases or deviations that caused damage to the health of participants in the education 54 process.
  • 56.
    The Strategy followsprinciples within the framework of the Convention on the Rights of the Child and on the Elimination of All Forms of Discrimination against Women by framing its larger program objectives as follows: (i) to improve social ser- PART 2 POLICY ARCHITECTURE ANALYSIS AND ASSESSMENT OF ECD PROVISION vices and to empower families with knowledge and skills to create opportunities to ensure that babies and children are healthy, emotionally secure and able to learn in a safe environment; (ii) to contribute to universal access to qualitative formal and informal education and to reduce the percentage of abandonment of education, par- ticularly girls and minority children; (iii) to provide children with the skills necessary to become healthy, active and responsible citizens; and (iv) to contribute in improving policies and legislation for children who need special protection, and presentation of family-based alternatives. The Strategy specifies that in the context of Kosovo, the European principles for health promoting schools (democracy, equality, empowerment, racing activities, school environment, curricula, and training of educational personnel, measuring the success of cooperation, community, and sustainability) underlie the Strategy’s pro- grammatic priorities. Furthermore, several Kosovo-specific documents, policies and principles are cited in the Strategy as being relevant to its objectives and plan31. Goals, strategies and extraction of ECD-specific provisions The working group that led the development of the Strategy identified six stra- tegic objectives to drive targeted activities and processes between the years 2009- 2012. The Strategy is to be implemented in two phases: period 1 (2005-2010) and period 2 (2010-2018). The overarching objectives are: 1. Healthy and supportive environment provided by teachers, pupils and parents; 2. Appropriate physical and healthy environment for teaching and learning (based on guidelines for the development strategy of under graduate education in Ko- sovo 2007-2018); 3. Sufficient human and material resources; 4. Continuous and qualitative care for pupil’s health; 5. Low level of violence within schools; 6. The satisfactory level of health and environmental culture of the pupils. In order to meet the objectives, several strategies, corresponding indicators, and specific measures were provisioned. However, the strategy does not specify how objectives are targeted to different age ranges. The objectives are applicable to all levels of education and do not outline guidelines for implementation in Early Child- hood Centers, preschools and the first years of primary schooling 31 (i) The Law of Primary and Secondary Education (enrolment and progress must be given regardless of gender, presence of disabilities, ethnicity, social origin); (ii) Principles of the health system (equality, quality, honesty and responsibility, inclusion and non-discrimination, correct treatment of citizens based on the law and respect of human rights and freedom); (iii) The Kosovo Health Strategy (2005-2012) (includes overarching goals such as reduction of morality and morbidity through the improvement of growth and psycho-physical development, of reproductive health promotion, of immunization, youth health, smoking reduction and other addictive behaviors, and mental health status, oral health, environmental health; reduction of communicable and non- communicable diseases, traffic accidents). 55
  • 57.
    PART 2 POLICYARCHITECTURE ANALYSIS AND ASSESSMENT OF ECD PROVISION Draft Kosovo Education Strategic Plan (KESP) 2011-2016 Sponsoring sectors and driving frameworks The Kosovo Education Strategic Plan 2011-2016 (KESP) takes as its starting point and guiding legislative framework the following four documents: 1. Strategy for Development of Higher Education in Kosovo (2005-2015): Officially adopted before Kosovo declared its independence on February 17, 2008; 2. trategy for Development of Pre-University Education in Kosovo (2007-2017): S Adopted in September 2004 by the first democratically elected Government of Kosovo; 3. he Roadmap for the Education Sector: The roadmap suggested that the two T strategies (Pre-University and Higher Education) should be developed as a sin- gle education strategy based upon a Life-Long Learning framework. The Road Map laid out several priorities to improve aid effectiveness, efficiency and co- ordination32. 4. edium Term Expenditure Framework (2011-2013) M The key legislative frameworks within KEPS that address ECDE are the Law on Pre-University Education; Law on Education in Municipalities of the Republic of Kosovo (2008); Law on National Qualifications (2008); Law on Preschool Education (2006); the General Standards for Preschool Education in Kosovo for ages 3-6 (2006); the Curriculum for Preschool Education in Kosovo for ages 3-6 (2006); and the Stra- tegic Plan for the Organization of Inclusive Education in Kosovo 2010 – 2015. Fur- thermore, ongoing work on the Standards for the Development and Learning in Early Childhood (0-6 years) and the Strategic Plan for the Prevention of Drop-outs (2009 – 2014) are also legal frameworks relevant to the ECD provisions within KESP. Beyond the legal frameworks that drive ECD-related provisions in the Strategy, KESP outlines the basic structure of the Education Sector in Kosovo33. Goals, strategies and extraction of ECD-specific provisions KESP was divided into seven program areas: preschool education, pre-univer- sity education, vocational education and training, teacher education, higher educa- tion, adult education and training, and information and communication technology (ICT). Overview of projected costs for key sub-sector areas was estimated according to development and recurrent costs (appendix II, table 1). According to KESP, the overall objective of preschool education is to “provide inclusive and equitable access for all children to quality, non-discriminating edu- cation up to the age of 6 by 2016 through increasing the capacity of the physical 32 Priorities of the Roadmap for the Education Sector include: improved strategic planning and base-line data; building a comprehensive capacity development plan and improved TA utilization; improved sector budget and financing of prioritized needs; improved performance of PFM systems and risk mitigation; improved development partner co-ordination; managing for results and monitoring of sector performance. 33 The education system encompasses preschool education (children ages 0-3 and 4-5) and pre-primary grade 0 for children ages 5-6. Pre-university education comprises children ages 6-18 attending one of the three education levels: primary school (children ages 6-11 in 56 grades 1-5), lower secondary school (ages 11-15 in grades 6-9) and upper secondary school (ages 15-18 in grades 10-12/13).
  • 58.
    infrastructure and byimproved awareness campaigns and by enhancing curriculum and learning materials, and initiating a program for professional development for educators and staff”. The Strategy’s overall benchmark is that all children of age PART 2 POLICY ARCHITECTURE ANALYSIS AND ASSESSMENT OF ECD PROVISION 5-6 be included in pre-primary education by 2016 and that 35 percent of children of age 0-5 be included in various forms of preschool education. KEPS assigns MEST and municipalities the responsibility of establishing the foundation for managing the program. Table-2 (appendix II) summarizes the ECD-specific key areas addressed in KESP and the sub-sector issues addressed in the preschool program. In sum, the targets addresses could be classified under the general categories of mechanisms or equity, access and quality as follows: ■■ Equity — gender parity and issues pertaining to the enrolment of ethnic mi- norities, campaigns to raise awareness of gender parity issues among service providers; ■■ Access — increase in enrolment (compulsory by 2016), awareness campaigns among stakeholders of the importance of preschool education; ■■ Quality — systems of accreditation for teachers, development and implementa- tion of age-specific curricula for each target (0-3 and 3-6), increase of manage- rial capacity of preschool managers (including the establishment of an Advisory Group for Preschool Education). Pre-University education was given the largest proportion of the projected cost (appendix II, table 1). Other provisions specified for pre-university education, teacher education, adult education and training, and information and communication technology (ICT) are relevant to ECD. Target areas have been extracted (appendix 1, table-2) to facilitate the identification of activities that may spill over into services concerning children 0-6 years of age. Participatory Strategy Development for Education for Rural People (2004-2009) Sponsoring sectors and driving frameworks Several international frameworks were relevant to the drafting of the Participa- tory Strategy Development for Education for Rural People. The Strategy states: “the Millennium Goals of Poverty and Hunger Eradication and Universal Primary Educa- tion will not be achieved by 2015 if rural people do not have better access to quality basic education”. Global imperatives that drove the Strategy for Education for Rural People in Kosovo include the World Food Summit, Education for All Conference (EFA, Jomtien, 1990), MDGs, FAO and UNESCO’s partnership on Education for Rural People (ERP) within the International Alliance Against Hunger and the EFA initiative. The development of the Strategy was based on an assessment of educational needs and the problems facing rural people in terms of access to quality basic edu- cation. The assessment was done in three villages in each of the five municipali- ties selected according to their proximity to a main urban centre, population size, and multi-ethnic representation.34 Information was gathered from the 15 villages on household economic activities, household members, and participation in education (primary and secondary schools). At the time of the assessment, preschool classes 34 Lipjan, Prizren, Kamenice, Peje, and Skenderaj 57
  • 59.
    were available in12 out of the 16 rural primary schools covered by the assessment, but only 22% of 5 year olds in the surveyed households attended preschool. Ac- cording to the Strategy, “the main problem associated with participation in preschool PART 2 POLICY ARCHITECTURE ANALYSIS AND ASSESSMENT OF ECD PROVISION in rural areas, is one of demand rather than supply. Although not all primary schools in the study have preschool classes, in those villages where preschool education exists, many children do not attend. The main reasons given are ‘disinterest by par- ents’ or ‘too far for children to walk’ ”. Goals, strategies and extraction of ECD-specific provisions The vision of the Participatory Strategy Development for Education for Rural People was to provide “Quality learning and education opportunities for all rural peo- ple”. This medium term development strategy was designed for implementation within a five-year time span (2004 – 2009). In addressing the challenges and achiev- ing the vision, the focus of the strategy was framed around the following eight stra- tegic goals: ■■ Goal 1 To improve school-community cooperation and increase community re- sponsibility for education in rural areas (in order to develop an active partnership in school management); ■■ Goal 2 To increase participation and retention of rural children, especially girls and minority groups, in basic education (preschool and primary school) and de- velop opportunities for their enrolment into post-compulsory education; ■■ Goal 3 To provide education adapted to the learning needs of children in rural areas; ■■ Goal 4 To increase participation of rural people in relevant non-formal education and training programs (adult education), especially linked to income generation; ■■ Goal 5 To improve the physical and material resources of rural schools and en- sure at least a minimum level of resources necessary for the teaching process; ■■ Goal 6 To establish a reliable and accessible education information system (not only related to rural schools); ■■ Goal 7 To develop the management capacity and organizational structure of rural schools; ■■ Goal 8 To develop the human resources of education in rural areas by improving the recruitment, training and retention of teachers in rural schools. Strategic goal # 2 explicitly addresses ECD services. It targets access to pre- school education based on two key findings: (i) low level of participation by rural children in preschool education; and (ii) lower level of participation among girls and ethnic minorities in grades 5-9 of compulsory basic education, as a consequence of the dropout phenomena. Key Actors were broadly delineated for each goal35 with 35 Actors specified for the 8 programmes of the Participatory Strategy Development for Education for Rural People Goal 1- Community members, parents, teachers, school directors, school boards, municipal and regional education officers. Goal 2- Community members, parents, teachers, school boards, school directors, municipal and regional education officers. Goal 3- MEST, education (curriculum) specialists, teacher trainers, community members, parents, school boards, school directors, teachers, regional and municipal education staff, employers. Goal 4- Community groups, youth, NGOs, schools, municipal officers, MEST, MAFRD, MLSW, MTI, training centres, employment offices, employers, farmers. Goal 5- MEST, regional and municipal authorities, utilities (water, electricity supply) teacher trainers, community members, parents, school boards, school directors, teachers. Goal 6- MEST, University of Pristina, IT specialists, regional and municipal education officers, SOK, KEC, school directors, school boards, teachers. Goal 7- School directors, school boards, regional and municipal education officers, MEST, teacher trainers (in the Faculty of Education), specialists in management training. 58 Goal 8- Teachers, teacher trainers (in the Faculty of Education), MEST, regional and municipal education officers, school boards.
  • 60.
    municipal officer responsibilitiesspanning through all proposed goals. Also a set of programs to match the strategic goals was specified and budgeted. Furthermore, a prioritization of the objectives was put forth to “guide lines of action for donor sup- PART 2 POLICY ARCHITECTURE ANALYSIS AND ASSESSMENT OF ECD PROVISION port”. The prioritization was as follows: 1. To improve management and leadership in basic education and increase com- munity participation in school affairs; 2. o improve teaching and contextualize the curriculum in rural primary schools so T that education is adapted to the learning needs of children in rural areas; 3. o provide adequate teaching materials, books and equipment for rural primary T schools (in line with curriculum reforms); 4. o support community learning and awareness (non-formal adult education) in T rural areas; 5. o reorient secondary vocational (agricultural) education towards meeting the T learning needs of rural communities. Strategy for integration of Roma, Ashkali, and Egyptian communities in Kosovo (education) Sponsoring sectors and driving frameworks The Strategy for Integration of Roma, Ashkali and Egyptian Communities in Education is one of the components of a more comprehensive strategy towards the integration of these communities in Kosovo, developed under the aegis of the Prime Minister’s Office. Drafting of the strategy was sponsored by the Ministry of Educa- tion, Science, and Technology (MEST) and supported by the Kosovo Foundation for Open Society (KFOS). The process of developing the education component was co- ordinated by the Kosovo Education Center (KEC) and was characterized by a broad participation of all involved parties: government, Roma, Ashkali, and Egyptian com- munities representatives, civil society, political parties, international organizations engaged in human and children’s rights (OSCE and UNICEF), among others. Pre-existing strategies (such as the Strategy for Development of Pre-University Education for years 2005-2015) were important to the development of the Strategy for Integration of Roma, Ashkali and Egyptian communities. The strategic document also refers to the Universal conventions as key frameworks that guided its develop- ment. Some of those driving frameworks include the Framework Convention on Protection of National Minorities36; Article 27 of the International Convention on Civil and Political Rights guarantees the right to use their language within their community and with other members of their group; Article 5 of the UNESCO Convention against Discrimination in Education provisions enabling minorities to learn and to teach in their mother tongue; Convention on Children’s Rights, primarily Article 28 (on the right to education) and Article 30, which provides that a child belonging to a linguistic minority must not be denied its right to use his/her mother tongue; and the UN Decla- ration on the Rights of Persons belonging to National, Ethnic, Religious, or Linguistic Minorities as well as the Universal Declaration of Human Rights. 36 Article 14 of the Framework Convention on Protection of National Minorities, provisions the right of minorities to safeguard their collective identity through their mother tongue. This right is implemented through education. These instruments highlight that the right to safeguard one’s identity through the minority language should be balanced with the responsibility for integration and participation. 59
  • 61.
    Goals, strategies andextraction of ECD-specific provisions The strategic objectives were directed primarily towards the partial integration and insufficient participation of Roma, Ashkali and Egyptian communities in educa- PART 2 POLICY ARCHITECTURE ANALYSIS AND ASSESSMENT OF ECD PROVISION tion. The vision of the Strategy is “a knowledge and inclusive society, respecting di- versity, fully integrated into European trends, offering equal opportunities for personal development of all individuals of Roma, Ashkali and Egyptian communities, who in return contribute to the sustainable economic and social development”. The Mis- sion of the Strategy is “Building of a high quality and inclusive system of education, based on justice, equity and respect for diversity, contributing to the full integration of Roma, Ashkali and Egyptian communities in the society”. For each objective, the strategy specifies a measure, activities, responsible en- tities, budget, time, target group, indicator, and supporters. Strategic objective-1 (Significant improvement of access and quality of education for members of Roma, Ashkali and Egyptian communities) directly addresses the preschools and pre-prima- ry sector. Activities to increase the inclusion of Roma, Ashkali and Egyptian commu- nities in these two sectors include: i) conduct a needs assessment for preschool and pre-primary education; ii) inclusion of ranked Roma, Ashkali and Egyptian qualified teachers and assistants in the education system; iii) the provision of incentives and financial assistance to future educators for studies, work and practice; and iv) provi- sion of accredited training programs. The activities, although not all directly linked to the larger objective of increased inclusion, present mechanisms to increase cultural- ly-sensitive and targeted approaches to early education. It is unclear, however, if the activities would target the true barriers which have been identified. Disability Action Plan for Kosovo 2009-2011 Sponsoring sectors and driving frameworks The Kosovo Disability Action Plan 2009-2011 seeks to translate the aims of the Convention on the Rights of Persons with Disabilities and other relevant internation- al treaties and recommendations with regard to human rights, non-discrimination, equal opportunities, and full participation of persons with disabilities in the first policy framework on disability for the years 2009-2011. The Kosovo Disability Action Plan, in line with the CRPD and the Council of Europe’s New Strategy for Social Cohe- sion (2004), points out the need for a special commitment to ensure access to hu- man rights for people who are at risk of becoming vulnerable, such as children and young people, ethnic minorities and migrants, people with severe disabilities and the elderly. ILO Recommendations regarding the employability of persons with dis- abilities, coming from the ILO Convention, are also referenced to in the Action Plan as key guiding principles. Furthermore, the Plan makes reference to existing Kosovar legislation on health services for persons with disabilities. Main acts cited are the Law 38/2004 on the Rights and Responsibilities of Citizens in Healthcare and the Law 4/2004 Koso- vo Health Law, on Community Based Rehabilitation. The Plan also references the Council of Europe’s Action Plan (2006), which declares: “Rehabilitation of persons with disabilities, by virtue of the economic and social integration it achieves, should be among priorities of any society”. The Disability Action Plan is structured around several cross-cutting issues: i) vulnerable groups within persons with disabilities (including Women, Girls, Children, 60
  • 62.
    Youth, and personswith disabilities from minorities and migrants); ii) data collection; iii) awareness raising and education for behavior change; iv) multidisciplinary com- missions; v) training on CRPD for Parliamentarians and governmental officials; and PART 2 POLICY ARCHITECTURE ANALYSIS AND ASSESSMENT OF ECD PROVISION vi) international cooperation. The Plan also includes the following overarching thematic issues that are di- rectly relevant to children: Health: Comprehensive free medical care for all persons with disabilities; defining a program on professional approach of the health care providers towards persons with disabilities according to international human rights standards; im- prove accessibility to health infrastructure; improve rehabilitation services for per- sons with disabilities; ensure the availability of a sign language interpreter on the health system at central and local level. Education: Creating equal opportunities for persons with disabilities in the educational system; implementing legislation in the educational field for persons with disabilities; ensuring an inclusive education system in preschool institutions; professional development programs on inclusive education for teachers and peo- ple involved in the educational system; improving competences on disability at municipal level. Social protection: Improving social services, reflecting the fundamental rights and freedoms of persons with disabilities; enhancing the economic living standards of persons with disabilities and families; creating and implementing a coherent legal framework for the access of persons with disabilities to a large spectrum of quality community services. Other thematic issues relevant to all people with disabilities include activities and budget lines to address accessibility (constructions or removal of architectural barriers, development of systems for statistical data gathering, mechanisms for em- ployment, and decentralization systems). The Health Sector Strategy 2010-2014 Sponsoring sectors and driving frameworks The Kosovo Development Strategy and Plan (KDSP) was developed by the transitory KDSP Secretariat and structured for implementation over the period, 2007- 2013. KDSP provided over-arching policy objectives for Kosovo that incorporated the policy priorities, which resulted from several Working Groups drawn from the Ministries and other stakeholders. The Health Sector Strategy 2010-2014 was gen- erated by one of these Working Groups. The preparation process of revised Sec- tor Strategies, through which priorities would be determined and which would offer information for the planned expenditure on activities in 2009, was disrupted by the General Election and by the progress towards Independence. The KDSP, published in 2007, was then translated into the Medium-Term Expenditure Framework (2008- 2010) Despite several limitations to generate an accurate health profile for Kosovo (i.e. difficulties in integrating the Serbian community into the Kosovar reporting system and the not-fully developed Health Information System), available evidence suggests that Kosovo’s health profile is amongst the worst in the South-Eastern Europe. High levels of infantile mortality, tuberculosis and issues with inadequate nutrition are per- 61
  • 63.
    sistent problems whilelimited abilities and mental health are cross-cutting issues. Furthermore, the Strategy reports there are 0.94 doctors, 2.61 nurses and 0.06 den- tists per 1,000 inhabitants in Kosovo. These ratios are low in comparison with other PART 2 POLICY ARCHITECTURE ANALYSIS AND ASSESSMENT OF ECD PROVISION countries, especially that of doctors. In Primary Health Care, the ratio of senior staff to intermediate staff is only 1:3. The average number of beds per 1,000 inhabitants is 1.43, extremely low in comparison with other countries in the region. In summary, the Strategy sites the following as critical problems at the root of a low-performing health system: absence of a functional Health Information System; absence of a Health Insurance System; the referral system; lack of standards for services or work proto- cols; need for improvement of managerial knowledge and skills; and non-functional infrastructure. Goals, strategies and ECD-specific focus Based in the broad-stroke situational analysis of the Health system in Kosovo, the strategy’s vision is to achieve “A healthy population across all of the Republic of Kosovo”. From that larger vision, 5 strategic objectives are derived: Strategic Objective-1: Strategic Objective-1: To decrease morbidity and mortal- ity of the overall population; Strategic Objective-2: Improve management of existing resources and quality of services (framework of Kosovo based on basic quality standards by end of 2014); Strategic Objective-3: The function, re-organization and the completion of the existing infrastructure of the healthcare system and the procurement of medical equipment in accordance with European standards; Strategic Objective-4: Continuing implementation and development of a Health Information System; Strategic Objective-5: To establish a sustainable funding system for the health sector. Objective-1 outlines activities that specifically target early childhood. Figure 22 summarizes the objectively verifiable indicators and means of verification for the Health Sector Strategy. Figure 22. Figure 22: Strategic Objective-1 from the Health Sector Strategy: Reduce morbidity and mortality of the overall population OBJECTIVELY VERIFIABLE INDICATORS MEANS OF VERIFICATION -Mortality rate of children under 5yrs to -Annual Health Status report from NIPHK decrease by 2/3 by 2014 -Reports from relevant Health Institutions -Maternal mortality rate to decrease by 3/4 based on legislation by 2014 -Annual Reports from Mother and Child -Infectious disease morbidity rate to Health Committee decrease by 20% by 2014 -Health Information System -Un-infectious chronic disease morbidity -Statistical Office of Kosovo (SOK) rate to decrease by 20% by 2014 Source: Taken from the Health Sector Strategy 2010-2014. Child Protection Frameworks and Institutional Arrangements 62
  • 64.
    The Kosovo ProbationService is a structure that operates within the Ministry of Justice, established in December 2002. The activity of this service is legislated by four key laws: Provisional Criminal Code of Kosovo, the Criminal Procedure Code of PART 2 POLICY ARCHITECTURE ANALYSIS AND ASSESSMENT OF ECD PROVISION Kosovo, the Law on Execution of Criminal Sanctions, and the Juvenile Justice Code of Kosovo. Not included in this content analysis but nonetheless central to the pro- visions for the criminalization and prevention of child abuse, is the Juvenile Justice Code of Kosovo. The Code provides the legal framework addressing prevention of abuse and child protection. Additionally, the Kosovo Strategy and Action Plan for Children Rights 2009-2013, is the key document that addresses the child rights per- spectives in Kosovo. According to Kosovo’s 2001 Policy Statement on Social Services, in terms of the organizational strucutre for child social protection, “the Ministry of Labour and Social Welfare (MLSW) is the responsible state body appointed for organizing social and family services provision along with local government units. MLSW is responsi- ble for overseeing provision of social and family services throughout the territory of Kosovo. Furthermore, the Ministry of Local Government and the Ministry of Econ- omy and Finance are responsible for coordinating the overall process of transfer of competencies from the field of social and family services in the municipalities and must ensure that this process is in full compliance with legislation in Kosovo”. The Policy Statement on Social Services specifies that all municipalities in the territory of Kosovo are responsible for provision of social and family services through their Centers for Social Work, and other governmental and non-governmental institutions, under the supervision of MLSW. These Centers are municipal public institutions competent for the protection of citizens with social need (i.e. a child without parental care; a child with antisocial behavior; distorted relationships in the family; individu- als at risk of mistreatment or abuse; and individuals who are victims of family vio- lence). Figure-1 (appendix-1) describes the governance and administrative structure of MLSW until the moment of transfer of competencies to the Municipal Directorate for Health and Social Welfare (MDHSW). Conclusion The vast landscape of policy documents, frameworks, strategies and laws per- taining, directly and indirectly to ECD is clear indication that Kosovo is committed to its children. The review of the policy landscape, based on the accessible and avail- able documents37, demonstrates that the education sector appears to have a com- prehensive set of guidance for ECD. Cumulatively, these documents cover important aspects linked to young children’s learning and education. Second, an alignment or cross-reference across sector documents was not noted. Each set of policy docu- ment appears to be directly linked to its own sector with little to no mention of allied programs and services, or even policy monitoring, that could be occurring under the aegis of other sectors. Finally, the legal framework for alleviation of social problems appears to be a distinctive characteristic of the Kosovo Strategy. It was noted that there are a range of laws that have been endorsed with respect to social problems facing young children and families and that this legal approach is one that is consist- ently adopted by Kosovo. 37 It should be noted that the documents reviewed were made available to the study group and accessed online. We are unsure if they are representative of Kosovo’s social policy documents. 63
  • 65.
  • 66.
    PART 3 RECOMMENDATIONS FOR ECD PROGRAMS AND POLICY IMPLEMENTATION
  • 67.
    Kosovo intends tobuild a strong ECD program. In response to that aim, Part 3 of this report uses the findings of the situation and policy analyses in Parts 1 and 2, respectively to identify the ECD needs and suggest recommendations. The cur- PART 3 RECOMMENDATIONS FOR ECD PROGRAMS AND POLICY IMPLEMENTATION rent situation of child outcomes demonstrates that there are areas not addressed by current programs and policies. Two categories of recommendations are presented in this section of the report as a response to this gap or unmet needs. These recom- mendations are supported by the evidence of effective ECD. The first category of recommendations addresses the programmatic aspects of ECD. The second cat- egory of recommendations addresses governance dimensions of ECD to ensure ef- fective and cohesive programming. Taken together by addressing programming and policy, it is anticipated that Kosovo will ensure that all young children develop to their fullest potential. ■■ Area 1: Achieving equity in ECD: A Program for Kosovo ■■ Area 2: Strengthening Governance for ECD Area 1: Achieving Equity in ECD: A Program for Kosovo Kosovo is keenly interested in moving forward a strong program for ECD. To that end two recommendations are presented: ■■ Recommendation a: ECD Parenting Program ■■ Recommendation b: Early Learning Program The first part of this chapter provides the overview for the programmatic recom- mendation. The second part of this chapter addresses the first recommendation of parenting programs. The third part of this chapter describes the early learning mod- els. The last part of this chapter presents preliminary and initial cost estimates for the parenting and early learning programs. For the ECD centers, the costing is based on a pilot analysis of a few existing ECD centers in Kosovo combined with costing experience in other countries, whilst the financial analysis of the parenting program is based entirely on the international knowledge base. Hence, it should be empha- sized that this analysis cannot be used as the immediate starting point for concrete planning. The policy community in Kosovo should define these two programs fur- ther, with respect to program characteristics that are most suited for Kosovo. The analysis presented in this report could be used as the first indication of the costs as it provides information on the feasibility of the programs and data to support further decision-making. Overview of Program Recommendations The goal of the ECD program is to ensure equity in ECD outcomes for all chil- dren in Kosovo. First described is the definition of equity and its dimensions fol- lowed by a description of the recommended ECD Program. 66
  • 68.
    Equity in ECD Equity in ECD can be understood with respect to equitable access and oppor- tunity for quality programs and services. While access has been a primary thrust, PART 3 RECOMMENDATIONS FOR ECD PROGRAMS AND POLICY IMPLEMENTATION guiding action towards reducing disparities in opportunities for young children, it can be considered a limited approach to improving equity in ECD (Britto, Yoshi- kawa & Boller, 2011). Only focusing on expansion and access to ECD can lead to limited success because providing more access to ECD services is not always ac- companied by improvement in quality of services. Research shows that the quality of programs is the key ingredient linked to improved child learning and development. Therefore the recommendations for the ECD program in Kosovo is that it focuses both on increasing access and quality of the programs as a vibrant and bold strategy to improve early child outcomes as a right and a predictor to later success. Recommended ECD Program Presented in the introduction of this report was the evidence that between birth to 6 years of age, children present different phases of vulnerability and opportunity, based on the age of the child. In addition, the role and influence of the contexts and situations within which the child lives also varies by age. For the youngest children, the primary caregiver or parent is the most important influence. The infant is completely dependent upon this adult or key adults for their survival and development. As the infant grows, gains mobility and starts to explore her/his surroundings, she/he starts socializing with other individuals and the influence of other adults, peers, and contexts starts to grow. Therefore from a developmental perspective, designing an ECD program requires atten- tion to the needs, vulnerabilities and opportunities for development of the growing child. However, other considerations, beyond development need to be accounted for in developing a program. The second, consideration is sectoral involvement in ECD. In Kosovo, the health, education and social welfare sectors are most involved in pro- grams and services for young children and families. These sectors are important to include if the programs are to be sustainable and scaled up. A third consideration in ECD programming is ensuring that children and families receive consistent good quality services. For example, it has been noted in several countries, that when one sector takes the lead in programming for a specific age group and another sector for an older age group, in the transition often, either chil- dren loose access to services or the programs are not consistent in their content. As a result the children and families are disadvantaged. In the recommendations presented in this chapter, ways in the ELDS can be used to ensure consistency and quality across parenting and learning programs are suggested. Based on the aforementioned considerations, a program for ECD is recom- mended that consists of parenting and early learning programs, the content of which is informed by ELDS (see figure 23 below). 67
  • 69.
    Figure 23. Overviewof Recommendations for ECD Programs and Policy Implementation Child age in years 0 1 2 3 4 5 6 PART 3 RECOMMENDATIONS FOR ECD PROGRAMS AND POLICY IMPLEMENTATION Parenting Programs Early Education Programs (Lead by Health Sector) (Lead by Education Sector) Social Welfare & Child Protection Sector ELDS (ensures quality and continuity) As illustrated in the figure, age of the child is present in two age brackets, birth to 3 years and 3 to 6 years. For the birth to 3 years age bracket parenting programs supported by the health sector are recommended. For the 3 to 6 years age group, early learning and education programs are recommended supported by the educa- tion sector. It should be noted that at 3 years of age, both health and education sec- tors are noted for their involvement. The implication of this involvement is to ensure that no families “fall through the cracks” in the transition between parenting and early learning programs. Furthermore it should be noted that while health and education sectors take the lead for parenting and early learning programs, respectively, they do not do this alone. Each type of program while lead by one sector is supported by the other sector. This design ensures that both health and education sectors are involved in the ECD program, but their role will vary depending on the type of pro- gram. This sectoral involvement has been suggested to ensure cohesion for the ECD program. Given that the rural poor families and those from ethnic minority groups are the most disadvantaged, the Social Welfare and child protection sector is involved throughout the entire age span, with a targeted focus on the disadvantaged popula- tions. This sector will work along side the health sector in the first 3 years and along side the education sector in the next 3 years ensuring that quality parenting and early learning programs are accessible to the most disadvantaged children. Finally, as per this model, the ELDS can provide the consistency and cohesive- ness that is required for an effective ECD program. ELDS were developed in Kosovo for children from birth until 6 years of age. Therefore they are the perfect tool to align the content of the program as they are developed in keeping with local expectations and values and cover the entire age span. Moreover representatives from the health and education sectors were involved in the development. With respect to costs and without compromising on quality, a series of cal- culations are presented on the assumption that age 3 is the transition year and the service providers who provide parental support hand the child over to the teachers of the ECD centers during this time. However, in keeping with the lead and sup- port sector model, described above, to ensure cohesion across services, the costing model used for the ECD centers assumes that the teachers have some time avail- able for interaction with parents, so that parental support does not stop altogether. It should be kept in mind that if access to the ECD centers is not universalized, parental support should be continued until 6 years of age. Finally, this model also makes note to the issue of universalization of programs regarding children 5 years of age. The current ECD centers include this age group. However, nationwide 70% of them are 68
  • 70.
    in the pre-primaryyear. To avoid that children enter grade one of primary school with too many different “educational histories” (from an ECD center; from the pre-primary year; from kindergarten), it seems best to aim for the universalization of the pre- PART 3 RECOMMENDATIONS FOR ECD PROGRAMS AND POLICY IMPLEMENTATION primary year, and to restrict the target group for the ECD centers to ages 3 and 438. Recommendation a: Parenting education and involvement We now turn to the first programmatic recommendation; that of a strong parent- ing program for families with children 3 years of age and younger. The recommen- dation is presented in 3 parts: the rationale for this recommendation based on the current situation in Kosovo; the empirical evidence in support of the program and a description of the program. The results of the study indicate that the greatest areas of inequity are for chil- dren living in poverty. As demonstrated in the report, poverty in Kosovo is linked with the geographic region of residence, i.e., the rural population is greatly economically disadvantaged compared to the urban population, and ethnic background, i.e., eth- nic minorities represent a larger percentage of low-income families. The results of this study clearly indicate that poverty levels among the rural population in Kosovo are high and tend to be increasing, thereby raising attention to the growing disparity. With respect to a policy response to this situation, while the Participatory Strat- egy Development for Education for Rural People and the Strategy for the Integration of Roma, Ashkali, and Egyptian Communities, does address this situation, it clearly falls short of achieving the objective with respect to ECD. The policy directives provided in these strategies are not sufficiently specific in their recommendations for young children. The government, through the Participatory Strategy Develop- ment for Education for Rural People, provides a framework to promote inclusion of rural communities and promote mechanisms to increase access to quality educa- tion. However, the specified activities targeted directly towards the young children are meager. Young children are the most vulnerable to poverty shocks and the most effected by household economic well-being and environment. Additionally, their needs and vulnerabilities are unique and cannot be subsumed under adult response to poverty. For example, according to the Participatory Strategy, “the main problem associated with participation in preschool in rural areas, is one of demand rather than supply.” Although not all primary schools in the study have preschool classes, in those villages where preschool education exists, many children do not attend. The main reason for the low enrolment appears to be the low uptake of services due to parental lack of interest or that the school is too great a distance for the young child to walk. Our interviews with parents in a rural community of Zvecan, supported the latter view. Difficulties in transportation and physical access to the centers were the main concern of the parents’ regarding their children’s continuing participation in a preschool program. Despite the knowledge of predominant challenges, the Par- ticipatory Strategy does not address mechanisms to overcome the infrastructural hurdles nor does it consider initiatives to promote and facilitate parental involvement. Based on our findings in rural and ethnic community minorities, one clear entry- point for the ECD program is parental education. The importance of parental educa- 38 The costs of universalizing the pre-primary year will as such not be estimated in this chapter since this is not a new policy. As was noted earlier in this report, enrolment in the pre-primary year has stagnated at around 70% for too long, and closing the final gap of 30% should be accomplished soon. 69
  • 71.
    tion for childdevelopment is widely agreed and accepted (Engle et al, 2007; the Con- sultative Group on Early Childhood Care and Development, 2010). Parents and key caregivers have been recognized as the most important influence on development in PART 3 RECOMMENDATIONS FOR ECD PROGRAMS AND POLICY IMPLEMENTATION the early years. The great strides the infants, toddlers and young children make in the areas of growth, health, learning, cognition, language, social and emotional de- velopment are facilitated by the key adults in their life. It is these primary caregivers or parents who create opportunities for development and learning, who through their responsive and supportive care and nurturance ensure that children are healthy and well cared for. The importance of parental involvement in ECD is well documented and the empirical evidence is strong. In all three main areas of ECD, -protection, health and learning-, Part 1 of this report indicated a series of problems where parental education can contribute to amelioration. For example: ■■ Under-5 mortality. The number of children that die before the age of five is un- acceptably high in Kosovo. Reducing it requires a palette of strategies. While some of these can be expensive, others such as healthy practices and hygiene at home, and breastfeeding require no other investment than that in education for parents, and are evidenced to be not only cost-effective, but also with a posi- tive sustained impact on child outcomes. ■■ Early learning. If parents learn a few relatively simple principles and techniques on how to interact with their children during the first years of their lives, they can have a big and positive impact on cognitive development, at much lower costs than that of enrolling them in kindergarten. ■■ Child labor. To some extent this can be reduced by poverty alleviation, but in Kosovo, it has an important cultural component. Changing parents’ knowledge, attitudes and behavior is key in combating child labor. Based on the situation and policy analysis, Kosovo does appear to be ready for developing and implementing a parenting program. There are some policy pro- visions that recognize family involvement. For example, according to the MEST education strategy, “…. every education institution should be aware that without a good cooperation with families there can never be a successful work in education process, so, one of the priorities of the work of each institution should be effort to a good cooperation….” This strategy underscores the importance of parents in rec- ommending that a close collaboration should be strengthened between schools and families. However, some of the other policies, though highlighting the importance of parenting, appear to show some inconsistencies and lack of clear direction. For example, the Law on Preschool Education clearly recognizes that parents have the right to select a preschool program for their children in public or private institution. However, it also states that the way of selecting the programs will be regulated with administrative instruction. These two statements either contradict each other or limit parental choice. Secondly, even though the Law for Preschool Education provisions for education within the home for disabled children who cannot attend school, it does not provide details on which entity is responsible for organizing this service for the family. Other contradictions and unclear areas include fees for programs and responsiveness of the preschools towards the families. The parenting program should have multiple goals and a broad vision, including improving parenting skills and the capacity of parents to take care of their children and feel empowered in that role. The program should strive to increase parental par- 70
  • 72.
    ticipation in childrearing, and support their active role as such. The role of fathers as parents needs to be considered and incorporated into any parenting program. The program should also focus on improving the skills of professionals who provide PART 3 RECOMMENDATIONS FOR ECD PROGRAMS AND POLICY IMPLEMENTATION the parenting services directly to families and children. Parenting programs for vul- nerable and disadvantaged families should place a special emphasis on intensive and culturally appropriate curriculum that can be delivered through a home-based program by well trained and supervised service providers. These programs should focus on the issues facing the rural poor and ethnic minority families as to ensure that the children achieve strong and healthy outcomes. While the vision of the program does need to be developed further, one consideration is to include measurable as- pects that can be achieved by 2015. These measurable outcomes could include: im- provement in child health, nutrition, development and learning; increase in parents’ knowledge, practice and attitudes; increase in the number of trained and supervised service providers; parenting materials based on ELDS; increase in access to the par- enting program of vulnerable and disadvantaged groups. The parenting program should be universal serving all parents and children up to 3 years of age. Targeted emphasis should be given to the rural, minority and eth- nic groups. A two generation program model might also be considered. The two generations, parents and children both receive services simultaneously. The focus of the parent component is on stimulation, support and care giving of the child while the focus on the child generation is on the development of children. The program should be institutionalized over the next 3 years, which suggests that parents should be more involved in the development of the programs. Research has shown that a main feature of program sustainability depends on parenting involvement in the de- velopment and ownership. Therefore as the scope and coverage of the program is being determined, parental involvement in the development, in particular from rural and ethnic minority groups needs to be considered. A key feature of the parenting program is the mode of delivery. There are sev- eral models of parenting programs, some are home-based, others use groups and still others operate out of community or clinic centers. The modality of the program is important because it is linked with participation. Therefore determination of the modality should be made based on what is culturally acceptable, meets the needs of the parents and is resource-feasible (financial and capacity). It is recommended that community-based approaches with home visiting programs will be a suitable modal- ity for the parenting program. Over the 3-year age span the frequency of the home visits can decrease, however the community based parent group meetings should continue. For working parents these parent groups could be held at the work place in lieu of the community. Father parent groups should also be stressed. The empirical literature also provides information on what elements make for effective parenting programs. These elements should be considered in the devel- opment of the Kosovo parenting program. For example, cultural sensitivity is a key feature of successful programs. Therefore creating and implementing a program that adapts to the community is important. The “dose” of the program is another feature of effectiveness. This includes the frequency and intensity of program delivery. Pro- grams need to be easily accessible. However, more importantly parents have to be motivated to stay in the program. From a program development perspective, priori- ties should be set up and ensured of a systematic plan for roll out and scale up. This plan should certainly include a monitoring and evaluation component. The program should be based on standards, which can be drawn from ELDS. 71
  • 73.
    The sustainability ofthe program is very important. While the financial sustain- ability is addressed later in this section through a preliminary and initial cost analysis, provided here are lists of resources that are currently available to implement the pro- PART 3 RECOMMENDATIONS FOR ECD PROGRAMS AND POLICY IMPLEMENTATION gram. With respect to parenting materials and curriculum there are resources that could be used. The coordination group for parenting has produced leaflets, CDs etc. materials for parenting, which could be used for the parenting program. Secondly, every preschool program has a curriculum that links with parenting. Even though it is not a parenting program per se, it does offer the initial content to develop a parenting program. The ELDS could be used to develop parenting activities, as these stand- ards are already valid for Kosovo. There are technical resources, such as existing social and professional organizations that can contribute to the design and content of the programs. Finally, lead Ministry of Health and supportive ministries of Educa- tion and Social Welfare will have to be involved. As each ministry has knowledge of resources and materials that are available. There is legislation and there are stand- ards in place to support the development and content of the parenting programs Another feature of program sustainability is the location where services can be delivered, and availability of strong partners. In this area also there are currently available resources that can be built upon. For example, the School Parent Teacher Councils could serve as an implementing partner, given the high rates of primary school enrolment. Health institutions could serve as a viable site for the parenting group sessions. For example the Institute of Public Health is promoting parenting groups in schools for health promotion. These programs can be expanded to ECD. There are several NGOs also involved in providing parenting programs, Balkan Sun- flowers, Red Cross volunteers and Health Mediators, for example, have been ac- tive before in the more intensive modalities for parental education. There are other NGOs working with parents of disabled children through parenting groups. These NGOs could be an excellent resource and potential location for conducting parenting groups. In setting up the ECD parenting program, Kosovo will face a set of challenges. These are briefly described below with the intention of ensuring the long-term sus- tainability of the program. As was indicated by the participants during Phase 3 of the study, there appears to be a lack of commitment on the part of key decision makers in developing a parenting program. This issue will need to be addressed, as politi- cal will is necessary for the development of this program. It appears that in part the limited commitment is linked with limited awareness and knowledge of the impor- tance of parenting. Therefore key partners will have to work towards developing an advocacy and awareness strategy to educate key policy makers on the importance of parenting. Other types of challenges are also seen by other countries that have moved forward with a national ECD program. These include lack of financial capac- ity and technical resources. Furthermore it is indicated that in Kosovo there is limited literature on professional development. These are aspects of investment that will need to be considered in the development of the parenting program. In order to get the ECD parenting program initiated the following immediate next steps are recommended. First, a database of existing resources needs to be created. There appear to be some resources available for such a program. How- ever, information on these resources is unclear. Therefore, with the intention of build- ing on what currently exists, such a database will help provide information on gaps in resources and needs for moving forward. This database can be created by a pro- fessional organization documenting what programs exist, what their content is, what training models are available and what populations are being served. Secondly, a 72
  • 74.
    parenting program workinggroup should be convened with representation from min- istries and agencies that are interested in moving the program forward. This working group could be part of the early childhood education committee or a health promo- PART 3 RECOMMENDATIONS FOR ECD PROGRAMS AND POLICY IMPLEMENTATION tion committee. Thirdly, the group should consider conducting a feasibility study to understand what would be required to implement an ECD parenting program. The government could also partner with local organizations that have piloted programs, shown to be promising among young children and mothers in Roma Ashkali and Egyptian communities, as part of the feasibility study. Also to address the lack of awareness of the importance of parenting, it would be important to launch an advo- cacy campaign for policy makers and key decision makers. Costing of Parenting Programs We now turn our attention to estimating costs for the suggested description of the parenting program. As was noted earlier, given that there were no parenting program models on which we could estimate costs, we have relied on program char- acteristics based on international experience. The assumption for the costing takes into consideration existing international parenting program models. The costing is estimated for programs that serve families with children from birth to 3 years of age. Parental support is best delivered through two modalities in parallel: ■■ arental education in groups of 20 parents maximum; P ■■ ome-visiting on an individual basis39. H The table below indicates the frequency of both the group sessions and the home visits on a monthly basis. Note that this frequency differs by age. Table 6. Parental support Parental support: number of groups sessions and home visits per month, by age Parental education in groups Home visiting Pregnancy (last six months) 0 1 Age 0 1 2 Age 1 1 1 Age 2 1 1 Source: Yale University, The Edward Zigler Center of Child Development and Social Policy (2011). In addition to this service delivery scheme, there are a number of other assump- tions that codetermine the costs. Extra time Both the moderator who leads the group sessions and the professional that visits the home need some extra time for preparation, consultation of colleagues, interaction with others in the community, travel, et cetera. For the moderator this extra time amounts to two hours (per session of two hours) and for the home visitor it amounts to half an hour (for each visit of one hour). 39 In some cases, programs provide for individual counseling that takes place in a center (where the group sessions also take place) instead of in the home. This reduces the costs since the counselors need less time to travel, but creates a higher threshold for participation. Moreover, various aspects of parenting are best explained and/or trained in the home, while it is also important that the counselor visits the home at least some times in order to assess the environment in which the family lives and the child grows up. 73
  • 75.
    Salary and caseload For the moderator we assume a normative salary of €300 per month and or the home visitor €200 per month. In practice, the salaries are likely to be lower since PART 3 RECOMMENDATIONS FOR ECD PROGRAMS AND POLICY IMPLEMENTATION both the moderator and the home visitor may be part-timers, or combine this job with other work. Theoretically, the maximum caseload for the home visitor is about 10040. But with such a large number of families, it is impossible for the home visitor to get to know their clients well, familiarize with their home situation, and develop strong ties. On the other hand, with a caseload of only 10, the program becomes very inefficient as the costs of supervision and initial and refresher training (see below) become disproportional high. Therefore it is assumed that the average caseload of the home visitors is 40. Supervision of moderators Both the moderator and the home visitor will benefit greatly from supervision by an expert, e.g. from the Pedagogical Faculty. We assume a salary of €350 for this su- pervisor. The moderator, who is a well-qualified expert her/himself, would receive on- the-job supervision twice a month during a quarter of a day41. Theoretically (assum- ing a fulltime job) this results in a caseload for the supervisor of 40. Again, in practice it may be a part-time job for the supervisor who may combine this, for instance, with work at the Pedagogical Faculty, but in this case this does not affect costs. Supervision of home-visitors The home-visitors do not necessarily have the same level of initial education and training as the moderators, and need more intensive supervision. We assume one day per month on average, but divided over several shorter learning sessions, both on-the-job and off-the-job, perhaps partly in smaller groups. Thus, the supervi- sor of the home-visitors can attend 20 home-visitors on a monthly basis. Initial and refresher training We assume 10 days of initial and 10 days of refresher training per year for the moderator, and 25 days of initial and 25 days of refresher training per year for the home-visitor, again from a professional who earns €350 per month. Also, we assume 2 extra days per 10 day training for preparation, as well as a group size of 20 mod- erators or home-visitors. Much higher than the costs of the trainer are the costs of forgone salary for the moderator and home-visitor; they should be paid during the training. 40 The calculation is as follows. The number of visits per family depends on age, but the average is (1 + 2 + 1 + 0.5) / 4 = 1.1 per month. As each visit takes 1 hour plus half an hour for preparation and travel, the total amount of time per family is 1.1 * 1.5 = 1.65 per month. Since one month contains about 4 weeks of 40 hours each, the total amount of time available is 160 per month, which is about 100 times the time needed per family per month. 41 In remote areas where a lot of travel time is needed, this could be replaced by one supervision session per month during half a day. 74 This makes no difference to total costs.
  • 76.
    Materials and space The group sessions are held in a central space, e.g. a community center, ECD center, local health center, or school. This leads to assumptions regarding expendi- PART 3 RECOMMENDATIONS FOR ECD PROGRAMS AND POLICY IMPLEMENTATION ture on rent or refurbishment, inventory, maintenance and materials. Unit costs and overall outcomes The parameters above have been inserted in a cost simulation tool developed for and available at UNICEF Kosovo. With the use of this tool, different models (with different values for the parameters) can be entered. This can be a helpful exercise in the further development of the parental support program. For now, we report the final outcomes of this exercise based on the parameters that were presented above. These outcomes are summarized in the table below. Table 7. Parental support – unit and total costs From unit costs to total costs Unit costs of parental education in groups: per parent per year € 5,50 Unit costs of home visiting: per family per year € 28,80 Total unit costs per parent/family per year € 34,30 Total unit costs per child42 per year € 17,15 Number of beneficiary families: 32,000 * 3.7543 120,000 Total costs of including all Kosovar families: €17,15 * 120,000 € 2,056,321 It can be seen from the table that the total costs of parental support are in the order of magnitude of € 2 million, which is much lower than the € 12.6 million needed for the ECD centers (see recommendation 2). This illustrates the high cost- effectiveness of parental support. Through a relatively small number of intense learn- ing sessions and home-visits, it provides a quality impulse to the primary educators: the parents. They are the ones who do the job of educating their children on a daily basis. Investing in them is investing in their children.4243 42 If a family has more than one child, the parents do not have to go through the programme again and again. Once is enough. Hence, we divide the 120,000 by the number of children per family. This stood at 2.38 in 2008 according to the World Bank. Given the downward trend in fertility, we round off to 2. Fertility rates among certain minorities such as the Roma, Ashkali and Egyptian population are usually higher. This does not affect this calculation which is at macro-level, but it should be kept in mind during the concrete implementation of the parental support program. 43 The total number of newborns was estimated at 32,000 per year (see preceding section non ECD Centers). This figure must be multiplied by the number of age cohorts that are in the programme at any given time. This number is 3 (ages 0, 1 and 2) to which we must add three quarters of a year for pregnancy. This makes 3.75 age cohorts. Multiplication of 32,000 with 3.75 gives us the number of (born and unborn) children in the program (120,000). 75
  • 77.
    Figure 24. Costingsimulation tool for parenting program KOSOVO SIMULATION TOOL PART 3 RECOMMENDATIONS FOR ECD PROGRAMS AND POLICY IMPLEMENTATION PARENTAL EDUCATION IN GROUPS. HOME VISITING. From pregnancy to age 3 From pregnancy to age 3 Visitor’s normative fulltime salary: Moderator’s normative fulltime salary: Salary / month 200 Salary / month 300 Salary / year 2400 Salary / year 3600 Normative hours fulltime job: Normative hourse fulltime job: Hours / day 8 Hourse / day 8 Days / week 5 Days / week 5 Weeks / year 45 Weeks / year 45 Hours / year 1800 Hours / year 1800 Salary costs per visit: Salary costs per se ssion: Salary / hour 1.3 Salary / hour 2.0 Hours / visit 1.0 Hours / session 2.0 Extra time / visit 0.5 Extra time / session 2.0 Salary cost / visit 2.0 Salary cost / session 8.0 Number of visits per month: Number of sessions per month: Pregnancy 1.0 Pregnancy 0.0 Age 0 2.0 Age 0 0.0 Age 1 1.0 Age 1 1.0 Age 2 0.5 Age 2 1.0 Visits / month av. 0.6 Visitor’s salary Sessions / month av 0.3 Moderator’s salary per family per year per parent per year 14.6 Families per visit 1 Group size 20 1.4 Salary costs of supervisor: Salary costs of supervisor Salary / month 350 Salary / month 350 Salary / year 4200 Supervision costs Supervision costs per family per year Salary / year 4200 per parent per Case load 20 5.3 Case load 40 year 1.1 Families / visitor 40 Groups / facllitator 8 Costs of initial/refresher training Costs of initial/refresher training Salary costs of trainer: Salary cost of trainer Salary / month 350 Salary / month 350 Salary / day 18 Visitor’s training Salary / day 18 Training days / year 10 per family per year Training days / year 10 Extra days / training 20 2.9 Extra days / training 2 Visitors / training 20 Moderators / training 20 Costs trainer / visitor 11 Costs trainer / mod. 11 Visitor’s forgone time: Moderator’s forgone time: Moderator’s Train. hours / year 80 Train. hours / year 80 training Salary / hour 1 Salary / hour 2 per parent per year Forgone salary 107 1.1 Forgone salary 160 Home visiting per family per year Materials / parent / yr 1 22.8 Facility Rent of space per yr. 1500 Invenory 500 Parental education and home Life cycle (in years) 15 Materials and visiting per parent/family per Maintenance / year 100 facility yr. 27.3 per parent per year Beneficiaries Sessions / year 600 1.5 60,000 Parent education Per parent per Total annual costs year 4.6 1638634 76
  • 78.
    PART 3 RECOMMENDATIONSFOR ECD PROGRAMS AND POLICY IMPLEMENTATION Recommendation b: Improving Early Childhood Learning and Education An inalienable right for all children – is the right to education. An unequivocally accepted premise is that the strongest foundation for building human capital is the early years and early education. Kosovo has both ratified the CRC and is also in ur- gent need to build its human capital resources, hence investing in early learning and education appears to be a viable and important strategy for Kosovo. The recom- mendation for improving early learning is rooted in the findings of the current study and the empirical evidence in support of learning. Also presented are strategies to improve and scale up early learning programs for children 3 to 6 years of age (see figure 23). There are two sets of findings that are linked with this recommendation. The first set is linked with enrolment in early learning programs and the second is linked with school survival. With respect to early learning, findings are presented for the public pre-primary year (5 to 6 years of age) and the preschool year (3 to 5 years of age). For the pre-primary year, an estimated 70% of children are enrolled in these programs. While the overall enrolment rates are acceptable, the study findings indi- cate that poverty and exclusion of ethnic minorities in pre-primary learning are high. As indicated in Part 1 of this report, children with an ethnic minority background comprise only 2% of the early education population. Therefore the issues in pre- primary enrolment are high inequity and marginalization of ethnic and rural poor chil- dren. With respect to preschool enrolment (3 to 5 years of age) the overall enrolment is very low. At best this can be estimated at 12%, but more realistic estimates put it in single digit. Therefore the main issue related to preschool education, which is pro- vided by public private, community and NGO programs, is an overall low enrolment. The second set of findings that is important to consider is the low rate of secondary school survival in Kosovo. It is estimated that about half of the children who walk in through the school doors in 1st grade graduate from upper secondary school. This statistic indicates that the school system is losing half its student body and that only half of the children who enter school leave with a diploma. This statistic suggests great educational inefficiency and an unacceptable number of children dropping out of the education system. These findings provide compelling evidence for improving the quality and access to early learning programs. Juxtaposed against this situation, we also provide findings from the policy anal- ysis with respect to early learning programs. We first focus on the low rates of ethnic minority enrolment and policy situation. The government of Kosovo, through the Strategy for the Integration of Roma, Ashkali, and Egyptian Communities, presents overarching objectives to prevent discrimination and promote education among eth- nic minorities. Although it is beyond the scope of this report to evaluate the extent of the implementation of the Strategy, it is clear that the provisions therein are lim- ited in scope when it comes to young children. Specifically, four activities can be identified that address preschool education: 1) a needs assessment for preschool and pre-primary education; 2) qualified educators and their assistants are identified from the ranks of Roma, Ashkali, and Egyptian communities and their inclusion as service providers in the education system; 3) incentives and financial assistance is offered to future educators for study, work and practice; and 4) accredited programs. 77
  • 79.
    If fulfilled, theseactivities are likely to increase early childhood education among Roma, Ashkali, and Egyptian children. However, a distinction needs to be made between long and short-term objectives for the provision integrated ECD services PART 3 RECOMMENDATIONS FOR ECD PROGRAMS AND POLICY IMPLEMENTATION among these communities. There is urgency to promote equity in education among ethnic minorities. This urgency requires feasible short-term activities that start the process of integration and cultural customization of early childhood development programs immediately. Secondly, we look at overall enrolment rates in pre-primary and preschool and the policy analysis. In the KESP, the government of Kosovo has expressed the am- bition to expand coverage in pre-primary education from 70% in school year 2011- 2012 to 90% in 2013-2014; universal access is foreseen by 2015-2016. For pre- school education, the targets are 15% for 2011-2012, 35% in 2013-2014, and 50% in 2015-2016. This strategy ranks in the top 10 dominating sub-sector targets and 7th in the budget allocation within the priority areas. However, even though this expansion is stated, the sector efforts and budgets are dominated by school infra- structure for pre-university, which ranks highest by receiving almost half (40%) of the total budget. Furthermore, activities, tasks and responsibilities to achieve short, medium and long-term goals are specified but actors and responsible institutions are not. KESP outlined central agencies in education44 and some activity-specific stakeholders, but did not present systematic role/responsibility and accountability assignments. It is imperative that the government of Kosovo commits the resourc- es necessary for the expansion or pre-primary and preschool education and that it works jointly in the implementation of the expansion process with municipalities. The targets for pre-primary education seem appropriate. Universal access is highly urgent because at an enrolment rate of 70% in the preparatory year, an edu- cation system will increasingly adjust to the level of the enrolled majority, putting the excluded children at an even bigger distance. Compared to the high unit costs in full-day kindergarten, the costs per child in pre-primary education are low. At the same time, the economic and human benefits that accrue from the small investment in the children that are presently excluded from pre-primary education are much higher than the returns on the costly investment in the already privileged children in kindergarten. This justifies a policy of raising the fee in kindergarten in order to mo- bilize resources to support the expansion of pre-primary education to all children. It is also recommended to make the pre-primary year compulsory once enough places have been created to receive all children. For preschool education, the targets are less ambitious: 50% by 2011-2013. This seems understandable, given the high unit costs in kindergarten. Indeed, the assumption of the KESP is that most of the new places for children will be created in the private sector, necessitating a relatively small extra investment of €0.7 million of annual recurrent costs (apart from investment costs). However, the expectation that private kindergartens will expand rapidly is not realistic. The public kindergarten is so well-resourced yet inexpensive for the families, that there is no demand, and hence no market, for private kindergartens. The total capacity in private kinder- garten is very limited. None of these institutions have a valid license at present, no statistical data are kept, and there is no active policy to boost enrolment. The lack of regulation of the private sector in early childhood education raises red flags for the quality of the programs. 44 KESP outlines the central agencies in education, MEST, Kosovo Accreditation Agency, National Qualifications Authority, State Council for Teacher Licensing, National Council for Curricula and Textbooks, National Matura Council, Council for Vocational Education and Training for Kosovo (CVET), Kosovo Education Parents’ Council, State Council of Higher Education, National Research Council, 78 University of Prishtina, National Research Council Municipalities
  • 80.
    Therefore, a strongeffective and early learning program that supports increased enrolment in preschool and pre-primary with the goal of improving school survival in upper secondary, is required. The literature on school readiness suggests that chil- PART 3 RECOMMENDATIONS FOR ECD PROGRAMS AND POLICY IMPLEMENTATION dren who attend quality early learning programs are more likely to succeed in primary school, not repeat grades and graduate from upper secondary school. School readi- ness is comprised of 3 dimensions: children ready for school; families ready to send their children to school and schools ready to receive children. In the previous rec- ommendation we addressed parenting which feeds into the families ready for school aspect of this definition. In this recommendation we tackle the aspects of ensuring that children are ready for school and that schools are ready for children. As is clearly demonstrated by empirical evidence, attending high quality effec- tive programs in the early years is linked with better school transitions, better primary school grades and a great likelihood of upper secondary school graduation. The data also indicate that children who are most disadvantaged benefit the most from early learning ECD programs. Furthermore, sources state that enrolment of children in playgroups by the age of three is essential for favorable development (Engle et al, 2007; the Consultative Group on Early Childhood care & Development, 2010). There- fore implementing effective early learning programs appears to be a strong strategy for overcoming low rates of ethnic minority enrolment in pre-primary, improving pre- school attendance and reducing school drop out rates. The overall vision would be to ensure that all children in Kosovo between 3 to 6 years of age have access to quality effective early learning programs. This program would strive for greater inclusion to ensure that ethnic and rural poor children have access to services. The primary modality of this program could be community-based centers that are financially sustainable and owned by communities. Effective early learning programs have components of modality, curriculum, staff training, teacher- child interaction, physical space, etc. that need to be addressed. We provide specific recommendations for each of these components. It is recommended that the early learning program be implemented through half-day programs in community ECD Centers. This is by far the most realistic op- tion, to expand enrolment from age three onwards, especially for the children who need it most and are likely to be found among the rural poor and ethnic minorities. The experience in similar countries is that such programs are three to six times less costly than full-day kindergarten (van Ravens, 2010). Often, such centers are called “community-based’, suggesting that it is the community who bears all costs (i.e. the municipality, the parents and possibly some local stakeholders). While this tends to work in the less disadvantaged contexts, it fails in communities where poverty rates are too high. Given the bleak statistics in Kosovo in this regard, many rural and ethnic communities will require some degree of government support, even if the community can still make some contribution as well, in money and/or in kind. An economic ben- efit of ECD programs is women employment, not just in the centers but also mothers are freed up to work, thereby stimulating local economies. This creates strong argu- ments for a government to invest in community-based ECD: not just to enhance child development, but also to stimulate rural development more directly. Because of the success that these centers have in some other countries in the region, it is recommended to revitalize the movement of community based ECD centers in Kosovo, but without repeating the mistake of the past: a small per capita contribution from the government for every child in such a center may make all the difference. Exactly how much that per child contribution from government must be requires a more detailed costing study, even though initial and preliminary estimates 79
  • 81.
    are provided inthis report. It may then appear that the contribution can vary: higher in areas that are poorer, more remote, more linguistically diverse, et cetera; and lower elsewhere. But even in the absence of such detailed costing, it is very likely that half PART 3 RECOMMENDATIONS FOR ECD PROGRAMS AND POLICY IMPLEMENTATION a dozen or more children can attend half-day programs for the amount of money that the government now contributes to one single child in kindergarten. With respect to the quality and the content of the program there are several recommendations that address the primary language of instruction and the inclusion of ELDS as a quality improvement tool. As per the Law on Preschool Education, the language of instruction is Albanian. However, in areas of large ethnic minorities, local languages should be used. It also states that educational programs for preschool children should be based on general curriculum approved by MEST, Experts Council and School Textbooks but schools can develop their own curricula objectives based on this general guidance. In effect, preschools have quite a bit of freedom with re- spect to how they interpret and apply the general curriculum. This is a very good provision, as it will for example allow for cultural accommodations. However, what is missing is a stronger provision to ensure that there is equity in quality of programs, to have preschools adhere to a set of standards that are linked with the general cur- riculum, currently the law simply “suggests” that they should be. Therefore, a rec- ommendation for the ECD policy is to set a strong guidance on how the curriculum should be implemented so as to ensure equity in quality. A good example of how a community designed its program based on the Law for Preschool Education is the “EveryChild Project.” This model could be followed to strengthen the partnership between government and communities for curriculum design and implementation. The next set of recommendations are linked with effective implementation of the early learning program. Based on the review of laws and documents, it appears that the education sector has developed a very good tool for the implementation of a program, the MEST Administrative Instruction. This instruction is used in multi- ple different ways to ensure that the preschool programs are aligned with the Law on Preschool Education, such as giving instructions on how schools should create their annual work plans and conditions of defining costs of educational programs. However, these tools need to be strengthened for ECD program implementation. In particular, with the private sector beginning to play a role in early education service provision. Another dimension to improve quality of programs is to ensure that there is alignment between the community centers in accordance with the Law on Pre- school Education. The results of the review note that there is little alignment between the Community-based Center Strategy and the Preschool Law. It could be because the Community-based Center Strategy is from 2003 and the Preschool Law is from 2006. Regardless, the standards in the preschool are much higher and the standards in the community-based center should be revised to make it aligned. For example, standard 1: staff qualifications for community-based centers are much lower than stipulated in the Preschool Law. The community-based centers state; “All adults providing day care, looking after children or having unsupervised access to them are suitable to do so.” However, the Law clearly states minimum education credentials for such a job. Secondly, the quality of care standards is low in the community- based centers. For example “The caregivers should meet children’s individual needs and promote their welfare. They plan and provide activities and play opportunities to develop children’s emotional, physical, social, and intellectual capabilities.” How- ever, the goals of the Preschool Law are much higher and comprehensive. With respect to quality, the community-based center’s guidance is well articulated. This set of standards, in particular standards for adult-child ratios, physical space, safety, 80 etc., would be very useful to align with the Ministry of Education’s Administrative tool
  • 82.
    which is usedfor monitoring and supervision of preschool programs. Secondly, the Early Learning and Development Standards provide a comprehensive set of expec- tations for what children should know and be able to do. However, as has been stat- PART 3 RECOMMENDATIONS FOR ECD PROGRAMS AND POLICY IMPLEMENTATION ed, children do not develop in a vacuum, optimal contexts need to be created. The community-based standards could be aligned with the ELDS to ensure that there is a match between what the context is providing and what is expected of the children, so that both set of standards can achieve the same goals. The curriculum is a vital component of an effective early learning program. The curriculum seeds the content of learning and is the guide to the teachers for instruc- tion and interaction with the children. Therefore the existing curriculum needs to be revised by MEST, MOH, and MLSW. These main sectors, through a MoU would need to decide on who would be responsible for the revision. It would be vital to also involve NGOs and the private sector in the revision of the curriculum. The main aspects of the revision should make sure to reflect the science on play based learn- ing, the importance of teacher child interaction, attention to language of instruction and culturally sensitive and appropriate methods. A series of next steps are suggested to move forward the design, development and implementation of community-based early learning programs. First, munici- palities, sector ministries, NGOs and the private sector would have to come together in the early childhood education committee to adopt this recommendation. It is important that the municipalities are represented during the adoption process as community-based centers are supported by local levels of government. Secondly, the committee would have to develop an action plan for implementing community- based ECD centers. One of the primary tasks of the action plan is capacity building and training of the teachers and the staff who support the early learning programs. There will have to be provisions for pre-service and in-service training. Program ad- ministrators and parents training would include lessons on budgeting and finance. The plan of action also needs to determine how the early learning programs will link to primary school to ensure a smooth transition for children from pre-primary to pri- mary, as a predictor of school success. Costing for Early Learning Centers Enrolment in formal kindergarten in Kosovo is very low, and the unit costs are so high that it is unlikely that the formal kindergarten system can be increased sig- nificantly. As in other countries in its region, Kosovo has experimented with smaller ECD centers. In partnership with UNICEF Kosovo, we conducted a brief survey to investigate the cost structure of these ECD centers. Questionnaires were sent to and completed by the managers of eight centers providing information about the financial aspects of their operations. Given the limited sample size (n=8) and limited set of questions in the survey, the implications that can be drawn from the findings are limited. However, given the commonalities between the 8 centers and our prior experience in costing in other countries, including several in the region, it has been possible to provide a good indication of the overall costs of scaling up these centers. Moreover, this costing exercise combined an empirical approach, i.e., –observ- ing service delivery as it is with a normative approach, including components that are linked with effective and quality programs. Therefore the estimates are relevant and also help improve the quality of the existing programs. We present an example of class size to explain this point and also demonstrate that the costing exercise is based on a series of assumptions. The observed class size in some of the centers 81
  • 83.
    is 30 childrenper class. While this is the reality, this class size is considered too large for a good pedagogical process. Some international recommendations for ECD class size support 10 children per classroom. However, a class size of 10 is PART 3 RECOMMENDATIONS FOR ECD PROGRAMS AND POLICY IMPLEMENTATION financially inefficient because the costs of the teacher, the space, and the inventory. Therefore, we base our assumptions on a class size of 20 children per class. This size, while being larger than some recommendations, is within a realistic reach of most centers and a size that can work for learning and playing in ECD settings. We first examine the recurrent costs of human resources, then those of mate- rial expenses. Finally there is a short section about how to mobilize the financial re- sources to cover the recurrent costs of the centers, followed by a section on upfront investment (space, refurbishment). Human resources Based on the survey results, it is noted that salaries of educators vary greatly: from less than €100 per month to more than €300. In part, this variation is linked with difference in hours of service. For instance, some centers receive children of three, four and five years old in one group from 09:00 to 12:00, five days per week (so that children attend 15 hours per week), in other cases it is 3 days per week (resulting in 9 hours per week for each child). In such cases, the teacher basically has a part-time job. However, this operational schedule is not very efficient, since the center (the space, the inventory, the equipment) is used during just a small part of the week. More efficient is the model (see table below) where the children of three years old attend from 09:00 to 11:00, those of four years old from 11:00 to 13:00, and those of five years old from 14:00 to 16:00 (after the educator’s lunch break). This way, children receive an education that is well tuned to their specific age, during 10 hours per week45. The total material investment is used very efficiently: one equipped classroom is used by 3 * 20 = 60 children. We round off to 50 children assuming that in sparsely populated areas it is not always possible to fill up the classes to their maximum capacity. Table 8. Operational Schedule of Early Learning Centers Current operational schedule Age Age 3 Age 4 Age 5 All ages Rounded off Daily hours 09:00 – 11:00 11:00 – 13:00 14:00 – 16:00 Group size 20 20 20 60 50 Source: Yale University, The Edward Zigler Center of Child Development and Social Policy (2011). However, given the policy to universalize the pre-primary year for the five year olds, this operational schedule must be adapted to centers that eventually serve just the children of 3 to 4 years of age. By attending to the three year olds in the morning and the four year olds in the afternoon, it is possible to achieve two improvements at the same time: ■■ t is possible to expand instructional time, e.g. from two hours per class to two I and a half hours for the three year olds, and to three hours for the four year olds; ■■ nd there would even be more time available for the teacher for other work such A as preparation of classes and activities with parents. This point is important be- 45 This model is also found in other countries, e.g. in Macedonia. 82
  • 84.
    cause it isat this stage of development, when children are 3 years of age that the transition for families will occur from the parenting to the early learning program Table 9. Proposed Operational Schedule for Early Learning Centers PART 3 RECOMMENDATIONS FOR ECD PROGRAMS AND POLICY IMPLEMENTATION Proposed operational schedule Age Age 3 Age 4 All ages Rounded off Daily hours 09:00 – 11:30 14:00 – 17:00 Group size 20 20 40 35 Source: Yale University, The Edward Zigler Center of Child Development and Social Policy (2011). For the educator, this schedule results in a working day of two groups of five and a half hours in total. The remaining two and a half hours of the working day can be spent preparing the classes and supporting parents. For such a demanding full- time job, we propose a good salary of €300 per month, paid during all 12 months of the year. This sits near the upper bound of what we found in the eight centers, but we think educators deserve a salary that rewards them for hard and responsible work, and gives them a sense of pride. Only in this manner will working in the centers remain attractive. In practice, jobs like this can be shared of course. Two educators, each earning €150 per month could share the job and replace one another during illness or other forms of absence. A salary of €300 per month, paid 12 times per year makes €3600 per year. Divided by 35 children, this is about €100 per child per year. Regarding the caseload of supervisors, we found ample variation in the eight centers: from 2 to 20. Obviously, the roles of the supervisors differ accordingly. In those cases where the supervisors have a relatively low caseload, they tend to func- tion as managers rather than as supervisors in the sense of coaches that provide professional support. By contrast, where the case load is relatively high, it usually concerns supervisors who travel around between centers to visit educators, support them, observe their work, provide feedback, et cetera. Striking once again a balance between quality and efficiency, we assume that the centers operate in networks of 10 centers (attending a total of 500 children) and that the supervisor’s role is that of a professional that provides pedagogical guidance and replaces the teachers in case of illness, rather than that of a manager on a daily basis. With a caseload of 10 centers, the supervisor could visit each center once a week (one in the morning, one in the afternoon). Assuming an annual salary of €5000 (about €400 per month), the costs are about €15 per child per year. Refresher (in-service) training was found to cost €300-€400 per year per educa- tor. Per 35 children this makes €10 per child per year. The total costs of human resources (teacher + supervisor + refresher training) is €100 + €15 + €10 = €125 per child per year. Table 10. Recurrent Costs of Human Resources Recurrent costs of human resources Total salary costs for educator(s) per center €300 * 12 / 35 = € 100 Supervisor for 10 centers €400 * 12 / 350 = € 15 Refresher training for educators €350 / 35 = € 10 Total recurrent costs of human resources € 125 Source: Yale University, The Edward Zigler Center of Child Development and Social Policy (2011). 83
  • 85.
    PART 3 RECOMMENDATIONSFOR ECD PROGRAMS AND POLICY IMPLEMENTATION Material expenses The recurrent costs of material expenses concern: learning materials and inven- tory; the maintenance of the learning environment; and utilities and supplies. Here also we found some variation, but usually this could be attributed to the nature of the center. E.g. among the 8 centers there were two traditional kindergartens (a public and a private one) and their utility costs were very high due to the large space and the need to serve meals. Taking into account the life cycle of materials (some materi- als need regular replacement while others can be used for several years) we found that the recurrent material costs amount to €85 per child per year. Together with the €125 per child per year for human resources, this results in an overall recurrent unit cost of €210 per child per year. For comparison, the costs of traditional kindergarten are about €12546 per child per month (though this includes amortization of the capital investment). Table 11. Total Recurrent Unit Costs Total recurrent unit costs Human resources € 125 Material expenses € 85 Total recurrent unit costs € 210 Source: Yale University, The Edward Zigler Center of Child Development and Social Policy (2011). Mobilizing the financial resources Although the €210 is only a part of the cost, attention must be given to the upfront investment (which we address next, as it is the most important part). If the government of Kosovo can somehow ensure that it will cover a cost of €210 per year for each child of age three or four, the program can be considered to be sustainable. In the first part of this report, it was found that the annual number of children born in Kosovo is likely to stabilize at 32,000. Thus, the total number of children of three and four years old would be in the order of 64,000. From this number, we can subtract about 4,000 children of ages three and four who are enrolled in traditional (public and private) kindergarten. The remaining 60,000 children would cost €12 million annu- ally, which is close to only 10% of the education budget. A fee of €5 per child per month (paid during 10 months per year) would reduce the unit cost by €50 to €150 per child per year. Total costs for the government would then go down to € 9 million. For comparison: the public kindergartens, where only 5000 elite children are enrolled, cost the tax-payer € 6 million annually. Table 12. Overall Costs for ECD in Kosovo Overall costs Total number of children of ages 3 and 4 in Kosovo 32,000 * 2 = 64,000 Already enrolled in public & private KG 4,000 Excluded 60,000 Overall costs without fee €210 * 60,000 = € 12.6 million Overall costs with a fee of €5 per month, times 10 €160 * 60,000 = € 9.6 million Source: Yale University, The Edward Zigler Center of Child Development and Social Policy (2011). 84 46 The fee is €25 to €30 per child per month, and the government’s contribution is €75 to €125.
  • 86.
    PART 3 RECOMMENDATIONSFOR ECD PROGRAMS AND POLICY IMPLEMENTATION Upfront investment Thus far, we have just discussed the recurrent costs and their coverage. Now we touch upon the upfront investment such as the purchasing of a building and/or the costs of refurbishing and initial training of teachers. These costs can vary con- siderably depending on the local situation. It is not unusual with ECD centers such as these that the municipality makes a building or space available (e.g. in a community center or a school) and that the community assists in making the space safe and us- able. Sometimes parents make in kind contributions by donating carpets, paintings, or helping to fix the roof and paint the walls. Given this diversity, we propose to leave upfront investment out of the budget cycle and seek more incidental solutions, as these are indeed incidental costs. Local and international donors, for instance, could assist. While it is not wise to let recurrent costs depend on incidental inputs, it is de- fensible to make an exception for upfront investment, as long as recurrent costs are secured through the government budget and perhaps a small fee. Note: To consider and cautionary It should be repeated that both the € 12.6 million for the ECD Centers and the € 2 million of the parental support are but rough estimations, based on recommenda- tions by the authors of this report. Yet, these estimates do provide an indication of the order of magnitude of the costs. Policy makers in Kosovo may eventually arrive at other figures as they repeat the exercise, but these other figures are unlikely to differ very substantially. Area 2: Strengthening Governance for ECD The ECD program, as is being recommended for Kosovo, has two major types of programs that cut across the entire early childhood age range and need to be lead, supported and coordinated by a range of actors (See figure 23). Creating sus- tainable ECD programs requires infrastructure support to ensure that the programs and services are cohesive, coordinated and implemented effectively. These vertical interventions and comprehensive approaches to ECD service and planning and im- plementation require a governance infrastructure that outlines the roles and respon- sibilities of key members and stakeholders in the planning, coordination and imple- mentation of services. The recommendation below is to provide such a governance infrastructural support for the ECD Program. 85
  • 87.
    Recommendation a: Coordinatingeffective implementation of sustainable systems for ECD PART 3 RECOMMENDATIONS FOR ECD PROGRAMS AND POLICY IMPLEMENTATION Among the sampled documents, we noted very little multi-sectoral and/or com- prehensive approaches in the framing of objectives, activities and implementation systems (figure 21). Kosovo’s provision of ECD services remains primarily secto- ral and cross-sectoral. Literature suggests several reasons why comprehensive ap- proaches are invaluable for helping build and sustain ECD programs (Vegas, 2010). First, comprehensive approaches promote the participation of multiple stakeholders who often are not included and do not influence the political debate (such as working mothers and their children). Multiple stakeholder participation may inform the policy process from perspectives that are critical to driving demand, supply, and implemen- tation of programs. Second, as noted throughout this report, ECD and ECD policies cut across sectoral boundaries by involving health, education, and social planning sectors. These sectoral boundaries can result in the isolation, fragmentation, and, in some cases, lack of cohesion of ECD programs. In the absence of a comprehen- sive approach, there can be a subsequent absence of institutional anchors for ECD programs and challenges in identifying “champions” for ECD among government institutions. Third, some ECD investments are characterized by the long time horizon required to achieve tangible results. This, together with the short-to-medium-term planning horizon of many political actors, makes it difficult for ECD investment to become a high priority. To increase ECD effectiveness integrating budgets, planning and implementation processes, within and across ministries (horizontal) is strongly encouraged. With the aim of ensuring a cohesive ECD program that is effective and coordi- nated across sectors, a recommendation for governance is being made through an ECD Coordinating Committee. Described below are the structure, roles and respon- sibilities for this coordinating committee. Structure of the ECD Coordinating Committee Given that the programs and services impacting young children and families are going to be lead and be supported by different sectors, there is a need to institute a coordinating body that can ensure effective implementation. This coordinating body therefore needs to be comprised of representation from the key sectors and partners who are involved in ECD programming (See figure 25). It is suggested that the 3 lead ministries: MEST, MOLSW and MOH are represented in the Coordinating Commit- tee. However, as is evident, there are several NGOs who are also centrally involved in ECD programming. Therefore, representation from these organizations needs to be included in the ECD Coordinating Committee. In addition, in Kosovo, international development agencies, such as UNICEF play a central role in programming and poli- cies for children and families. It is important that representation from these agencies is included. Finally, given that the municipalities, in particular for the early learning centers, will be very involved in the planning, it will be important to have representa- tion of the municipalities on this committee. It should be noted that for the NGOs and municipalities, there are further sub-groups indicated in figure 25. This sub-grouping denotes that for NGOs and municipalities there are further sub-levels of functioning that would need to be included in this committee, in particular with attention to rural areas and ethnic minority populations. A chairperson should be elected to lead the committee for a term-period and a full time committee secretary should be hired to 86 oversee and organize all activities.
  • 88.
    Figure 25. Structureof ECD Coordinating Committee Prime Minister’s Office of Good Governance PART 3 RECOMMENDATIONS FOR ECD PROGRAMS AND POLICY IMPLEMENTATION ECD Coordinating Body International Development Agencies MOLSW MEST NGO’s MOH Municipalities Roles and Responsibilities The main purpose of the ECD Coordinating Committee is to integrate strategies and sectoral plans to ensure coordination in ECD services and programs. This com- mittee, because of its representations across all key stakeholders and partners can ensure that policies, plans and programs that directly address ECD, across sectors are coordinated effectively. The coordinating committee can work towards creating a shared vision for ECD across sectors and roadmap for effectively infusing ECD standards into programs across health, education and protection sectors. In order to ensure that this committee is neutral and also has legislative and ex- ecutive powers, it needs to be housed under the Office of Good Governance. In do- ing so, this committee will function under the auspices of the Prime Minister’s office and will be empowered to work across sectors without being subsumed into a sector or ministry. Further, under the auspices of the Prime Minister’s office the neutrality of this committee will be established. The following roles are suggested for the ECD Coordinating Committee: ■■ To raise awareness on ECD within the Government. As has been cited previous- ly, one of the challenges in moving forward a coordinated ECD program is the lack of awareness among key policy makers on the importance of ECD. There- fore a primary role of the coordinating committee will be to raise awareness and knowledge of the importance of ECD with the highest level of legislative and executive bodies in Kosovo. ■■ stablish an ECD Policy Steering Group. As indicated in Part 2 of this report, E while Kosovo has a plethora of strategies, policies and action plans that impact 87
  • 89.
    young children andfamilies, the ECD provisions and directives are unclear. Fur- thermore, the sectoral plans are fragmented. Therefore a steering group that will ensure that all policies and plans that directly impact ECD are clear and PART 3 RECOMMENDATIONS FOR ECD PROGRAMS AND POLICY IMPLEMENTATION coordinated, is required. The steering group should be comprised of technical experts who can review all policies to ensure that the principles of holistic ECD and CRC are upheld. When gaps are identified, the technical committee can make recommendations to revise the policy. For future policies and plans that will be developed, this group, under the auspices of the Prime Minister’s office can review them in advance and make recommendations to ensure that the principles of the ECD program are upheld. ■■ o ensure that the standards of the ECD Program are maintained. The recom- T mended ECD program for Kosovo has 2 major components, a parenting pro- gram and an early learning program. The roll out and scale up of this program will require quite a bit of coordination. After the program is developed, the sus- tained implementation will also require coordination and oversight. Therefore, it is recommended that a key function of the ECD Coordinating Committee is the oversight of the ECD program. The committee should perform the role of a regulatory body to ensure that the quality of the program is keeping with set standards. The committee should make recommendations when the program adheres to standards and when it does not. The standards should ensure that young children’s survival, growth, development and protection are incorporated and implemented by the ECD program. The immediate next step for the ECD Coordinating Committee is to finalize its membership, elect a chairperson and hire a secretary. Once these roles are filled and the committee membership is determined then the Terms of Reference for the group need to be drafted. Also the committee needs to consider carefully setting up a plan of action which details out the activities, timelines and indicators of effectiveness of the proposed ECD program. Given that the ECD program is currently a recommen- dation, if adopted by the ECD Committee then the committee will need to develop an action plan to establish the phases of implementation of the program. Conclusion Kosovo is clear in its commitment to its youngest citizens. The vast array of policy and legal documents has made it clear that children are an important con- stituency. However, the situation for Kosovar young children does not appear to be supported by the policy claims, in that they appear to be bearing the greatest burden of poverty and inequity. In order to redress this situation, programmatic and policy actions are recommended. These two areas are synergistic and inform each other such that they lead to cumulative benefits. By helping families, the most proximal context for human development will be supported and enhanced, but addressing early learning, from a development perspective, the second greatest influence on young children is addressed and by providing recommendations for governance, a systematic approach to ECD is strengthened. Taken together, these two recommen- dations will serve to improve child outcomes and build a sustainable system for ECD. 88
  • 90.
    Appendix I Appendix Table 13. Matrix-Sampled documents and preliminary classification of content Economic Education Health Protection Other development Law on Pre- Family Law school Educa- of Kosovo tion (2006) (2004) Law Law on edu- Law on So- cation in the cial and Fam- municipalities ily Services (2008) Policy Implementa- tion Plan Strategy for Integration Strategy for Health Sec- of Roma, Health Promot- tor Strategy Ashkali, and ing Schools in (2010 – 2014) Egyptian Kosovo Communities in Kosovo National Draft Education Strategy Strategic Plan (2011-2016) Participatory strategy de- velopment for education for rural people Disability Action Plan Action Plan for Kosovo (2009-2011) Early Learning and Develop- Breastfeed- ment Standards ing For Children National ages 0-6 Years Standards, The Kosovo Curricular Curriculum Frameworks Framework draft and Pro- Criteria for Com- grammatic munity Based Guidelines Centres In Kosovo Community based ECD pro- ject Phase 3 89
  • 91.
    Iodine Defi- ciency Dis- Indicators and orders (IDD)/ Statistical Data Kosovo Universal Salt Human rights Appendix in Education (2010) Pro- Iodization in Kosovo (2004-05, 05-06, gress Report (USI) Social 06-07) Mobilization Campaign Worried Souls: Vulner- Kosovo Un- Preschool able Children der UNSCR Country pro- education - the and Families 1244/99 file (World current situation in Mitrovica (2009) Pro- Bank) (2010) South, Ko- gress Report sovo Design and use of the data base National on social Data, Better parenting services for Situational UNICEF Birth initiative evalua- families and Analyses Registration tion (2009) children: and Program regulatory Evaluations purposes and case fol- low up (ppt) Method for esti- mating the Ko- sovo school age Governance population by report Ko- year of age AND sovo (2009) Kosovo school age population (2 xl files) Monitoring and Evaluation of Kosovo Better Parenting profile Initiative (BPI) Quality Educa- UNDP tion for All in Report Kosovo Balkan NGO learning centers Balkan NGO NGO Inter- summer pro- ventions gram Save the Chil- dren evaluation of CB Centers Develop- ment of Strengthen- Mid term Sector-Wide ing human Social Pro- expenditure Approach capital of grams, Hu- review in Kosovo Kosovo man Capital, Health Macroecono- Devolution mic Interven- of social tions services – main report 90 (2006)
  • 92.
    Table 14. Identificationof activities that may spill over into services concerning children 0-6 years of age Sector Strategies Appendix By 2016, capacities are built for all for improved and effective system management at the central and municipal levels, as well as for an effective management of schools – including mecha- nisms to involve more women in management By 2016, legislation is fully harmonized and finalized for the en- tire sub-sector of pre-university education By 2014, full responsibilities for management of finances are devolved from the central to municipality level and further from municipality to school level By 2016, quality assurance mechanisms are made fully func- tional at the central, municipal and school level By 2016, advisory and guidance services are coordinated at the central level and supported at municipality and school lev- els providing equitable access to professional and advisory and guidance services By 2016, curricula are developed, piloted and implemented for all school levels of pre-university education, followed by re- spective improvement in teaching and learning methodologies Pre-University Education and in student assessment and are gender screened By 2014, the teacher licensing system is fully functional and career development supported By 2016, an effective system is built that allows for inclusion of all students in compulsory education and training and is re- sponsive to gender and the needs of vulnerable, poor and dis- advantaged students By 2016, an effective network of upper secondary schools is set up that allows for inclusion of all children By 2016, schools have created non-violent and child-friendly environments that is supportive, caring and develops demo- cratic values in children and offers role models for all groups By 2016, at least one third of schools in Kosovo operate in a single shift, whereas the others in not more than two shifts, of- fering quality environment with an optimum number of students in classrooms By 2016, all schools in Kosovo are provided with standard pack- ages on a needs basis with instruction materials and resources adequate and fit for implementation of the new school curricula 91
  • 93.
    Sector Strategies By 2016, all administrative instructions on TD are harmonized with the effective legislation and are being implemented Appendix By 2016, at least 80 percent of MEST representatives (TTU and inspectors), MEDs and school principals are trained in accred- ited leadership and management programs and Gender Parity is improved By 2014, capacities have been built for needs assessment and evaluation of TPD By 2014, a Management Information System is in place for col- lection of training data By 2016, MEST accredits minimum 40 TPD programs based on teachers’ training needs By 2016, MEST in cooperation with the NQF certifies and li- censes trainers of TPD programs By 2016, 90 percent of teachers have renewed their licenses, whereas 5-10 percent have been promoted to a higher level ensuring equity and gender parity Teacher Education By 2016, school-based professional development has been established in all schools to ensure sustainability of training re- ceived By 2016, mechanisms are in place and functioning for monitor- ing and evaluation of training programs that is equitable and gender sensitive By 2016, at least 15 percent of education officers and teachers have participated in joint regional and international TPD pro- grams By 2014, prior learning in non-formal education and in-service training are recognized by teacher education faculties for pur- poses of teachers’ (re)qualification By 2016, all teacher education programs are fully harmonized with MEST policies, whereas 80 percent of their staff have been trained in TPD programs By 2016, there are increased research opportunities in teacher education faculties By 2011, an ICT Strategy is in place and operational By 2016, the provision of adequate infrastructure for ICT Information & Communi- By 2016, development of human resources cation Technology capable of applying ICT By 2016, draft curricular is in place that integrates the use of ICT and e-Learning aligned with international standards 92
  • 94.
    Table 15. OrganizationalStructure of MLSW until the moment of transfer of competencies in MDHSW (taken from the 2010 Policy Statement on Social Services, Association of Kosovo Municipalities Appendix Ministry of Labour and Social Welfare Permanent Secretary Department of ad- Department of Department Department Division of Central War Victims ministration of Pen- Social Welfare of Labour and of Institute for Services DFDIL sions Employment Social Policy Budget Plan- Division of Division of ning and As- Division of Social Social sessment Institutions Assistance Services of Poor Center for Shtimje/Stimlje House of Social - Special Insti- Holders- Work tution Prishtinë/Pristina House for chil- House of Children Graçanicë/Graca- Other Residential dren Shtime/ nica House Stimlje 93
  • 95.
    Appendix II Appendix Box-1 Overview of education system in Kosovo Strategy for Health Promoting Schools in Kosovo: A Description of Governance According to the Strategy for Health Promoting Schools in Kosovo, the Ministry of Educa- tion, Science and Technology is responsible for formulating, developing, and implementing policies and strategies in the field of education. The Kosovo Consolidated Budget within the Ministry of Economy and Finance provides funding for the different levels of education. MEST, by conducting the process of decentralization, has 7 Regional Education offices, led by regional education officials, and 30 units within municipalities, appointed as Directorate’s of Education, led by municipal directors of education. Municipal directorates report to the municipal assemblies, respectively local authorities, whilst Regional offices report to the Ministry. Table 16. Overview of projected costs for the education sector until 2016 and beyond (taken from KESP) 2011-2016 2011-2016 Annual 2011-2016 Sub-sector development recurrent recurrent costs total cost cost costs beyond 2016 1. Pre-University 237 037 324 130 156 480 367 193 804 30 279 150 (PreU) 2. Preschool (PSE) 3 217 050 17 742 085 20 959 135 3 620 920 3. Vocational Train- 23 140 950 18 146 760 41 287 710 4 310 350 ing (VET) 4. Teacher Prof Dev 2 913 310 7 770 900 10 684 210 1 501 410 (TE) 5. Higher Education 40 611 300 72 826 200 113 437 500 21 249 860 (HE) 6. Adult Education 538 800 2 795 940 3 970 440 1 388 260 (AET) 7. Information and Communication 34 325 700 26 261 800 60 587 500 5 976 800 Technology (ICT) Total 341 784 434 275 700 165 618 120 299 68 326 750 94
  • 96.
    Appendix III Appendix List of figures (Parts 1-3) No. Title Page 1 Demographic profile of Kosovo, 2011 14 2 Number of births in Kosovo, 1981-2007 15 3 Ethnic composition of Kosovo, 2010 16 4 Live births by ethnicity, 2009 16 5 Children 0-18 in Pre-University education in Kosovo, 2010 17 6 GDP growth in Kosovo, 2002-2011 19 7 Sectoral breakdown of government spending, 2005-2007 21 8 Health expenditure as a percentage of GDP in selected countries, 2005-2008 21 9 Education expenditure as a percentage of GDP in selected countries, 2005-2008 22 10 Spending on Social Protection in Kosovo and Selected Countries, 2008 23 11 Per capita GDP in Kosovo in €, 2003-2012 24 12 Under-coverage and leakage in the social assistance scheme, 2003-2006 27 13 Life expectancy at birth in selected countries, 2008 29 14 Infant and Under Five Mortality (per 1,000 births) nearby countries, 2005-2009 30 15 Moderate and severe stunting in selected countries, 2007-2009 32 16 Health Spending as Share of GDP and of Total Government Spending, 2004-2009 33 17 Number of health professionals per 1,000 inhabitants, selected countries, 2001-2006 33 18 Numbers of enrolled children in three early childhood programs, 2004-2009 37 19 Preschool enrolment by per capita GDP in the wider region, 2008 40 20 Unit costs as % of per capita GDP in kindergarten in six countries, 2007-2010 41 Sectoral involvement in Strategies and Plans & analysis of overarching and 21 50 ECD-specific objectives Strategic Objective-1 from the Health Sector Strategy: Reduce morbidity and 22 59 mortality of the overall population 23 Overview of Recommendations for ECD Programs and Policy Implementation 63 24 Costing simulation tool for parenting program 72 25 Structure of ECD Coordinating Committee 83 95
  • 97.
    List of tables(Parts 1-3) No. Title Page Appendix 1 List of agencies and data sources 11 2 Trend in poverty by location in Kosovo, 2002-2006 18 3 Municipalities’ budgets for health, social welfare and education, 2009-2012 20 4 Poverty rates in Kosovo according to various definitions, 2006-2007 25 5 Core indicators for Kosovo’s education system, school-year 2008-2009 34 List of boxes (Part 1) No. Title Page Insights from the team’s visit to a rural Community 1 43 Based ECE Center in Shkabaj 96
  • 98.
    SELECTED REFERENCES AAlderman, H.,& King, E. (2006). Investing in Early Childhood Development. Washington, DC: World Bank Publication. Arnold, C. (2004). ‘Positioning ECCD in the 21st Century’, Coordinators’ Note- book, no. 28, Consultative Group on Early Childhood Care and Development, pp. 1-34. Balkan Sunflower. (2010). Learning Centers Network Newsletter, Autumn 2010. Pristine, Balkan Sunflower. Bartlett, S. (2005). Water, sanitation and urban children: The need to go beyond “improved” provision. Children, Youth & Environments, 15, 115-37. Black, R.E., Morris, S.S., & Bryce, J. (2003). Where and why are 10 million children dying every year? Lancet, 361, 2226-34. Bornstein, M.H. (2006). Parenting science and practice. In W. Damon (Series Ed.) and K.A. Renninger and I.E. Sigel (Vol. Eds.) Handbook of child psychology; Vol. 4. Child psychology in practice (6th ed., pp 893-949). New York: Wiley. Bowman, B., Donovan, M.S., & Burns, M.S. (2001). Eager to learn: Educating our preschoolers. Washington, DC: National Research Council. Britto, P.R. (2002). Children’s Rights. In N. Salkind, (Ed.) Macmillan Psychology Reference Series, Vol. 1: Child Development. p. 84. New York: Macmillan Refer- ence USA. Britto, P.R. (2010). School Readiness and Child National and International Devel- opment. New York: UNICEF. Britto, P.R. Cerezo, A., & Ogbunugafor, C.B. (2008). How evidence can be used to inform policy: A case study of early childhood evidence-bawse4d policy develop- ment. International Journal of Early Childhood, 40, 2, 101-18. Britto, P.R., Engle, P., & Alderman, H. (2007). ‘Early Intervention and Caregiving: Evidence from the Uganda Nutrition and Child Development Program’, Child Health Education, vol. 1, no. 2, pp. 112-33. Britto, P.R., Fuligni, A.S., & Brooks-Gunn, J. (2006). Reading Ahead? A Review of Early Literacy Intervention Programs for Young Children from Low Socioeco- nomic Families. In. D. Dickinson & S. Neuman (Eds.), Handbook of Early Literacy (pp.311-332). New York: Guilford Press. Britto, P.R., & Kagan, S.L. (2010). Global Status of Early Learning and Develop- ment Standards. In P. Peterson, E. Baker, & B. McGraw, (Eds), International Ency- clopedia of Education. Vol. 2, pp. 138-143. Oxford: Elsevier. Britto, P.R., Ulkuer, N., & Meyers, C. (2009). Impact of the economic crises on early childhood development: An examination of mediating pathways with implications for national policy. Paper presented, ODI/UNICEF Conference. London, England. 97
  • 99.
    Bronfenbrenner, U. (1979).The Ecology of Human Development: Experiments. Brooks-Gunn, J., Britto, P.R. and Brady, C. (1999). ‘Struggling to Make Ends Meet: Poverty and child development’, Chapter 14 in Parenting and Child Development in “Non-traditional” Families , edited by Michael E. Lamb, Laurence Erlbaum As- sociates, Mahwah, NJ, pp. 279-304. Cheung, Y.B., Yip P.S.F., & Karlberg, J. (2001). Fetal growth, early postnatal growth, and motor development in Pakistani infants. International Journal of Epidemiol- ogy, 30, 66-72. Commission of the European Communities. (2002). Communication from the Commission – European benchmarks in education and training: follow-up to the Lisbon Council. Brussels, Commission of the European Communities. Commission of the European Communities. (2008). Joint report on Social Protec- tion and Social Inclusion. Brussels, Commission of the European Communities. Commission of the European Communities. (2009). Kosovo under UNSCR 1244/99 2009 Progress Report. Brussels, Commission of the European Communities. Connell, C.M., & Prinz, R.J. (2002). Impact of children and parent-child interaction on school readiness and social skills development for low-income African-Ameri- can children. Journal of School Psychology, 40, 177-93. Consultative Group on Early Childhood care and Development. (2010). 4 Corner- stones to secure a strong foundation for young children. http://www.ecdgroup. com/pdfs/2008-FLYR-E-CLR-SEP08.pdf. Davidson, R.J., Lewis, D.A., Alloy, L.B., Amaral, D.G., Bush, G., Cohen, J.D., Drevets, W.C., Farah, M.J., Kagan, J., McClelland, J.L., Nolen-Hoeksema, S., & Peterson, B.S. (2002). Neural and behavioral substrates of mood and mood regu- lation. Biol Psychiatry. Sep 15;52(6):478-502. Engle, P., Black, M., Behrman, J., Cabral de Mello, M., Gertler, P., Kapiriri, L., Martorell, R., & Young, M. (2007). Strategies to avoid the loss of developmental potential in more than 200 million children in the developing world. In: The Lancet, 369 (9557, 20 January, pp. 229-42. Garbarino, J., Dubrow, N.,Kostelny, K., & Padro, C. (Eds.) (1992). Children in dan- ger: Coping with the consequences of community violence. San Francisco, CA: Jossey Bass. Gassman, F., & K. Roelen. (2009). The Impact of the Social Assistance Cash Ben- efit Scheme on Children in Kosovo. Maastricht, Universiteit van Maastricht. Government of Kosovo. (2009). Midterm Expenditures Framework 2010-2012. Pristine, Government of Kosovo. Gueoruieva, A. (2008). Good Program, Good Investment. Policy Note on the Ko- sovo Social Assistance Program. Washington DC, World Bank. Hart, J. (2008). Business as usual? The global political economy of childhood poverty. Young Lives Technical Note, 13. Heckman, J.J., & Krueger, A.B. (Eds.) (2003). Inequality in America: What role for human capital policies? Cambridge, MA: MIT Press. 98
  • 100.
    HMO solutions. (2007).Budget and legal analysis of early childhood education in Kosovo. Pristine, Save the Children Alliance. Hormann, E. (1999). Report on breastfeeding consultancy in Kosovo. WHO. Jaramillo, A., & Tietjen, K. (2001). Early childhood development in Africa: can we do more or less? A look at the impact and implications of preschools in Cape Verde and Guinea. World Bank, Washington, D.C. Kagitcibasi, C., Sunar, D., & Bekman, S. (2001). Long-term effects of early inter- vention: Turkish low-income mothers and children. Journal of Applied Develop- mental Psychology, 22, 333-61. Lopez, A.D. (2000).Reducing child mortality. Bulletin of the World Health Organi- zation, 78, 1173. Hart, B., & Risley, T.R. (1995). Meaningful differences in the everyday experience of young American children. Baltimore, MD: Paul H. Brookes Publishing Co. Hodgkin, R., & Newell, P. (2007). Implementation handbook for the Convention on the Rights of the Child. Geneva, Switzerland: UNICEF. Kariger, P.K., Stoltzfus, R.J., Olney, D., et. al. (2005). Iron deficiency and physical growth predict attainment of walking but not crawling in poorly nourished Zanzi- bari infants. Journal of Nutrition, 135, 814-19. Kuklina, E.V., Ramakrishnan, U., Stein, A.D., Barnhart, H.H., & Martorell, R. (2004). Growth and diet quality are associated with the attainment of walking in rural Gua- temalan infants. J Nutr. Dec;134(12):3296-300. Lopez, A.D. (2000). Reducing child mortality. Bulletin of the World Health Organi- zation, 78, 1173. Mankiw, N.G., Romer, D. & Weil, D.N. (1992). A Contribution to the Empirics of Economic Growth’, Quarterly Journal of Economics, vol. 107, pp. 407-37. McCartney, K., & Phillips, D.A. (Eds.) (2006). Handbook of Early Childhood Devel- opment. Oxford: Blackwell Publishing. Ministry of Education, Science and Technology. (2008). Draft Education Strategic Plan 2011-2016. Pristine, Ministry of Education, Science and Technology. Ministry of Education Science and Technology. (2008/2009). Kosovo Education in Figures 2008/09. Pristine, Ministry of Education, Science and Technology. Ministry of Education, Science and Technology. (2010a). Second draft of the Cur- riculum Framework for pre-school, primary, secondary and post-secondary edu- cation. Pristine Ministry of Education, Science and Technology. Ministry of Education, Science and Technology. (2010b). Kosovo Education Stra- tegic Plan 2011-2016. Pristine Ministry of Education, Science and Technology. Ministry of Health at al,. (2010). Perinatal Situation in Kosovo for 2000-2009. Pris- tine Ministry of Health. Mitrovica/e Institute for Health. (2008). An early draft of the HDR referred to this study. Montie, J.E., Xiang, Z., & Schweinhart, L.J. (2006). Preschool experience in 10 99
  • 101.
    countries: Cognitive andlanguage performance at age 7. Early Childhood Re- search Quarterly, 21, 313-31. Murphy, D.A. & Burns, C.E. (2002). Development of a comprehensive community assessment of school readiness. Early Childhood Research and Practice, 4, 1-5. Osofsky, J.D. (Ed.) (1997). Children in a violent society. New York: Guilford Press. Pianta, R.C. & McCoy S.J. (1997). The first day of school: The predictive validity of early school screening. Journal of Applied Development Psychology, 18, 1-22. Richter, L. (2004). The importance of caregiver-child interactions for the survival and healthy development of young children: A review. Geneva: World Health Or- ganization. Rodier, P.M. (2004). Environmental causes of central nervous system maldevelop- ment. Pediatrics. Apr;113(4 Suppl):1076-83. Rouse, C., Brooks-Gunn, J., & McLanahan, S. (2005). Introducing the issue, ‘School readiness: Closing racial and ethnic gaps’. The Future of Children, 15(1), 5-14. Shala, M., & L. Luzha. (2010). Pre-school Education – the current situation. Pris- tine. Shonkoff, J.P., & Phillips, D.A. (2000). From neurons to neighborhoods: The sci- ence of early childhood development. Washington, D.C: National Academy Press. Statistical Office of Kosovo. (2008a). Demographic changes of the Kosovo popu- lation, 1948-2006. Pristine, Statistical Office of Kosovo. Statistical Office of Kosovo. (2008b). Analysis of the Vital Statistics for the Newest Period of Time. Pristine, Statistical Office of Kosovo. Statistical Office of Kosovo. (2009). Social Welfare Statistics 2009. Pristine, Sta- tistical Office of Kosovo. Statistical Office of Kosovo. (2010a). Statistics of Births in Kosovo 2009. Pristine, Statistical Office of Kosovo. Statistical Office of Kosovo. (2010b). Education Statistics 2008-2009. Pristine, Statistical Office of Kosovo. Szczurek, A. (2005). Community Based Early Childhood Education Project Phase 3. External evaluation report. Pristine. EveryChild Kosova Organization. UNDP, forthcoming47. Human Development Report of Kosovo. Pristine, United Nations development Program. UNESCO. (2004). Education for All Global Monitoring Report. The Quality Impera- tive. Paris, UNESCO. UNICEF. (2002a). Facts for life. New York: UNICEF, WHO, UNESCO, UNFPA, UNDP, UNAIDS, WFP, and the World Bank. UNICEF (2005). Convention on the Rights of the Child. Retrieved January 19, 2010 from http://www.unicef.org/crc/. 47 The authors have received draft versions of various chapters of the Human Development Report. It may be the case that the 100 content and pagenumbers of the final version differ from that draft version.
  • 102.
    UNICEF Kosovo. (2010).Child Poverty in Kosovo. Policy Options Paper and Syn- thesis Report. Pristine, UNICEF Kosovo. United Nations Kosovo Team. (2008). Strengthening the Human Capital of Koso- vo. Paper prepared for the International Donor Conference for Kosovo, Brussels, 11 July 2008. UNMIK. (2003). The Kosovo Greenbook. A Strategy for Sustainable Agricultural and Rural Development in Kosovo. Pristine, UNMIK. Vegas, E. (2010). Promising models for early childhood development in Latin America. Meeting of the National Forum for Early Childhood Programs and Poli- cies, Chicago, IL, May. Van Ravens, J., 2010. Fair Play. A financially feasible plan for equal access to Early Childhood Programs in the Republic of Macedonia. Skopje, UNICEF. Vogler, P., Crivello, G. and Woodhead, M. (2008). Early Childhood Transitions Re- search: A review of concepts, theory, and practice. Working Paper 48, Bernard van Leer Foundation, The Hague, 2008. Vygotsky, L. (1998). The Collected Works of L.S. Vygotsky. NY: Plenum Press. WHO. (1999). The critical link: Interventions for physical growth and psychological development.Geneva, Switzerland: WHO. World Bank. (2006).Global Monitoring Report 2006. Washington, DC: World Bank. World Development Indicators (14 September 2007). World Bank: Indicators Da- tabase. World Bank. (2007). Kosovo Poverty Assessment. Volume 1: Accelerating Inclu- sive Growth to Reduce Widespread Poverty. Washington DC, World Bank. World Bank. (2009). Pre-employment Skills Development Strategies in the OECD. Washington DC, World Bank. Zigler, E.F., Gilliam, W.S., W.S., & Jones, S.M. (2006). A vision for universal pre- school education. New York: Cambridge University Press. 101
  • 103.
    The findings, interpretationsand conclusions set out by the authors in this report do not necessarily reflect the official position of UNICEF. Unicef, the United Nations’ Children’s Fund, is charged by the UN General Assembly with the protection of children’s rights worldwide, so that every child may enjoy a good upbringing and personal development commensurate with their abilities. Further information: UNICEF Ali Pashe Tepelena, No. 1 10000, Pristina, Kosovo Tel. +381 38 249 230 Fax +381 38 249 234 prishtina@unicef.org www.unicef.org/kosovo Design: www.xhad.net
  • 104.
    United Nations Children’s Fund– UNICEF Ali Pashë Tepelena, No. 1 10000, Pristina, Kosovo Tel. +381 38 249 230 Fax +381 38 249 234 prishtina@unicef.org www.unicef.org/kosovo